SlideShare a Scribd company logo
1 of 14
Download to read offline
1
Abstract
This paper aim to examine the GDP of Nepal. GDP is related to the economic growth of country.
Economic Growth is a quantity terms as it represents quantitative increase in production of goods
and services. GDP is the market value of all final goods and services produced in a domestic
territory. Both GDP and GNP contribute to economic growth of country but in this paper we only
study GDP of Nepal. In this paper we study of GDP from different activities from Annual Year
2018 to 2022.Although Nepal is improving in GDP. In the year 2022 Nepal GDP is $40.15 billion.
But If we compare Nepal’s GDP to the China and India and Australia it shows Nepal is a far way
in the name of Economic growth. In the year 2022 China GDP is $17.73 trillion. In the year 2022
India GDP is $ 3.5 trillion and if we look to the Australia GDP in the year 2022 $1.7 trillion.
Although Nepal territory is not as large as China and India but in terms of growth and development
Nepal is still backward to the rest of world. In Nepal economic activities are very less.
Approximately 66% of the total population relied on the agricultural sector for their livelihood.
Similarly Remittance is second priority of people in Nepal.
Nepal is a unique country with big markets in the neighbors India and China but remains as one
of the poor landlocked developing countries, even being the earlier entrant in liberalization and
reform. Nepal recently went through a substantial political transition and now the stable
government is seeking substantial amount of foreign direct investment. In this background, it will
be better, for a good policy analysis, to know how the financial activities have played the role in
highly intended economic growth. Paudel, R., & Acharya, C. P. (2020).
Public spending accelerates both physical and human capital over time. In the short term,
appropriate public spending on health, manufacturing, transportation, human capital, and
communication all could boost up economic growth (Balaj & Lani2017). Nepal also is a
developing country so it must focused on public spending.
2
Introduction
When did economic growth begin? A traditional view holds that economic growth began with the
Industrial Revolution around 1800. Recent work has challenged this view pushing the date of the
onset of growth back. Crafts (1983, 1985) and Harley (1982) revised downward previous estimates
of growth in Britain during the Industrial Revolution. These new estimates indicate that British
output per capita was larger by the mid-18th century than was previously thought implying that
substantial growth must have occurred at an earlier date (see also Crafts and Harley, 1992).
Acemoglu, Johnson, and Robinson (2005) argue that a First Great Divergence occurred starting
around 1500 with Western Europe growing apart from other areas of the world following the
discovery of the Americas and the sea route to India. They support this view with data on
urbanization rates. Broad berry et al. (2015) argue that growth began even earlier than this. They
present new estimates of GDP per person for Britain back to 1270. These data show slow but
steady growth in GDP per person from the beginning of their sample. Finally, Kremer (1993) uses
world population estimates to argue for positive but glacially slow growth for hundreds of
thousands of years
Economic growth is the process whereby the real per capita income of the country increases over
a long period of time. Economic growth enables the economy to produce more goods and services
and thereby raises the standard of living of the people at the country. Economic growth is an
increase in the production of economic goods and services in one period of time compared with a
previous period.. Economic growth is the name of more production which is measured in terms of
an increase in real gross national product over a time or an increase in per capita income.
Economic growth is the increase in the production of goods and services in an economy. Increase
in capital goods labor force technology and human capital can all contribute to economic growth.
Economic growth refers to an increase in the real output of goods and services in the country. It
brings quantitative changes in the economy. Economic growth is a more relevantmetric for
progress in developed countries but it is widely used in all countries because growth is a necessary
condition for development. Growth is concerned with increase in the economy’s output. Economic
growth is measured in terms Gross National Product(GDP) and Gross Domestic product(GDP).
Simon Kuznets. An expert in statistics, mathematics and economics, he developed a standard way
of measuring the gross national product or GNP of the US. It would give an idea of just how much
goods and services were produced by American-owned companies, whether at home or abroad. A
few years later, Kuznets also developed GDP.
GDP was the sum of the value of all goods and services produced in a country each year (and,
unlike GNP, excluded the value of US-owned facilities abroad). It could be measured either by
adding the value of all finished goods and services, and subtracting the cost of intermediary
products, or you could find it by adding up all salaries, profits and investment incomes.
The most common way to calculate it was the so-called “expenditure approach”. It calculates total
GDP as: Gross Domestic Product = Consumption + Government Expenditure + Private Investment
+ Exports – Imports
3
(From an economic perspective, all those sums should add up to the same: aggregate production =
aggregate income = aggregate expenditure.)
Kuznets’ invention was a stroke of genius. It summarized in one number the economic strength of
the entire nation and gave policymakers hints on to how to improve it. During the remainder of the
1930s, other economists helped standardize and popularize it, and by the time the Bretton Woods
conference was held in 1944, GDP was confirmed as the main tool for measuring economies
around the world.
Since then, GDP has become something of a talisman. When GDP is growing, it gives people and
companies hope, and when it declines, governments pull out all the policy stops to reverse the
trend. Although there were crises and setbacks, the story of the overall global economy was one
of growth, so the notion that GDP growth is good, reigned supreme.
In the 30 or so years after the Second World War, reporting GDP was a recurring triumph,
especially in the West. It was the “Golden Era of Capitalism” in America, the “Wirtschaftswunder”
in Germany, and the “Trente Glorieuses” in France. Nominal GDP growth could reach 10% or
more, and in real, inflation-adjusted terms still often topped 5%.
But there is a painful end to this story, and we could have foreseen it had we better listened to
Kuznets himself. In 1934, long before the Bretton Woods Agreement – and before even the scepter
of war – Kuznets warned US Congress not to focus too narrowly on GNP or GDP: “The welfare
of a nation can scarcely be inferred from a measure of national income,” he said.
This assessment proved prescient. GDP tells us about aggregate consumption, but it does not tell
us about personal well-being. It tells us about production, but not about the pollution that comes
with it, or the depletion of natural resources it requires. It tells us about government expenditure
and private investments, but not about the quality of life they generate.
Oxford economist Diane Coyle told us in a recent interview that, in reality, GDP was “a war-time
metric.” It tells you what your economy can produce when you’re at war – as was the case in the
early 1940s – but it does not tell you how you can make people happy when you’re at peace. It
tells you how valuable trees are when you cut them down and turn them into fences or benches,
but not what they’re worth when left standing.
Despite early warnings from its inventor, GDP conquered the world. Everything was done to prop
up its growth. Roads and highways were built, personal consumption encouraged, industry and
transportation were subsidized, and so on. But, starting in the 1970s, the GDP growth story did
start to cool down, first in the West, then globally.
But, as global annual GDP peaked, our ecological footprint did so too, leading to an ecological
deficit. Forests were cut to make way for agriculture and industry, oceans were depleted of their
fish stocks, and fossil fuels were burned and polluted the air, leading to climate change. In the
short-term that lead to growth, in the long-term it damaged our health, wealth and well-being.
4
To reinvigorate GDP growth in the 1980s, governments liberalized industries and opened to trade,
in the hopes it would spur competition, and unleash a new wave of economic growth. That did
happen at first, but by the 2000s, its side effects became clear: rising market concentration and a
declining labour share of income. Median incomes stagnated, and public services worsened.
The result is that the magic formula of GDP growth now seems exhausted. In the West, GDP does
not grow like it used to, and well-being stopped increasing a long time ago. A feeling of permanent
crisis has taken hold of societies, and perhaps with good reason. As Kuznets knew, we never should
have made GDP growth the singular focus of policymaking. Alas, that is where we are today.
GDP is the market value of all final goods and services produced within the domestic territory of
a country during a particular time period. GDP measures the monetary value of final goods and
services that is those that are bought by the final user produced in a country in a given period of
time. It counts all of the output generated within the boarders of a country. GDP is composed of
goods and services produced for sale in the market and also includes some non -market production
such as defense or education services provides by the government. If depreciation subtracted from
GDP we get net domestic product.
GDP can be measured in terms of Real GDP or Nominal GDP. To determine real GDP its nominal
value must be adjusted to take in account its nominal value must be adjusted to take in account
price changes to allow us to see whether the vaue of output has gone up because more is being
produced or simply because prices have increased. A statistical tool called the price deflator is used
to adjust GDP from nominal to constant prices.
GDP is important because it gives information about the size of the economy and how an economy
is performing. The growth rate of real GDP is often used as an indicator of the general health of
the economy. In broad terms an increase in real GDP is interpreted as a sign that the economy is
doing well. When real GDP is growing strongly employment is likely to be increasing as
companies hire more workers for their factories and people have more money in their pockets.
When GDP is shrinking as it did in many countries during the recent global economic crisis
employment often declines.
An increase in exports increases GDP because they bring in more revenue from foreign nations
through the goods that are exported. Imports, on the other hand, do not affect GDP since they are
not produced domestically. Net exports, like exports, also increase GDP so long as they are
positive. If they are negative they will decrease GDP.
5
GDP of different province of Nepal
Nepal has seven province. Province one has 14 districts. Province 2 which is called Madesh
province has 8 districts. Province 3 which is also called Bagmati province has 13 districts. Province
4 which is Gandaki province has 11 districts. Lumbini province is province 5 which has 12
districts. Karnali province is province 6 and it has 10 districts and sudurpachim province has 9
districts which is province number 5.
Agriculture is the primary economic activity in Province No. 1, with the majority of the population
engaged in farming. It has significant tourism potential due to its natural beauty and cultural
heritage. It has a growing industrial sector, with several large and small-scale industries operating
in the province. It has a strategic location, bordering India in the south and Tibet Autonomous
Region of China in the north. It has been investing in developing its infrastructure, including roads,
airports, and hydropower projects. Agriculture and forest is the mainstay of Madesh province
economy, providing a livelihood for three-fourths of the population. Industrial activity mainly
involves the processing of agricultural produce including jute, sugarcane, tobacco, and grain
Bagmati is leading in GDP among all others province. Bagmati’s growth is helped by key
economic activities like administrative and support services, finance and insurance, real estate and
professional, and scientific and technical. Agriculture and tourism is the mainstay of Gandaki
province.
Agriculture, forest and tourism are the mainstay of Lumbini province economy. Agriculture and
forest is the mainstay of province economy, providing a livelihood for three-fourths of the
population. Industrial activity in the Karnali province accounts very low. Agriculture and forest is
the mainstay of province economy, providing a livelihood for three-fourths of the population.
Industrial activity in the province accounts very low.
Figure:1 GDP of different province in the year 2022.
15.7
13.3
36.9
8.9
14.1
4.1
7
GDP Of Different Province
Province 1 Madesh Bagmati Gandaki Lumbini Karnali Sudurpachim
6
The pie chart illustrates how different is GDP in different Province percentage wise in the year
2021/22. Pie chart compare GDP produce by seven province. Overall Bagmati province has
highest GDP as it has mostly urban areas and the economic activities are occurring in more range
while Karnali province has lowest GDP as it has mostly rural areas and economic activities are
occurring in less range.
Looking at the information in more detail we can see that Province 1 has 15.7% of GDP which is
second highest GDP after Bagmati province. Similarly Madesh province has 13.3 % of GDP.
Bagmati province has highest GDP by producing 36.9% of GDP. However Gandaki province has
8.9% of GDP. Lumbini province has 14.1 % of GDP. By contrast Karnali province has lowest GDP
by producing precisely 4.1% of GDP and Sudurpachim province produce 7% of GDP which is
second lowest GDP.
7
Objective of study
The core objectives of the study is to analysis current GDP situation of Nepal. Besides that the
objectives of study are:
• To know the different economic activities of Nepal
• To be familiar with Government Policies.
• To know the status of economic growth.
• To gain the knowledge of GDP and economic growth.
• To know the GDP of Nepal from the basis year 2018-2022.
• To know GDP of Nepal and its components.
Limitation of study
• The major limitation of the project can be discussed below:
• The paper is based on secondary data.
• The study only focus on GDP and Economic growth.
• The study is limited on websites, books and magazine.
• This study don’t analyze every details of economic activities.
• This study only analyze data from the year 2018-2022 and it don’t include the data before
2018.
8
GDP of Nepal:
For the past two years, the economy affected by the Covid-19 pandemic has moved in the direction
of normalization. Overall economic activities, including industrial production and trade business,
are gradually returning to normal. In addition to domestic demand, there has been a higher increase
in both exports and imports. However, the economy is heading towards bigger challenges
following the endorsement of Replacement Bill in late September, damage in paddy production
due unseasonal rains in November, rising prices of petroleum products, liquidity crunch in the
financial sector and declining foreign exchange reserves. The expansion of industry and service
sector is expected to be satisfactory despite the adverse conditions witnessed in the external sector.
Nepalese economy is expected to expand by 5.84 percent in FY 2021/22 following the gradual
normalization of socio-economic activities due to gradual diminishing of Covid19 impact and
encouraging expansion of energy sector. In addition, Nepal's economic growth at basic prices is
estimated to be 5.49 percent. In FY 2019/20, the economic growth was negative by 2.37 percentage
as compared to 4.25 percentage in the previous fiscal year. In FY 2021/22, total value added of
agriculture and non-agriculture sector is estimated to increase by 2.30 percent and 6.88 percent
respectively. In the last fiscal year, the total value added of agriculture sector increased by 2.85
percent while the total value added of non-agricultural sector increased by 4.25 percent. Despite
the decline in paddy production by 8.7 percent in FY 2021/22, the total value addition of the
agriculture sector is expected to grow due to the increase in the total value addition of fisheries
sector. In the nonagricultural sector, the growth rate of total value addition in most sectors
including electricity and gas, housing and food, construction, industry, mining and health sector is
estimated to be higher than the last fiscal year.
The growth rates of primary sector, secondary sector and service sector are estimated to be 2.4
percent, 10.3 percent and 5.9 percent respectively in 2021/22. Such growth rates were 3.0 percent,
4.4 percent and 4.2 percent respectively in FY 2020/21. Average growth rates for the primary,
secondary and service sectors over the last decade were 2.8 percent, 5.3 percent and 4.7 percent
respectively. The average growth rate in the six years after the earthquake is higher than in the last
ten years.
The GDP of Nepal has improve in 2022 however it was declining in the year 2019. There are
various sector which contribute the GDP of Nepal.
9
Figure:2 GDP from different activities of annual year 2018-19
In the year 2018/2019 the GDP is almost increasing there isn’t any economic activities which is
declining. In the year 2018/2019 Mining has highest of GDP followed by Accomodation and food
service activities with 9.91% f GDP whereas water supply has the lowest of GDP.
• Agriculture Forestry and Fishing has 5.26% of GDP.
• Mining has 17.62 % of GDP.
• Manufacturing has 6.52% of GDP.
• Electricity, gas, stream and air conditioning supply 9.61 % of GDP.
• Water Supply has 1.22% of GDP.
• Construction has 7.48% of GDP.
• Wholesale and retail trade has 8.11% of GDP.
• Transportation and storage has 8.77% of GDP.
• Accomodation and food service activities has 9.92% of GDP.
• Information and Communication has 7.05% of GDP.
• Financial and Insurance has 6.35% of GDP.
• Real estate activities has 3.75 of GDP.
5.16
17.62
6.52
9.61
1.22
7.488.118.779.92
7.056.353.755.616.445.125.986.695.925.16 6.9
0
2
4
6
8
10
12
14
16
18
20
PERCENTAGE
INDUSTRIAL CLASSIFICATION
GDP From Different Activities Of Annual
Year2018/19
10
• Professional, scientific and technical activities has 5.61% of GDP.
• Administrative and Support service activities has 6.44%of GDP .
• Public Administration and defense has 5.12% of GDP.
• Education has 5.98% of GDP.
• Human health and social work activities has 6.69% of GDP .
• Arts and entertainment has 5.92% of GDP.
• Agriculture, Foresty and Fishing has 5.16% of GDP.
• And Non Agriculture has 6.90 of GDP.
Figure:3 GDP from different activities of annual year 2019-2020
In the year 2019/20 all the economic activities are declining as the covid pandemic hit the world
and so as the country as to suffers from it. The mostly affected activities is Accomodation and food
service activities by -36.28% followed by transportation and storage with -11.79% and most
unaffected activities is Electricity, gas, steam, and air conditioning supply by holding 19.1%.
• Agriculture Forestry and Fishing has 2.43% of GDP.
• Mining has negative which is -2.23%of GDP.
• Likewise, Manufacturing has also negative -9.03% of GDP.
• Electricity, gas, steam and air conditioning supply has 19.51% of GDP.
• Water supply has 2.15% of GDP.
• Construction has -4.39% of GDP.
• Wholesale and retail activities has-11.39% of GDP which is negative.
2.43
-2.23-9.03
19.51
2.15
-4.39
-11.39
-11.79
-36.78
2.02
-0.35
2.081.522.196.16 3.2 5.2 1.772.43
-4.42
-40
-30
-20
-10
0
10
20
30
PERCENTAGE
INDUSTRIAL CLASSIFICATION
GDP From Different Activities Of Annual Year
2019/20
11
• Transportation and storage has -11.79 % of GDP which is also negative.
• Accomodation and food service activities has -36.78% of GDP.
• Information and Communication has2.02% of GDP.
• Financial and insurance activities has -0.35% of GDP.
• Real estate activities has 2.08% of GDP.
• Professional, scientific and technical activities 1.52% of GDP.
• Administrative and support service activities has 2.19% of GDP.
• Public administration and defense has 2.19% of GDP.
• Education has of 6.16% of GDP.
• Human health and social work activities has 3.20 % of GDP
• n Arts and Entertainment has 5.20 % of GDP.
• Agriculture Forestry and Fishing has 1.77 % of GDP.
• Non agriculture has 2.43 % of GDP.
Figure:4 GDP from different activities of annual year 2020-2021
Despite of Corona pandemic in the previous year every economic activities seem to be declining.
In the year 2020/21 as pandemic situation seems to be normal all the economic activities seems
to be positive. Accomodation and service activities has the highest GDP with 10.73% followed by
mining with 7.5% of GDP and Electricity, gas, stream and air conditioning has lowest GDP with
1.49%.
• Agriculture Forestry and Fishing has 2.85% of GDP.
• Mining has 7.50 % of GDP.
2.85
7.5
4.14
2.57 1.49
5.19 5.74
4.43
10.73
1.77
4.05
2.25 2.37 2.3 3.38 3.92
6.6
3.38 2.85
4.26
0
2
4
6
8
10
12
PERCENTAGE
INDUSTRIAL CLASSIFICATION
GDP From Different Activities Of Annual
Year 2020/21
12
• Manufacturing has 4.14% of GDP.
• Electricity, gas, steam and air conditioning supply has 2.57% of GDP.
• Water supply has1.49% of GDP.
• Construction has 5.19% of GDP.
• Wholesale and retail activities has 5.74% of GDP.
• Transportation and storage has 4.43 % of GDP.
• Accomodation and food service activities has 10.73% of GDP.
• Information and Communication has 1.77% of GDP.
• Financial and insurance activities has 4.05% of GDP.
• Professional, scientific and technical activities has 2.37% of GDP.
• Administrative and support service activities has 2.30% of GDP.
• Public administration and defense has 3.38% of GDP.
• Education has 3.92% of GDP.
• Human health and social work activities has 6.60% of GDP
• Arts and Entertaiment has 3.38% of GDP.
• Agriculture Forestry and Fishing has 2.85% of GDP.
• Non agriculture has 4.26% of GDP.
Figure:5 GDP from different activities of annual 2021-2022.
2.3
8.15
6.14
36.67
0.72
9.51 9.12
4.54
11.42
3.58
6.06
3.82 3.78 4.4 4.05 4.08
6.91
3.79 2.3
6.88
2
0
5
10
15
20
25
30
35
40
PERCENTAGES
INDUSTRIAL CLASSIFICATION
GDP From Different Activities Of Annual Year
2021/22
13
The graph shows Nepal has rising GDP similar to the previous year. Nepal export electricity in the
year 2021/2022 to India. In the year 2021-2022 the electricity, gas stream and air conditioning
supply has highest GDP with 36.67% of GDP followed by Accomodation and food service activities
with 11.42% of GDP and water supply has lowest GDP with 0.72% of GDP.
• Agriculture Forestry and Fishing has 2.30% of GDP.
• Mining has 8.15% of GDP.
• Manufacturing has 6.14% of GDP.
• Electricity, gas, steam and air conditioning supply has 36.67% of GDP.
• Water Supply has 0.72% of GDP.
• Construction has 9.15% of GDP which is negative.
• Transportation and storage has 4.54 % of GDP which is also negative.
• Accomodation and food service activities has 11.42% of GDP.
• Information and Communication has 3.58% of GDP.
• Real estate activities has 3.82% of GDP.
• Professional, scientific and technical activities has 3.78% of GDP.
• Administrative and support service activities has 4.40 % of GDP.
• Public administration and defense has 4.05% of GDP.
• Human health and social work activities has 6.91% of GDP
• Arts and Entertainment has 3.79% of GDP.
• Agriculture Forestry and Fishing has 2.30 % of GDP.
• Non agriculture has 6.88 % of GDP.
14
Figure:6 GDP after taxes and subsidies from the year 2018-2022
The line graph above shows the GDP in the different years starting from 2018 to 2022. The GDP
are presented in percentage and four genre year are presented from 2018 to 2022. The annual year
2018/19 has the highest GDP holding 6.66% of GDP but in 2019/20 has declined GDP with -
2.37%. Although in the year 2019/20 the GDP is decreasing in the year 2020/21 the GDP rise to
the 4.25%. In the year 2021/22 it is also rise to the 5.84%. All genre year GDP is positive and
rising exception of 2019/20 which shows slightly decline. But recent year shows positive and rose
GDP which is positive sign to Nepal.
Conclusion
The study has analyzed the GDP of Nepal (2018-2022) coming from different economic activities.
Nepal economy isn’t the major economic as we compare to the rest of the world. Nepal ranks 153rd
among the richest in the world and if we see the economic activities it is difficult to find large
activities like electricity supply and scientific and technical activities. The study shows that water
supply has lowest GDP among all of economic activities so we should improve in water supply.
Similarly, government of Nepal should focus on spending more on public expenditure so that
Nepal will be one of the major economy in the world.
6.66
-2.37
4.25
5.84
-3
-2
-1
0
1
2
3
4
5
6
7
8
2018/19 2019/20 2020/21 2021/22
PERCENTAGES
YEAR
GDP from 2018-2022

More Related Content

Similar to term1.pdf

Gross Domestic Product
Gross Domestic ProductGross Domestic Product
Gross Domestic ProductErin Solaro
 
Income Gap In Canada
Income Gap In CanadaIncome Gap In Canada
Income Gap In CanadaTammy Majors
 
W1L1_Lecture 1-Concepts of Economic Growth and Development.pptx
W1L1_Lecture 1-Concepts of Economic Growth and Development.pptxW1L1_Lecture 1-Concepts of Economic Growth and Development.pptx
W1L1_Lecture 1-Concepts of Economic Growth and Development.pptxAMBIKABHANDARI5
 
The Study Of Macroeconomics
The Study Of MacroeconomicsThe Study Of Macroeconomics
The Study Of MacroeconomicsMichelle Singh
 
ECON3501CARIBBEAN ECONOMIC DEVELOPMENTUNIT 4 – ECO
ECON3501CARIBBEAN ECONOMIC DEVELOPMENTUNIT 4 – ECOECON3501CARIBBEAN ECONOMIC DEVELOPMENTUNIT 4 – ECO
ECON3501CARIBBEAN ECONOMIC DEVELOPMENTUNIT 4 – ECOEvonCanales257
 
Global Business Environment August 2015
Global Business Environment August 2015Global Business Environment August 2015
Global Business Environment August 2015Prodeep Mookerjee
 

Similar to term1.pdf (10)

Gross Domestic Product
Gross Domestic ProductGross Domestic Product
Gross Domestic Product
 
Pintoo gdp
Pintoo gdpPintoo gdp
Pintoo gdp
 
Economics chapter3
Economics chapter3Economics chapter3
Economics chapter3
 
Economics chapter3
Economics chapter3Economics chapter3
Economics chapter3
 
Economics Chapter 4
Economics Chapter 4Economics Chapter 4
Economics Chapter 4
 
Income Gap In Canada
Income Gap In CanadaIncome Gap In Canada
Income Gap In Canada
 
W1L1_Lecture 1-Concepts of Economic Growth and Development.pptx
W1L1_Lecture 1-Concepts of Economic Growth and Development.pptxW1L1_Lecture 1-Concepts of Economic Growth and Development.pptx
W1L1_Lecture 1-Concepts of Economic Growth and Development.pptx
 
The Study Of Macroeconomics
The Study Of MacroeconomicsThe Study Of Macroeconomics
The Study Of Macroeconomics
 
ECON3501CARIBBEAN ECONOMIC DEVELOPMENTUNIT 4 – ECO
ECON3501CARIBBEAN ECONOMIC DEVELOPMENTUNIT 4 – ECOECON3501CARIBBEAN ECONOMIC DEVELOPMENTUNIT 4 – ECO
ECON3501CARIBBEAN ECONOMIC DEVELOPMENTUNIT 4 – ECO
 
Global Business Environment August 2015
Global Business Environment August 2015Global Business Environment August 2015
Global Business Environment August 2015
 

Recently uploaded

Andheri Call Girls In 9825968104 Mumbai Hot Models
Andheri Call Girls In 9825968104 Mumbai Hot ModelsAndheri Call Girls In 9825968104 Mumbai Hot Models
Andheri Call Girls In 9825968104 Mumbai Hot Modelshematsharma006
 
Lundin Gold April 2024 Corporate Presentation v4.pdf
Lundin Gold April 2024 Corporate Presentation v4.pdfLundin Gold April 2024 Corporate Presentation v4.pdf
Lundin Gold April 2024 Corporate Presentation v4.pdfAdnet Communications
 
Financial institutions facilitate financing, economic transactions, issue fun...
Financial institutions facilitate financing, economic transactions, issue fun...Financial institutions facilitate financing, economic transactions, issue fun...
Financial institutions facilitate financing, economic transactions, issue fun...Avanish Goel
 
Log your LOA pain with Pension Lab's brilliant campaign
Log your LOA pain with Pension Lab's brilliant campaignLog your LOA pain with Pension Lab's brilliant campaign
Log your LOA pain with Pension Lab's brilliant campaignHenry Tapper
 
Bladex Earnings Call Presentation 1Q2024
Bladex Earnings Call Presentation 1Q2024Bladex Earnings Call Presentation 1Q2024
Bladex Earnings Call Presentation 1Q2024Bladex
 
The Triple Threat | Article on Global Resession | Harsh Kumar
The Triple Threat | Article on Global Resession | Harsh KumarThe Triple Threat | Article on Global Resession | Harsh Kumar
The Triple Threat | Article on Global Resession | Harsh KumarHarsh Kumar
 
SBP-Market-Operations and market managment
SBP-Market-Operations and market managmentSBP-Market-Operations and market managment
SBP-Market-Operations and market managmentfactical
 
Call Girls Service Nagpur Maya Call 7001035870 Meet With Nagpur Escorts
Call Girls Service Nagpur Maya Call 7001035870 Meet With Nagpur EscortsCall Girls Service Nagpur Maya Call 7001035870 Meet With Nagpur Escorts
Call Girls Service Nagpur Maya Call 7001035870 Meet With Nagpur Escortsranjana rawat
 
Classical Theory of Macroeconomics by Adam Smith
Classical Theory of Macroeconomics by Adam SmithClassical Theory of Macroeconomics by Adam Smith
Classical Theory of Macroeconomics by Adam SmithAdamYassin2
 
letter-from-the-chair-to-the-fca-relating-to-british-steel-pensions-scheme-15...
letter-from-the-chair-to-the-fca-relating-to-british-steel-pensions-scheme-15...letter-from-the-chair-to-the-fca-relating-to-british-steel-pensions-scheme-15...
letter-from-the-chair-to-the-fca-relating-to-british-steel-pensions-scheme-15...Henry Tapper
 
Bladex 1Q24 Earning Results Presentation
Bladex 1Q24 Earning Results PresentationBladex 1Q24 Earning Results Presentation
Bladex 1Q24 Earning Results PresentationBladex
 
call girls in Nand Nagri (DELHI) 🔝 >༒9953330565🔝 genuine Escort Service 🔝✔️✔️
call girls in  Nand Nagri (DELHI) 🔝 >༒9953330565🔝 genuine Escort Service 🔝✔️✔️call girls in  Nand Nagri (DELHI) 🔝 >༒9953330565🔝 genuine Escort Service 🔝✔️✔️
call girls in Nand Nagri (DELHI) 🔝 >༒9953330565🔝 genuine Escort Service 🔝✔️✔️9953056974 Low Rate Call Girls In Saket, Delhi NCR
 
Vip B Aizawl Call Girls #9907093804 Contact Number Escorts Service Aizawl
Vip B Aizawl Call Girls #9907093804 Contact Number Escorts Service AizawlVip B Aizawl Call Girls #9907093804 Contact Number Escorts Service Aizawl
Vip B Aizawl Call Girls #9907093804 Contact Number Escorts Service Aizawlmakika9823
 
government_intervention_in_business_ownership[1].pdf
government_intervention_in_business_ownership[1].pdfgovernment_intervention_in_business_ownership[1].pdf
government_intervention_in_business_ownership[1].pdfshaunmashale756
 
(办理学位证)加拿大萨省大学毕业证成绩单原版一比一
(办理学位证)加拿大萨省大学毕业证成绩单原版一比一(办理学位证)加拿大萨省大学毕业证成绩单原版一比一
(办理学位证)加拿大萨省大学毕业证成绩单原版一比一S SDS
 
BPPG response - Options for Defined Benefit schemes - 19Apr24.pdf
BPPG response - Options for Defined Benefit schemes - 19Apr24.pdfBPPG response - Options for Defined Benefit schemes - 19Apr24.pdf
BPPG response - Options for Defined Benefit schemes - 19Apr24.pdfHenry Tapper
 
VIP Kolkata Call Girl Serampore 👉 8250192130 Available With Room
VIP Kolkata Call Girl Serampore 👉 8250192130  Available With RoomVIP Kolkata Call Girl Serampore 👉 8250192130  Available With Room
VIP Kolkata Call Girl Serampore 👉 8250192130 Available With Roomdivyansh0kumar0
 
Mulki Call Girls 7001305949 WhatsApp Number 24x7 Best Services
Mulki Call Girls 7001305949 WhatsApp Number 24x7 Best ServicesMulki Call Girls 7001305949 WhatsApp Number 24x7 Best Services
Mulki Call Girls 7001305949 WhatsApp Number 24x7 Best Servicesnajka9823
 
House of Commons ; CDC schemes overview document
House of Commons ; CDC schemes overview documentHouse of Commons ; CDC schemes overview document
House of Commons ; CDC schemes overview documentHenry Tapper
 
Attachment Of Assets......................
Attachment Of Assets......................Attachment Of Assets......................
Attachment Of Assets......................AmanBajaj36
 

Recently uploaded (20)

Andheri Call Girls In 9825968104 Mumbai Hot Models
Andheri Call Girls In 9825968104 Mumbai Hot ModelsAndheri Call Girls In 9825968104 Mumbai Hot Models
Andheri Call Girls In 9825968104 Mumbai Hot Models
 
Lundin Gold April 2024 Corporate Presentation v4.pdf
Lundin Gold April 2024 Corporate Presentation v4.pdfLundin Gold April 2024 Corporate Presentation v4.pdf
Lundin Gold April 2024 Corporate Presentation v4.pdf
 
Financial institutions facilitate financing, economic transactions, issue fun...
Financial institutions facilitate financing, economic transactions, issue fun...Financial institutions facilitate financing, economic transactions, issue fun...
Financial institutions facilitate financing, economic transactions, issue fun...
 
Log your LOA pain with Pension Lab's brilliant campaign
Log your LOA pain with Pension Lab's brilliant campaignLog your LOA pain with Pension Lab's brilliant campaign
Log your LOA pain with Pension Lab's brilliant campaign
 
Bladex Earnings Call Presentation 1Q2024
Bladex Earnings Call Presentation 1Q2024Bladex Earnings Call Presentation 1Q2024
Bladex Earnings Call Presentation 1Q2024
 
The Triple Threat | Article on Global Resession | Harsh Kumar
The Triple Threat | Article on Global Resession | Harsh KumarThe Triple Threat | Article on Global Resession | Harsh Kumar
The Triple Threat | Article on Global Resession | Harsh Kumar
 
SBP-Market-Operations and market managment
SBP-Market-Operations and market managmentSBP-Market-Operations and market managment
SBP-Market-Operations and market managment
 
Call Girls Service Nagpur Maya Call 7001035870 Meet With Nagpur Escorts
Call Girls Service Nagpur Maya Call 7001035870 Meet With Nagpur EscortsCall Girls Service Nagpur Maya Call 7001035870 Meet With Nagpur Escorts
Call Girls Service Nagpur Maya Call 7001035870 Meet With Nagpur Escorts
 
Classical Theory of Macroeconomics by Adam Smith
Classical Theory of Macroeconomics by Adam SmithClassical Theory of Macroeconomics by Adam Smith
Classical Theory of Macroeconomics by Adam Smith
 
letter-from-the-chair-to-the-fca-relating-to-british-steel-pensions-scheme-15...
letter-from-the-chair-to-the-fca-relating-to-british-steel-pensions-scheme-15...letter-from-the-chair-to-the-fca-relating-to-british-steel-pensions-scheme-15...
letter-from-the-chair-to-the-fca-relating-to-british-steel-pensions-scheme-15...
 
Bladex 1Q24 Earning Results Presentation
Bladex 1Q24 Earning Results PresentationBladex 1Q24 Earning Results Presentation
Bladex 1Q24 Earning Results Presentation
 
call girls in Nand Nagri (DELHI) 🔝 >༒9953330565🔝 genuine Escort Service 🔝✔️✔️
call girls in  Nand Nagri (DELHI) 🔝 >༒9953330565🔝 genuine Escort Service 🔝✔️✔️call girls in  Nand Nagri (DELHI) 🔝 >༒9953330565🔝 genuine Escort Service 🔝✔️✔️
call girls in Nand Nagri (DELHI) 🔝 >༒9953330565🔝 genuine Escort Service 🔝✔️✔️
 
Vip B Aizawl Call Girls #9907093804 Contact Number Escorts Service Aizawl
Vip B Aizawl Call Girls #9907093804 Contact Number Escorts Service AizawlVip B Aizawl Call Girls #9907093804 Contact Number Escorts Service Aizawl
Vip B Aizawl Call Girls #9907093804 Contact Number Escorts Service Aizawl
 
government_intervention_in_business_ownership[1].pdf
government_intervention_in_business_ownership[1].pdfgovernment_intervention_in_business_ownership[1].pdf
government_intervention_in_business_ownership[1].pdf
 
(办理学位证)加拿大萨省大学毕业证成绩单原版一比一
(办理学位证)加拿大萨省大学毕业证成绩单原版一比一(办理学位证)加拿大萨省大学毕业证成绩单原版一比一
(办理学位证)加拿大萨省大学毕业证成绩单原版一比一
 
BPPG response - Options for Defined Benefit schemes - 19Apr24.pdf
BPPG response - Options for Defined Benefit schemes - 19Apr24.pdfBPPG response - Options for Defined Benefit schemes - 19Apr24.pdf
BPPG response - Options for Defined Benefit schemes - 19Apr24.pdf
 
VIP Kolkata Call Girl Serampore 👉 8250192130 Available With Room
VIP Kolkata Call Girl Serampore 👉 8250192130  Available With RoomVIP Kolkata Call Girl Serampore 👉 8250192130  Available With Room
VIP Kolkata Call Girl Serampore 👉 8250192130 Available With Room
 
Mulki Call Girls 7001305949 WhatsApp Number 24x7 Best Services
Mulki Call Girls 7001305949 WhatsApp Number 24x7 Best ServicesMulki Call Girls 7001305949 WhatsApp Number 24x7 Best Services
Mulki Call Girls 7001305949 WhatsApp Number 24x7 Best Services
 
House of Commons ; CDC schemes overview document
House of Commons ; CDC schemes overview documentHouse of Commons ; CDC schemes overview document
House of Commons ; CDC schemes overview document
 
Attachment Of Assets......................
Attachment Of Assets......................Attachment Of Assets......................
Attachment Of Assets......................
 

term1.pdf

  • 1. 1 Abstract This paper aim to examine the GDP of Nepal. GDP is related to the economic growth of country. Economic Growth is a quantity terms as it represents quantitative increase in production of goods and services. GDP is the market value of all final goods and services produced in a domestic territory. Both GDP and GNP contribute to economic growth of country but in this paper we only study GDP of Nepal. In this paper we study of GDP from different activities from Annual Year 2018 to 2022.Although Nepal is improving in GDP. In the year 2022 Nepal GDP is $40.15 billion. But If we compare Nepal’s GDP to the China and India and Australia it shows Nepal is a far way in the name of Economic growth. In the year 2022 China GDP is $17.73 trillion. In the year 2022 India GDP is $ 3.5 trillion and if we look to the Australia GDP in the year 2022 $1.7 trillion. Although Nepal territory is not as large as China and India but in terms of growth and development Nepal is still backward to the rest of world. In Nepal economic activities are very less. Approximately 66% of the total population relied on the agricultural sector for their livelihood. Similarly Remittance is second priority of people in Nepal. Nepal is a unique country with big markets in the neighbors India and China but remains as one of the poor landlocked developing countries, even being the earlier entrant in liberalization and reform. Nepal recently went through a substantial political transition and now the stable government is seeking substantial amount of foreign direct investment. In this background, it will be better, for a good policy analysis, to know how the financial activities have played the role in highly intended economic growth. Paudel, R., & Acharya, C. P. (2020). Public spending accelerates both physical and human capital over time. In the short term, appropriate public spending on health, manufacturing, transportation, human capital, and communication all could boost up economic growth (Balaj & Lani2017). Nepal also is a developing country so it must focused on public spending.
  • 2. 2 Introduction When did economic growth begin? A traditional view holds that economic growth began with the Industrial Revolution around 1800. Recent work has challenged this view pushing the date of the onset of growth back. Crafts (1983, 1985) and Harley (1982) revised downward previous estimates of growth in Britain during the Industrial Revolution. These new estimates indicate that British output per capita was larger by the mid-18th century than was previously thought implying that substantial growth must have occurred at an earlier date (see also Crafts and Harley, 1992). Acemoglu, Johnson, and Robinson (2005) argue that a First Great Divergence occurred starting around 1500 with Western Europe growing apart from other areas of the world following the discovery of the Americas and the sea route to India. They support this view with data on urbanization rates. Broad berry et al. (2015) argue that growth began even earlier than this. They present new estimates of GDP per person for Britain back to 1270. These data show slow but steady growth in GDP per person from the beginning of their sample. Finally, Kremer (1993) uses world population estimates to argue for positive but glacially slow growth for hundreds of thousands of years Economic growth is the process whereby the real per capita income of the country increases over a long period of time. Economic growth enables the economy to produce more goods and services and thereby raises the standard of living of the people at the country. Economic growth is an increase in the production of economic goods and services in one period of time compared with a previous period.. Economic growth is the name of more production which is measured in terms of an increase in real gross national product over a time or an increase in per capita income. Economic growth is the increase in the production of goods and services in an economy. Increase in capital goods labor force technology and human capital can all contribute to economic growth. Economic growth refers to an increase in the real output of goods and services in the country. It brings quantitative changes in the economy. Economic growth is a more relevantmetric for progress in developed countries but it is widely used in all countries because growth is a necessary condition for development. Growth is concerned with increase in the economy’s output. Economic growth is measured in terms Gross National Product(GDP) and Gross Domestic product(GDP). Simon Kuznets. An expert in statistics, mathematics and economics, he developed a standard way of measuring the gross national product or GNP of the US. It would give an idea of just how much goods and services were produced by American-owned companies, whether at home or abroad. A few years later, Kuznets also developed GDP. GDP was the sum of the value of all goods and services produced in a country each year (and, unlike GNP, excluded the value of US-owned facilities abroad). It could be measured either by adding the value of all finished goods and services, and subtracting the cost of intermediary products, or you could find it by adding up all salaries, profits and investment incomes. The most common way to calculate it was the so-called “expenditure approach”. It calculates total GDP as: Gross Domestic Product = Consumption + Government Expenditure + Private Investment + Exports – Imports
  • 3. 3 (From an economic perspective, all those sums should add up to the same: aggregate production = aggregate income = aggregate expenditure.) Kuznets’ invention was a stroke of genius. It summarized in one number the economic strength of the entire nation and gave policymakers hints on to how to improve it. During the remainder of the 1930s, other economists helped standardize and popularize it, and by the time the Bretton Woods conference was held in 1944, GDP was confirmed as the main tool for measuring economies around the world. Since then, GDP has become something of a talisman. When GDP is growing, it gives people and companies hope, and when it declines, governments pull out all the policy stops to reverse the trend. Although there were crises and setbacks, the story of the overall global economy was one of growth, so the notion that GDP growth is good, reigned supreme. In the 30 or so years after the Second World War, reporting GDP was a recurring triumph, especially in the West. It was the “Golden Era of Capitalism” in America, the “Wirtschaftswunder” in Germany, and the “Trente Glorieuses” in France. Nominal GDP growth could reach 10% or more, and in real, inflation-adjusted terms still often topped 5%. But there is a painful end to this story, and we could have foreseen it had we better listened to Kuznets himself. In 1934, long before the Bretton Woods Agreement – and before even the scepter of war – Kuznets warned US Congress not to focus too narrowly on GNP or GDP: “The welfare of a nation can scarcely be inferred from a measure of national income,” he said. This assessment proved prescient. GDP tells us about aggregate consumption, but it does not tell us about personal well-being. It tells us about production, but not about the pollution that comes with it, or the depletion of natural resources it requires. It tells us about government expenditure and private investments, but not about the quality of life they generate. Oxford economist Diane Coyle told us in a recent interview that, in reality, GDP was “a war-time metric.” It tells you what your economy can produce when you’re at war – as was the case in the early 1940s – but it does not tell you how you can make people happy when you’re at peace. It tells you how valuable trees are when you cut them down and turn them into fences or benches, but not what they’re worth when left standing. Despite early warnings from its inventor, GDP conquered the world. Everything was done to prop up its growth. Roads and highways were built, personal consumption encouraged, industry and transportation were subsidized, and so on. But, starting in the 1970s, the GDP growth story did start to cool down, first in the West, then globally. But, as global annual GDP peaked, our ecological footprint did so too, leading to an ecological deficit. Forests were cut to make way for agriculture and industry, oceans were depleted of their fish stocks, and fossil fuels were burned and polluted the air, leading to climate change. In the short-term that lead to growth, in the long-term it damaged our health, wealth and well-being.
  • 4. 4 To reinvigorate GDP growth in the 1980s, governments liberalized industries and opened to trade, in the hopes it would spur competition, and unleash a new wave of economic growth. That did happen at first, but by the 2000s, its side effects became clear: rising market concentration and a declining labour share of income. Median incomes stagnated, and public services worsened. The result is that the magic formula of GDP growth now seems exhausted. In the West, GDP does not grow like it used to, and well-being stopped increasing a long time ago. A feeling of permanent crisis has taken hold of societies, and perhaps with good reason. As Kuznets knew, we never should have made GDP growth the singular focus of policymaking. Alas, that is where we are today. GDP is the market value of all final goods and services produced within the domestic territory of a country during a particular time period. GDP measures the monetary value of final goods and services that is those that are bought by the final user produced in a country in a given period of time. It counts all of the output generated within the boarders of a country. GDP is composed of goods and services produced for sale in the market and also includes some non -market production such as defense or education services provides by the government. If depreciation subtracted from GDP we get net domestic product. GDP can be measured in terms of Real GDP or Nominal GDP. To determine real GDP its nominal value must be adjusted to take in account its nominal value must be adjusted to take in account price changes to allow us to see whether the vaue of output has gone up because more is being produced or simply because prices have increased. A statistical tool called the price deflator is used to adjust GDP from nominal to constant prices. GDP is important because it gives information about the size of the economy and how an economy is performing. The growth rate of real GDP is often used as an indicator of the general health of the economy. In broad terms an increase in real GDP is interpreted as a sign that the economy is doing well. When real GDP is growing strongly employment is likely to be increasing as companies hire more workers for their factories and people have more money in their pockets. When GDP is shrinking as it did in many countries during the recent global economic crisis employment often declines. An increase in exports increases GDP because they bring in more revenue from foreign nations through the goods that are exported. Imports, on the other hand, do not affect GDP since they are not produced domestically. Net exports, like exports, also increase GDP so long as they are positive. If they are negative they will decrease GDP.
  • 5. 5 GDP of different province of Nepal Nepal has seven province. Province one has 14 districts. Province 2 which is called Madesh province has 8 districts. Province 3 which is also called Bagmati province has 13 districts. Province 4 which is Gandaki province has 11 districts. Lumbini province is province 5 which has 12 districts. Karnali province is province 6 and it has 10 districts and sudurpachim province has 9 districts which is province number 5. Agriculture is the primary economic activity in Province No. 1, with the majority of the population engaged in farming. It has significant tourism potential due to its natural beauty and cultural heritage. It has a growing industrial sector, with several large and small-scale industries operating in the province. It has a strategic location, bordering India in the south and Tibet Autonomous Region of China in the north. It has been investing in developing its infrastructure, including roads, airports, and hydropower projects. Agriculture and forest is the mainstay of Madesh province economy, providing a livelihood for three-fourths of the population. Industrial activity mainly involves the processing of agricultural produce including jute, sugarcane, tobacco, and grain Bagmati is leading in GDP among all others province. Bagmati’s growth is helped by key economic activities like administrative and support services, finance and insurance, real estate and professional, and scientific and technical. Agriculture and tourism is the mainstay of Gandaki province. Agriculture, forest and tourism are the mainstay of Lumbini province economy. Agriculture and forest is the mainstay of province economy, providing a livelihood for three-fourths of the population. Industrial activity in the Karnali province accounts very low. Agriculture and forest is the mainstay of province economy, providing a livelihood for three-fourths of the population. Industrial activity in the province accounts very low. Figure:1 GDP of different province in the year 2022. 15.7 13.3 36.9 8.9 14.1 4.1 7 GDP Of Different Province Province 1 Madesh Bagmati Gandaki Lumbini Karnali Sudurpachim
  • 6. 6 The pie chart illustrates how different is GDP in different Province percentage wise in the year 2021/22. Pie chart compare GDP produce by seven province. Overall Bagmati province has highest GDP as it has mostly urban areas and the economic activities are occurring in more range while Karnali province has lowest GDP as it has mostly rural areas and economic activities are occurring in less range. Looking at the information in more detail we can see that Province 1 has 15.7% of GDP which is second highest GDP after Bagmati province. Similarly Madesh province has 13.3 % of GDP. Bagmati province has highest GDP by producing 36.9% of GDP. However Gandaki province has 8.9% of GDP. Lumbini province has 14.1 % of GDP. By contrast Karnali province has lowest GDP by producing precisely 4.1% of GDP and Sudurpachim province produce 7% of GDP which is second lowest GDP.
  • 7. 7 Objective of study The core objectives of the study is to analysis current GDP situation of Nepal. Besides that the objectives of study are: • To know the different economic activities of Nepal • To be familiar with Government Policies. • To know the status of economic growth. • To gain the knowledge of GDP and economic growth. • To know the GDP of Nepal from the basis year 2018-2022. • To know GDP of Nepal and its components. Limitation of study • The major limitation of the project can be discussed below: • The paper is based on secondary data. • The study only focus on GDP and Economic growth. • The study is limited on websites, books and magazine. • This study don’t analyze every details of economic activities. • This study only analyze data from the year 2018-2022 and it don’t include the data before 2018.
  • 8. 8 GDP of Nepal: For the past two years, the economy affected by the Covid-19 pandemic has moved in the direction of normalization. Overall economic activities, including industrial production and trade business, are gradually returning to normal. In addition to domestic demand, there has been a higher increase in both exports and imports. However, the economy is heading towards bigger challenges following the endorsement of Replacement Bill in late September, damage in paddy production due unseasonal rains in November, rising prices of petroleum products, liquidity crunch in the financial sector and declining foreign exchange reserves. The expansion of industry and service sector is expected to be satisfactory despite the adverse conditions witnessed in the external sector. Nepalese economy is expected to expand by 5.84 percent in FY 2021/22 following the gradual normalization of socio-economic activities due to gradual diminishing of Covid19 impact and encouraging expansion of energy sector. In addition, Nepal's economic growth at basic prices is estimated to be 5.49 percent. In FY 2019/20, the economic growth was negative by 2.37 percentage as compared to 4.25 percentage in the previous fiscal year. In FY 2021/22, total value added of agriculture and non-agriculture sector is estimated to increase by 2.30 percent and 6.88 percent respectively. In the last fiscal year, the total value added of agriculture sector increased by 2.85 percent while the total value added of non-agricultural sector increased by 4.25 percent. Despite the decline in paddy production by 8.7 percent in FY 2021/22, the total value addition of the agriculture sector is expected to grow due to the increase in the total value addition of fisheries sector. In the nonagricultural sector, the growth rate of total value addition in most sectors including electricity and gas, housing and food, construction, industry, mining and health sector is estimated to be higher than the last fiscal year. The growth rates of primary sector, secondary sector and service sector are estimated to be 2.4 percent, 10.3 percent and 5.9 percent respectively in 2021/22. Such growth rates were 3.0 percent, 4.4 percent and 4.2 percent respectively in FY 2020/21. Average growth rates for the primary, secondary and service sectors over the last decade were 2.8 percent, 5.3 percent and 4.7 percent respectively. The average growth rate in the six years after the earthquake is higher than in the last ten years. The GDP of Nepal has improve in 2022 however it was declining in the year 2019. There are various sector which contribute the GDP of Nepal.
  • 9. 9 Figure:2 GDP from different activities of annual year 2018-19 In the year 2018/2019 the GDP is almost increasing there isn’t any economic activities which is declining. In the year 2018/2019 Mining has highest of GDP followed by Accomodation and food service activities with 9.91% f GDP whereas water supply has the lowest of GDP. • Agriculture Forestry and Fishing has 5.26% of GDP. • Mining has 17.62 % of GDP. • Manufacturing has 6.52% of GDP. • Electricity, gas, stream and air conditioning supply 9.61 % of GDP. • Water Supply has 1.22% of GDP. • Construction has 7.48% of GDP. • Wholesale and retail trade has 8.11% of GDP. • Transportation and storage has 8.77% of GDP. • Accomodation and food service activities has 9.92% of GDP. • Information and Communication has 7.05% of GDP. • Financial and Insurance has 6.35% of GDP. • Real estate activities has 3.75 of GDP. 5.16 17.62 6.52 9.61 1.22 7.488.118.779.92 7.056.353.755.616.445.125.986.695.925.16 6.9 0 2 4 6 8 10 12 14 16 18 20 PERCENTAGE INDUSTRIAL CLASSIFICATION GDP From Different Activities Of Annual Year2018/19
  • 10. 10 • Professional, scientific and technical activities has 5.61% of GDP. • Administrative and Support service activities has 6.44%of GDP . • Public Administration and defense has 5.12% of GDP. • Education has 5.98% of GDP. • Human health and social work activities has 6.69% of GDP . • Arts and entertainment has 5.92% of GDP. • Agriculture, Foresty and Fishing has 5.16% of GDP. • And Non Agriculture has 6.90 of GDP. Figure:3 GDP from different activities of annual year 2019-2020 In the year 2019/20 all the economic activities are declining as the covid pandemic hit the world and so as the country as to suffers from it. The mostly affected activities is Accomodation and food service activities by -36.28% followed by transportation and storage with -11.79% and most unaffected activities is Electricity, gas, steam, and air conditioning supply by holding 19.1%. • Agriculture Forestry and Fishing has 2.43% of GDP. • Mining has negative which is -2.23%of GDP. • Likewise, Manufacturing has also negative -9.03% of GDP. • Electricity, gas, steam and air conditioning supply has 19.51% of GDP. • Water supply has 2.15% of GDP. • Construction has -4.39% of GDP. • Wholesale and retail activities has-11.39% of GDP which is negative. 2.43 -2.23-9.03 19.51 2.15 -4.39 -11.39 -11.79 -36.78 2.02 -0.35 2.081.522.196.16 3.2 5.2 1.772.43 -4.42 -40 -30 -20 -10 0 10 20 30 PERCENTAGE INDUSTRIAL CLASSIFICATION GDP From Different Activities Of Annual Year 2019/20
  • 11. 11 • Transportation and storage has -11.79 % of GDP which is also negative. • Accomodation and food service activities has -36.78% of GDP. • Information and Communication has2.02% of GDP. • Financial and insurance activities has -0.35% of GDP. • Real estate activities has 2.08% of GDP. • Professional, scientific and technical activities 1.52% of GDP. • Administrative and support service activities has 2.19% of GDP. • Public administration and defense has 2.19% of GDP. • Education has of 6.16% of GDP. • Human health and social work activities has 3.20 % of GDP • n Arts and Entertainment has 5.20 % of GDP. • Agriculture Forestry and Fishing has 1.77 % of GDP. • Non agriculture has 2.43 % of GDP. Figure:4 GDP from different activities of annual year 2020-2021 Despite of Corona pandemic in the previous year every economic activities seem to be declining. In the year 2020/21 as pandemic situation seems to be normal all the economic activities seems to be positive. Accomodation and service activities has the highest GDP with 10.73% followed by mining with 7.5% of GDP and Electricity, gas, stream and air conditioning has lowest GDP with 1.49%. • Agriculture Forestry and Fishing has 2.85% of GDP. • Mining has 7.50 % of GDP. 2.85 7.5 4.14 2.57 1.49 5.19 5.74 4.43 10.73 1.77 4.05 2.25 2.37 2.3 3.38 3.92 6.6 3.38 2.85 4.26 0 2 4 6 8 10 12 PERCENTAGE INDUSTRIAL CLASSIFICATION GDP From Different Activities Of Annual Year 2020/21
  • 12. 12 • Manufacturing has 4.14% of GDP. • Electricity, gas, steam and air conditioning supply has 2.57% of GDP. • Water supply has1.49% of GDP. • Construction has 5.19% of GDP. • Wholesale and retail activities has 5.74% of GDP. • Transportation and storage has 4.43 % of GDP. • Accomodation and food service activities has 10.73% of GDP. • Information and Communication has 1.77% of GDP. • Financial and insurance activities has 4.05% of GDP. • Professional, scientific and technical activities has 2.37% of GDP. • Administrative and support service activities has 2.30% of GDP. • Public administration and defense has 3.38% of GDP. • Education has 3.92% of GDP. • Human health and social work activities has 6.60% of GDP • Arts and Entertaiment has 3.38% of GDP. • Agriculture Forestry and Fishing has 2.85% of GDP. • Non agriculture has 4.26% of GDP. Figure:5 GDP from different activities of annual 2021-2022. 2.3 8.15 6.14 36.67 0.72 9.51 9.12 4.54 11.42 3.58 6.06 3.82 3.78 4.4 4.05 4.08 6.91 3.79 2.3 6.88 2 0 5 10 15 20 25 30 35 40 PERCENTAGES INDUSTRIAL CLASSIFICATION GDP From Different Activities Of Annual Year 2021/22
  • 13. 13 The graph shows Nepal has rising GDP similar to the previous year. Nepal export electricity in the year 2021/2022 to India. In the year 2021-2022 the electricity, gas stream and air conditioning supply has highest GDP with 36.67% of GDP followed by Accomodation and food service activities with 11.42% of GDP and water supply has lowest GDP with 0.72% of GDP. • Agriculture Forestry and Fishing has 2.30% of GDP. • Mining has 8.15% of GDP. • Manufacturing has 6.14% of GDP. • Electricity, gas, steam and air conditioning supply has 36.67% of GDP. • Water Supply has 0.72% of GDP. • Construction has 9.15% of GDP which is negative. • Transportation and storage has 4.54 % of GDP which is also negative. • Accomodation and food service activities has 11.42% of GDP. • Information and Communication has 3.58% of GDP. • Real estate activities has 3.82% of GDP. • Professional, scientific and technical activities has 3.78% of GDP. • Administrative and support service activities has 4.40 % of GDP. • Public administration and defense has 4.05% of GDP. • Human health and social work activities has 6.91% of GDP • Arts and Entertainment has 3.79% of GDP. • Agriculture Forestry and Fishing has 2.30 % of GDP. • Non agriculture has 6.88 % of GDP.
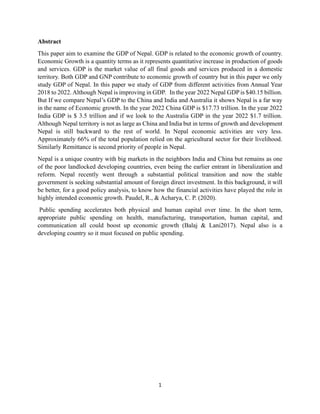
  • 14. 14 Figure:6 GDP after taxes and subsidies from the year 2018-2022 The line graph above shows the GDP in the different years starting from 2018 to 2022. The GDP are presented in percentage and four genre year are presented from 2018 to 2022. The annual year 2018/19 has the highest GDP holding 6.66% of GDP but in 2019/20 has declined GDP with - 2.37%. Although in the year 2019/20 the GDP is decreasing in the year 2020/21 the GDP rise to the 4.25%. In the year 2021/22 it is also rise to the 5.84%. All genre year GDP is positive and rising exception of 2019/20 which shows slightly decline. But recent year shows positive and rose GDP which is positive sign to Nepal. Conclusion The study has analyzed the GDP of Nepal (2018-2022) coming from different economic activities. Nepal economy isn’t the major economic as we compare to the rest of the world. Nepal ranks 153rd among the richest in the world and if we see the economic activities it is difficult to find large activities like electricity supply and scientific and technical activities. The study shows that water supply has lowest GDP among all of economic activities so we should improve in water supply. Similarly, government of Nepal should focus on spending more on public expenditure so that Nepal will be one of the major economy in the world. 6.66 -2.37 4.25 5.84 -3 -2 -1 0 1 2 3 4 5 6 7 8 2018/19 2019/20 2020/21 2021/22 PERCENTAGES YEAR GDP from 2018-2022