
Recommended
Recommended
More Related Content
Similar to Our Hand Hygiene Improvement Process Has Cut HAIs by 75% in 6 Months
Similar to Our Hand Hygiene Improvement Process Has Cut HAIs by 75% in 6 Months (20)
Recently uploaded
Recently uploaded (20)
Our Hand Hygiene Improvement Process Has Cut HAIs by 75% in 6 Months
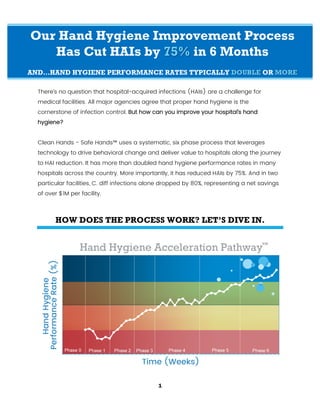
- 1. 1 Our Hand Hygiene Improvement Process Has Cut HAIs by 75% in 6 Months AND…HAND HYGIENE PERFORMANCE RATES TYPICALLY DOUBLE OR MORE There’s no question that hospital-acquired infections (HAIs) are a challenge for medical facilities. All major agencies agree that proper hand hygiene is the cornerstone of infection control. But how can you improve your hospital’s hand hygiene? Clean Hands - Safe Hands™ uses a systematic, six phase process that leverages technology to drive behavioral change and deliver value to hospitals along the journey to HAI reduction. It has more than doubled hand hygiene performance rates in many hospitals across the country. More importantly, it has reduced HAIs by 75%. And in two particular facilities, C. diff infections alone dropped by 80%, representing a net savings of over $1M per facility. HOW DOES THE PROCESS WORK? LET’S DIVE IN.
- 2. 2 PHASE 1: SETTING THE FOUNDATION Key Theme: Direct observation doesn’t work. It was, at one point, considered the gold standard in hand hygiene monitoring, but multiple studies have shown that direct observation can overstate compliance rates by up to 300%.1 Electronic monitoring systems come much closer to capturing every hand hygiene opportunity. What Happens During This Phase: Our technology is installed and quietly gathers data in the background to accurately set a baseline of your facility’s true hand hygiene performance. The data collected during this time period also provides a detailed look into the staff’s current workflows and timings, which we use to tailor technology to each unit’s specific processes and patient needs. This chart shows what hand hygiene performance rates typically look like during Phase 1: 1 http://www.ehcohealth.org/category/the-evidence/
- 3. 3 PHASE 2: LISTEN & RESPOND Key Theme: Real-time feedback is critical in changing clinician behavior. “Gotcha” systems that only serve to catch unwanted behavior are negative and punitive. What’s far more helpful – and more acceptable to clinicians – are systems that offer a gentle reminder to clean their hands at appropriate times. Clinicians find that a human voice is most effective in getting their attention, while beeps or lights annoy staff and lead to alarm fatigue. What Happens During This Phase: Our Natural Language Voice Reminder™ is turned on. If a clinician fails to clean their hands when entering or exiting a patient room, a gentle voice tells them to “Please sanitize” (exact wording can be customized by the facility). The voice only sounds when a provider forgets to perform hand hygiene in accordance with the hospital’s policies. If a clinician questions why they’re hearing a voice during a particular instance, this is an important opportunity to educate them on hospital policies. This chart shows what hand hygiene performance rates typically look like during Phase 2:
- 4. 4 PHASE 3: TEAM ENGAGEMENT Key Theme: Most hospitals want to build a culture of proactive HAI prevention…a positive culture of continuous improvement. Hand hygiene can be fun! And gamification combined with positive reinforcement is an effective tool to impact behavior change. Through contests, games and prizes, improving hand hygiene can be done with the proverbial “carrot” rather than the “stick.” What Happens During This Phase: As buy-in grows, we work with unit leadership to select hand hygiene champions who will help build engagement and promote the program internally. Competitions and incentives that positively reward teams (shifts, units, or roles) are effective in building engagement with the system and driving hand hygiene performance even higher. This chart shows what hand hygiene performance rates typically look like during Phase 3:
- 5. 5 PHASE 4: CHALLENGE YOURSELF Key Theme: While it’s fun to compete against each other, it’s even more important to take a “personal best” approach and compete against oneself. Since the Clean Hands – Safe Hands™ system identifies individual hand hygiene performance, it’s easy for every clinician to improve every day. Think of our technology as a fitness tracker for hand hygiene. What Happens During This Phase: Competitions and recognition shift from group- based to individual-focused. During this phase, we talk with the top performers to uncover their “secrets to success” and use their feedback to help other staff members in the next phase. This not only allows us to work with specific individuals to improve habits that are affecting group performance, but we also work with you to instill best practices in your daily operations across all staff members and units. This chart shows what hand hygiene performance rates typically look like during Phase 4:
- 6. 6 PHASE 5: WORKFLOW PROCESS ENHANCEMENT Key Theme: While hand hygiene is a simple concept, the clinical realities are very complex. Sometimes hand hygiene problems are caused by clinicians that need further education, but there can be many other causes too. Maybe they’ve got too many patients and are rushing between rooms and forgetting to clean their hands every time. Or maybe the way the room is set up – or where supplies are kept outside the room – is hindering their ability to perform proper hand hygiene. What Happens During This Phase: We leverage the effort we have put into improving the performance of most of the clinicians and identify a small, manageable subset of people who need a little extra help. The data our system collects identifies workflow challenges and educational gaps to performance improvement and provides insights into how to overcome these challenges. We work with you on workflow analytics to find ways for your clinicians to be more efficient. This chart shows what hand hygiene performance rates typically look like during Phase 5:
- 7. 7 PHASE 6: HIGH RISK PATIENT INTERVENTION Key Theme: Not all hand hygiene opportunities are created equally. It’s effective to have a voice reminding clinicians to “Please sanitize” in most hospital rooms. But for patients with C. diff, most hospitals expect clinicians to wash their hands with soap when leaving the room. Our Adaptive Room Modes™ allow you to change the voice in C. diff rooms to “Soap and water only” and no longer give credit for using sanitizer. What Happens During This Phase: We’re able to analyze hand hygiene performance rates for rooms with specific organisms (C. diff, MRSA, MDROs, etc.). We pinpoint problem areas here, and use tools from earlier phases to target improvement for specific organisms or patient situations that may need extra attention. This chart shows what hand hygiene performance rates typically look like during Phase 6:
- 8. 8 Finally, a hand hygiene solution that people like. Friendly reminders. Non-disruptive technology. Fitness-tracker-style performance goals. And a process that nurtures a culture of proactive HAI prevention based on individual and team hand hygiene performance. Preventing the spread of hospital-acquired infections is serious business, but there’s no rule against making it fun. At the same time, you lower costs. Reduce risks. Improve the safety of your patients. Save lives. Contact us for more information or a demo today. (404) 975-1686 or info@cleanhands-safehands.com © 2018 Clean Hands – Safe Hands LLC Clean Hands – Safe Hands began through a research consortium of the Centers for Disease Control and Prevention (CDC), Emory University, Children’s Healthcare of Atlanta, the Georgia Institute of Technology and the Georgia Tech Research Institute. Knowing that the primary accepted method of direct observation is ineffectual in reducing HAIs, physicians and technologists worked together to develop an innovative solution to the problem. A Physician/ Technology Partnership Improving Everyone’s Performance™ www.cleanhands-safehands.com