SlideShare a Scribd company logo
1 of 8
Download to read offline
Original                   Research Communications-general

Lean body mass estimation by bioelectrical impedance
analysis: a four-site cross-Validation study13
Karen      R Segal,         EdD;         Marta            Van Loan,          PhD;        Patricia      I Fitzgerald,          PhD;

James      A Hodgdon,                PhD;         and       Theodore         B Van Itaiie,            MD
                              ABSTRACT             This             study validated    further  the bioelectrical       impedance         analysis               (BIA)       method
                              for body composition                  estimation.     At four laboratories      densitometrically-determined                               lean body
                              mass      (LBMd)  was compared           with BIA in 1567 adults (1069 men, 498 women)                    aged 17-62 y
                              and     with            body fat. Equations
                                                  3-56%                           for predicting   LBMd from resistance          measured     by BIA,
                              height2, weight, and age were obtained                for the men and women.         Application     of each equation
                              to the data from the other labs yielded             small reductions   in R values and small increases         in SEES.
                              Some regression         coefficients     differed among labs but these differences             were eliminated     after
                              adjustment     for differences        among labs in the subjects’        body   fatness. All data were pooled to
                                                                                             LBMd: the resulting R values ranged from 0.907


                                                                                                                                                                                                                        Downloaded from www.ajcn.org by on January 11, 2008
                              derive fatness-specific        equations     for predicting
                              to 0.952 with             SEES of 1.97-3.03  kg. These results                    confirm       the validity      of BIA     and       indicate      that
                              the precision             of predicting  LBM from impedance                        can    be enhanced          by sex-   and     fatness-specific
                              equations.                    AmfClinNutr             l988;47:7-l4.

                              KEY       WORDS                   Body      composition,         densitometry,       bioelectrical      impedance          analysis,       lean     body
                              mass


Infroduction                                                                                                    sites in large samples    of men                 and women                 who     vary widely
                                                                                                                in age and body      fat content.
    The use of bioelectrical           impedance        analysis        (BIA)      in
body     composition       assessment       has been investigated                 re-
cently.    BIA, a portable      impedance      analyzer      (RJL Systems,                                      Subjects        and   methods
Detroit,      MI), is a localized          50-kHz        current-injection
                                                                                                                Subjects
method       that yields a measure           of total body           resistivity.
                                                                                                                     Fifteen hundred     sixty-seven    subjects (1069 men, 498 women)
The      method         is based         on the principle                 that   impedance             to
                                                                                                                aged 17-62 y were studied in four laboratories               located in four
the electrical          flow of an injected  current   is related to the
                                                                                                                different    cities in the United     States: San Francisco,      CA (lab A);
volume      ofa       conductor   (the human     body) and the square
                                                                                                                New York,         NY (lab B); Natick,     MA (lab C); and San Diego, CA
of the length            of the conductor        (height).     Hoffer et al (1)
demonstrated             that total body water (TBW) and lean body
mass (LBM)              were strongly     correlated       with height2/resis-                                     I   From    the Division       of Pediatric        Cardiology          (KRS),    Mount   Sinai
tance,     where       body         resistivity         or impedance             was measured                   School ofMedicine, New York, NY; the US Dept of Agriculture (MVL),
with     a tetrapolar           electrode            configuration.                                             Western Human Nutrition Research Center, San Francisco,   CA; the US
   Several         recent       studies   (2-4) demonstrated                         strong         cor-        Army Research         Institute ofEnvironmental      Medicine (PIF), Natick, MA;
relations    between             BIA (either height2/resistance      measured                                   the Naval Health Research Center(JAH),             San Diego, CA; and the Obesity
with BIA or LBM and TBW predicted                      from BIA with use                                        Research     Center (TBVI), St. Luke’s-Roosevelt            Hospital    Center, New
of equations        provided      by the manufacturer)             and TBW                                      York, NY.
                                                                                                                    2 Supported      in part by grants from the National Institutes of Arthritis,
measured        by isotope     dilution     and densitometrically             de-
                                                                                                                Diabetes,     and Digestive        and Kidney Diseases (grant #AM-26687)          and
termined      LBM. However,           these studies     have usually       made
                                                                                                                by the Naval Medical Research and Development                Command       (work unit
use of small or heterogeneous                 samples,      and the repro-
                                                                                                                #M0096.OOl-1050).
ducibility    of the method       between     laboratories      has not been                                        3 Address     reprint     requests   to Dr Karen R Segal, Annenberg          3-45,
determined        by means of cross-validation              studies.                                            Mount Sinai School ofMedicine,              Box 1201, 1 Gustave     Levy Place, New
    The purpose        of this study is to cross-validate              the BIA                                  York, NY 10029.
method      by comparing         the relationship        between      BIA and                                       Receivedianuary            12, 1987.
densitometrically         determined        LBM at four geographical                                                Accepted     for publication       March 24, 1987.

Am J Clin Nuir          l988;47:7-14.             Printed     in USA.     © 1988 American            Society for Clinical Nutrition                                                                                 7
SEGAL            ET       AL

(lab D). After              all experimental                  procedures           were explained    to the                          tions        to predict        densitometrically                   determined                    LBM         (LBMd)             for
subjects          their written               informed          consent          was obtained.    The test                           each         sample.         Resistance,            reactance,            height2/resistance,                      weight,
protocol          was reviewed                 and approved                by the institutional                   review             height2,   age, and               sex (dummy                  coded          with males,    = 0, females
board      at each of the participating         institutions.    Each subject                                                        =   1) were offered                as possible             predictors.           LBMd    was used as the
completed        all measurementS      on the same morning.        Most of the                                                       dependent    variable. The regressions were carried out in stepwise
subjects      were studied     after an overnight       (12 h) fast and those                                                        fashion.  Before pooling   the data from males and females,       the
who were not tested after an overnight                 fast were at least 3 h                                                        equality  of the slopes for males and females was tested for sta-
postabsorptive.                                                                                                                      tistical   significance      (1 1).
                                                                                                                                           A quadruple       cross-validation                   of the equations       for predicting
Densitometry                                                                                                                         LBMd           from       BIA was carried                out according      to the procedure
    Body fat content    and LBM were determined            by densitometry.                                                          described    by Lord                   and        Novick    (12): the best-fitting      equation
At lab B, body density      was determined        by hydrostatic     weighing                                                        derived   from each                   data       set was applied     to the other three data
in a stainless   steel tank in which a swing seat was suspended                                                                      sets. For each data                   set statistical            significance                ofthe          deviation            of
from a Chatillon       15-kg scale (Chatillon,       New York, NY). At                                                               the regression                of LBMd              on LBM,               cross-predicted                     with use of
labs A, C, and D, the underwater           weighing    systems were mod-                                                             the equations                 derived        from          the other           three            laboratories,           from
ifications          ofthe       method             ofAkers           and      Buskirk         (5), which          makes              the line        of identity           was        tested.        This      procedure                   was    followed            to
use of force transducers.    The subjects submerged       beneath                                                           the      test the significance           of differences     in the best-fitting   regression
surface of the water while expiring    maximally    and remained                                                             as      lines among laboratories              (1 1).
motionless   as possible  at the point   of maximal    expiration                                                           for          Additional      statistical     analyses   ofthe data are described        in the
,      5   5  while underwater                  weight was             recorded.  After several   prac-                              results    section.    The 0.05 level of significance              was used for all
tice       trials to familiarize                the subjects             with the test procedure,     10
                                                                                                                                     data analyses.


                                                                                                                                                                                                                                                                               Downloaded from www.ajcn.org by on January 11, 2008
trials were performed      except in lab A where only 4 trials were
performed.     The estimated      underwater   weight  was the highest                                                               Results
value that was reproduced        three times (6). In labs A, B, and C
residual   lung volume      was estimated    by means    of the closed-                                                                The characteristics                        of the subjects are shown    in Table
circuit          oxygen        dilution            method            of Wilmore               (7)     with      use     of a         I The population
                                                                                                                                         .                                    varied widely with respect    to age and
Collins           spirometer            (Warren              E Collins,           Braintree,             MA)          and       a
                                                                                                                                     body          composition.               The         same         predictor                 variables           were            se-
Hewlett Packard Model 47302A (Hewlett-Packard,          Cupertino,
                                                                                                                                     lected by the stepwise    regression  procedure                                                       in all four sets
CA) or a Med-Science     Model 505D  nitrogen    analyzer     (Fiske
Med-Science,   St Louis, MO). In lab D, residual      volume      was                                                                of data: R, ht2, wt, age, and sex. The data                                                           from the men
measured             by the closed-circuit                      helium         dilution         method           (8) with            and women     were treated separately     because                                                      the regression
use of          a Collins       Model           3002 modular                   lung analyzer                 (Warren            E    coefficients        ofthe              best-fitting               regression                lines           were signif-
Collins).          In labs B, C, and                    D, two trials             were         performed               while         icantly      different                for men               and       women.                  The            best-fitting
the subjects              assumed             a sitting       position         that duplicated                  body        po-      equations              for     each      laboratory                are shown                     in Table             2. Re-
sition   in the tank during underwater        weighing.   Residual    volume                                                         sistance and height2, individually,         were better predictors
at lab A was measured        in the water at the time ofthe      underwater                                                          of LBMd    than the calculated    height2/resistance,         as deter-
weighing.      Body  density     was calculated      from the formula        of                                                      mined by greater correlation    coefficients      and smaller    SEES.
Goldman        and Buskirk (9) and percent           body fat was derived
                                                                                                                                     The residuals   were analyzed      and found          to be randomly
from body density                     by use ofthe              Siri equation             (10): percent                body
fat = (4.95/density)                      - 4.5.       LBM is the difference      between                               total
body weight and                      fat weight,        where fat weight     equals    total                           body
weight multiplied                     by percent              body     fat.                                                          TABLE 1
                                                                                                                                     Characteristics              of the subjects            (mean     ±    SD)
Bioe!ectrical               impedance              analysis
                                                                                                                                                                             LabA                   LabB                         LabC                      LabD
     Total body resistivity     was measured     with a four-terminal    por-
                                                                                                                                                                           (n = 96)               (n = 99)              (n        = 490)              (n    = 404)
table impedance        analyzer     (RJL   Systems,     Detroit,   MI). Mea-
surements     were made while the subjects           lay comfortably     on a                                                        Men
stretcher with the limbs abducted        from the body. Current-injector                                                               Age                                  32±   9                 26±   8                   34±   8                   32±   7
electrodes    were placed just below the phalangeral-metacarpal                                                                        Weight(kg)                           75±12                   79±12                     79±12                     88±13
joint          in the middle            of the dorsal             side     of the right               hand      and just               Height(cm)                          178± 8                  179± 7                    175±   7                  179± 7
below           the transverse                (metatarsal)            arch on the superior                        side of              LBM(kg)*                             61±   8                 66±   7                      62±         8             67±         8
the right foot. Detector                           electrodes         were placed on the posterior                                           Percent fat                     18 ± 7                 16 ± 8                       22    ±     7             23    ±     8
side of the right wrist,                           midline,          with the prominent   pisiform                                           Resistance(Q)                 485±63                 459±47                    442±55                     432 ±49
bone           on the       medial        (fifth      phalangeal)              side     and         ventrally         across
                                                                                                                                                                             LabA                   LabB                         LabC                      LabD
the medial            ankle   bone ofthe right ankle with the foot semiflexed.                                                                                             (n = 64)               (n = 81)                  (n    = 224)              (n    =  141)
Resistance              (R) to the flow ofa 50-kHz  injected current was mea-
sured on a 0- l000-(      scale and reactance       (Xc) was measured      on                                                        Women
a 0-20041    scale. Empirically      derived    formulas   provided    by the                                                          Age                                   35±         9           29±10                       24±         5             27±         6
manufacturer       of the instrument         were    used to calculate     es-                                                         Weight(kg)                            59±         8           71±23                       61±         8             63±         9
timated           LBM.                                                                                                                       Height(cm)                    165±          8           165±       7            163±            6         164±                7
                                                                                                                                             LBM (kg)*                       43   ±      6         48 ± 7                     44 ±           6          45 ± 5
Statistical          analyses                                                                                                                Percent fat*                    27   ±      8         29 ± 12                   28 ±            6          27 ± 8
                                                                                                                                             Resistance(Q)                 587±58                 551±68                    554±62                     559±68
    Multiple   regression     analyses   were                                 applied         to the data from
each laboratory      to derive best-fitting                                   multiple         regression equa-                              S   Determined          from hydrodensitometry.                        LBM          =     lean body mass.
LEAN          BODY                MASS              ESTIMATION                     BY     IMPEDANCE                                                                            9

TABLE 2                                                                                                                                  ofidentity.        Reductions        in the correlation          coefficients      and
Best-fitting  equations                 for predicting          lean body mass for each lab and                                          increases        in the SEEs resulting             from     application         of the
all labs pooled                                                                                                                          equations         derived      at other     laboratories         compared         with
   vnab1e                    Lab A                Lab B               Lab C               Lab D                  All labs                the best-fitting          equations       were       minimal.        However,         as
Men
                                                                                                                                         shown        in Table 3, differences          in regression       equations       were
  Height2                    0.00109              0.00124          0.00122                0.00140                 0.00132                found       among      some ofthe       laboratories.         For the men these
   Resistance             -0.01607              -0.06626         -0.03736               -0.06336             -0.04394                    differences        were attributable        to differences        among       the lab-
   Weight                    0.41004               0.26261          0.31973                0.26079              0.30520                  oratories       in body      fat content:       The lab C and lab D men
   Age                    -0. 15407             -0.22776         -0.13038               -0. 15634            -0.16760
                                                                                                                                         were significantly  fatter than the lab A and lab B men.
   Intercept                 8.14874             41.35041         19.77883               32.29519             22.66827
        R                    0.9$ I                0.907            0.882                  0.896                0.898                       When adjustment      was made statistically  for differences
        SEE                  3.28                 2.91             3.62                   3.49                    3.61                   in body fat content  among the four labs, differences     among
                                                                                                                                         regression           equations
                                                                                                                                                                      were eliminated.       Specifically,     LBMCI
   vuiable                   Lab A                Lab B               Lab C               Lab D                  All     Labs
                                                                                                                                         was regressed                on body
                                                                                                                                                                         fat and residualized         LBMd     values
Women
                                                                                                                                         were obtained.           The residualized       LBMd,      purged     of any
  Height2                    0.00112               0.00114         0.000942               0.00103                 0.00108
   Resistance             -0.03797              -0.02502         -0.01410               -0.02578             -0.02090
                                                                                                                                         relationship        with body      fat, was used as the dependent
   Weight                    0.21110              0.18856          0.31153                0.22280                 0.23199                variable     and stepwise regressions        were carried       out for each
   Age                    -0. 12953             -0.06498         -0. 14505              -0.01802             -0.06777                    lab using      resistance,    height2,    weight,    and age as the in-
   Intercept               27.16729              19.25955         10.91436               18.29870                14.59453
                                                                                                                                         dependent              variables.           The       resulting      regression             equations
        R                    0.891                0.942            0.876                  0.861                   0.889
                                                                                                                                         were analyzed          for statistical      differences      among        labs. For
        SEE                  2.51                 2.31             2.15                   2.42                    2.43


                                                                                                                                                                                                                                                         Downloaded from www.ajcn.org by on January 11, 2008
                                                                                                                                         both men and women                (even though         the differences       among
                                                                                                                                         labs in the women’s             body fat did not achieve                 statistical
                                                                                                                                         significance)       no statistical       differences       among       labs in the
distributed              and were uncorrelated                            with the predicted                       LBM                   regression     coefficients      were obtained          when this adjustment
values.                                                                                                                                  for body      fat was made.          This confounding             effect of body
                                                                                                                                         fatness         on the prediction                     of LBMd         supports             a previous
Quadruple                cross-validation                                                                                                finding       that      the error in predicting                     LBMd            from       BIA    was
                                                                                                                                         significantly            related to obesity     (4).
    The            quadruple              cross-validation                    of the          equations                    for               The relationship                 between            LBM       predicted          from        height2,
predicting              LBMd       is shown                  in Table 3. The purpose                               of the                resistance,         weight,  and age and LBMd for men and women
quadruple               cross-validation                       was to determine    the                            repro-                 (all labs          pooled    but separate       equations      for men       and
ducibility across laboratories    of the relationship     between                                                                        women)           is shown     in Figures     1 and 2. When the data are
LBMd and LBM predicted         from BIA and other variables.                                                                             expressed         as percent      body    fat, the correlations        between
LBMd was regressed       on LBM predicted          by each of the                                                                        densitometrically            determined       percent     body    fat and pre-
equations               in order           to      determine              whether           the         slopes           and             dicted    percent       body fat are r = 0.809            and r = 0.852       for
intercepts  differed                      from 1 and               0, respectively,                     indicating                       men       and women,                respectively,           with SEEs          of4.44%             fat for
that the regression                      lines differed               significantly                from      the         line            men       and        3.98%       fat for women.


TABLE          3
Quadruple            cross-validation             ofequations          for predicting            lean     body mass (LBM):         correlations                  (and     SEE) between           densitometrically       determined           LBM
(LBMd)         and      LBM predicted               by best-fitting         equation        from each             lab and all labs pooled

                                                                                       LabA                                              LabB                                     LabC                                       LabD
            Men
               LBM        (lab    A equation)                                 0.911      (3.23)                                  0.854     (3.54)t                           0.872    (3.75)                         0.854     (4.08)ff
               LBM        (lab    B equation)                                 0.832      (4.34)t1                                0.907 (2.86)                                0.860    (3.92)tf                       0.892     (3.54)
               LBM        (lab    C equation)                                 0.896      (3.47)                                  0.883     (3. 19)                           0.882    (3.61)                         0.884     (3.66)
               LBM        (lab    D equation)                                 0.853      (4.09)ff                                0.902     (2.94)                            0.871    (3.77)t                        0.896     (3.48)
               LBM        (all   labs equation)                               0.886      (3.62)                                  0.893     (3.06)                            0.88 1   (3.63)                         0.889     (3.58)

                                                                                       LabA                                              L.abB                                    LabC                                       LabD
            Women
              LBM         (lab    A equation)                                 0.891      (2.45)                                  0.936     (2.38)tf                          0.834    (2.45)tt                       0.841     (2.55)tf
              LBM         (lab    B equation)                                 0.878      (2.58)                                  0.942     (2.27)                            0.854    (2.30)                         0.856     (2.44)
              LBM         (lab    C equation)                                 0.859      (2.76)                                  0.932     (2.44)ff                          0.876    (2.15)                         0.832     (2.62)
              LBM         (lab    D equation)                                 0.868      (2.68)                                  0.936     (2.38)ff                          0.853    (2.32)                         0.861     (2.40)
              LBM         (all   labs equation)                               0.872      (2.64)                                  0.940     (2.30)                            0.866    (2.22)                         0.856     (2.44)
    S    Best-fitting        results      for each lab are indicated                   by italics.
    t Intercept           significantly different from 0; p < 0.05.
    :l:Slope significantly             different from 1; p < 0.05.
SEGAL       ET AL
             90                                                                                                                                                                                     and vice versa were significantly     different     from                                                                                                                    LBMd
                                                                                                                                                                      000               5    0      (Table 6).
                                                                                                                                           DO                        DO
                                                                                                                               C           0           0         D*C*                        C         Figures 3 and 4 show the relationship        between                                                                                                                     LBMd
                                                                                                                         CC0O*                              0*        0             0
             80-                                                                                                     O         ODD                          0               0
                                                                                                                                                                                                    and LBM predicted     with use of the fatness-specific    equa-
                                                                                                                   *000*CDS                            11
                                                                                                              CS     *0000000*C
                                                                                                          *0000000000                              C             *
                                                                                                                                                                                                    tions. The dispersion ofdata points is considerably     smaller
                                                                                                      DDDO000000000*                                        DO
                                                                                                                                                                                                    than when the generalized     equations   were applied     (Figs
 0’
             70-                                                                               *      *A000IHSO*ODCDO*
                                                                                          DSS0N*0000000                            C
                                                                                       #{149}000000000000*OC                                                                                         1 and 2). For men, the R value increased        from 0.896 to
                                                                                  C     CC00000000*                      CC*
                                                                              A       00*0*0*00*000                                                                                                 0.938  and the SEE                                   decreased                           from                          3.62              to 2.84                        kg with
     SI                                                        A              0*110000000S0*                         *

     E       60-                                                     *CC*0*00000*0*                                                                                                                 use of fatness-specific equations.    For women,   the multiple
     0                                                             *DC00000CXOC000C


     SD
                                                           CDA      C000*000110
                                                           ACC0000000COC                              C
                                                                                                              C
                                                                                                                                   A                    I             k     A                       correlation coefficient   R increased     from 0.889 to 0.930
     C

 0
  SI
             5Q                                  C
                                                         ACAC0000COC
                                                           ACC*D*AC                                                                B=LabB                                                           and the SEE decreased      from 2.43 to 1.95 kg with use of
                                                 CCC
                                                     A     C       *CCC                                                                        -
                                                                                                                                               -
                                                                                                                                                                                                     fatness-specific                        equations.                         For the men when the data are
-J                                 CCC                                                                                             DLabD                                                             expressed                  as        percent        body                      fat, the correlation         between
                                         C   C                                                                                     * = Multiple data
             40                                                                                                                                                                                      densitometrically                             determined                         and predicted     percent      body
                                                                                                                                         points
                                                                                                                                                                                                     fat increases                     from 0.809 to 0.896 and the SEE decreases
                               C                                                                                        r.896
                                                                                                                                                                                                     from 4.44%                      fat to 3.35% fat with use ofthe fatness-specific
             30                                                                                                      SEE =3.62kg
                                                                                                                                                                                                     equations.        For the women                                                 the           correlation                                        between                       den-
                                                                          I                                                            I                         I              I
                                                                                                                                                                                                     sitometrically       determined                                            percent    body fat and predicted
                       ..    40                          50                           60                           70                                   80                                  90       percent       body   fat increases                                           from 0.852 to 0.909 and the


                                                                                                                                                                                                                                                                                                                                                                                                Downloaded from www.ajcn.org by on January 11, 2008
                                                                    LBM(BIA)                                 (kg)                                                                                    SEE decreases         from 3.98%                                            fat to 3. 18% fat with use of the
                                         (Best fitting                                 equation                    for all men)                                                                      fatness-specific                        equations.
                                                                                                                                                                                                                The     practical     application                                      of the fatness-specific                                                                  equa-
    FIG 1. Relationship     between densitometrically determined   lean body
                                                                                                                                                                                                     tions            is questionable          since                                   their  use depends                                                                  on       prior
mass (LBMd) and lean body mass (LBM) predicted             from bioelectrical
                                                                                                                                                                                                     knowledge        of an individual’s                                  Further-       body   fat content.
impedance    analysis   (BIA) and other indices with use of the best-fitting
equation  for the men in all four laboratories.
                                                                                                                                                                                                     more, the fatness-specific          equations      for predicting      LBMd
                                                                                                                                                                                                     are the basis of categorizing            the subjects       with respect      to
                                                                                                                                                                                                     densitometrically       determined         percent     body     fat, and it is
                                                                                                                                                                                                     important       to note that percent        fat and LBM are not truly
Fatness-speafic                prediction                                 equations                                                                                                                  independent                          since         both          are derived                                     from                   hydrodensitom-
                                                                                                                                                                                                     etry. Although                     for subjects who are obviously      lean or obese
          Additional         analyses                      were                       applied                  to the data to char-                                                                  there would                     be no question     as to which prediction    is most
acterize           further     the relationship                                                between             body fatness and                                                                  appropriate,                     for subjects   who are neither   clearly lean nor
the         prediction         of LBMd                                by BIA                                and to determine     the
appropriateness                    of fatness-specific                                                         equations.                                                 The               total
populations         of men and women                 were divided         randomly
into two subsets           for the purpose           of cross-validation            and
each subset         was divided          into normal          and obese groups                                                                                                                                        65-                                                                                                                                              S            S


based on whether              the subjects        were less than or greater
                                                                                                                                                                                                                                                                                                                                                                  55
than 20% and 30% body fat for men and women,                                  respec-                                                                                                                                 60-                                                                                                                         S       SB
tively. For each of the two sets of normal                        and obese men                                                                                                                       0’
                                                                                                                                                                                                                                                                                                                                    S                 S
                                                                                                                                                                                                                                                                                                                         A                                S
and normal         and obese women               (total of eight subsets),            an                                                                                                                              55    -
                                                                                                                                                                                                                                                                                                                     CD.
                                                                                                                                                                                                                                                                                                   0         C       DOD
equation      for predicting         LBMd was derived.               The same set                                                                                                                                                                                                                      *C            *C*        C
                                                                                                                                                                                                                                                                                        O          *        *D*C*OSD                    S
of variables       (height2,     resistance,       weight,      and age) entered                                                                                                                          SI
                                                                                                                                                                                                          E           50    -                                                  SCC
                                                                                                                                                                                                                                                                                     #{149}0*0*00*SC
                                                                                                                                                                                                                                                                                            *B**             IHI           C        D
                                                                                                                                                                                                          0
into all equations           except that age did not enter into the                                                                                                                                                                                                             *S**C*C*SCDS
                                                                                                                                                                                                          (I)                                                              C     A***IHHI***                             S

equations       for the two sets ofnormal                women.        The fatness-                                                                                                                       C                                                                    **IHHI***C                    *                          A     =       Lab A
                                                                                                                                                                                                      .               45    -                                    D       *0*5*1155CC                        CD       C

specific equations           and the cross-validation               ofthese      equa-                                                                                                                                                                           C*****000**C
                                                                                                                                                                                                                                                                                                                                        B             Lab B
                                                                                                                                                                                                                                                                 #{149}
                                                                                                                                                                                                                                                                    S*C*0000            SO     C                                        C     =       Lab C
tions between          the two randomly               generated       sets for each                                                                                                                                   40    -
                                                                                                                                                                                                                                                           S*S**IIOOS*0C
                                                                                                                                                                                                                                                           *005*5000CC                                                                  0     =       Lab D
                                                                                                                                                                                                     -I
sex and level of fatness             are shown in Tables              4 and 5. Use                                                                                                                                                                   C
                                                                                                                                                                                                                                                         *B*DC*CDCC

                                                                                                                                                                                                                                                               *C**CSCC
                                                                                                                                                                                                                                                                                                                                        11    :       Multiple data
of these fatness-specific              equations        greatly     improved         the                                                                                                                                                             AACC     *SC                                                                                       points
                                                                                                                                                                                                                      35    -                      #{149}CDC C

accuracy       of predicting          LBMd:        the multiple         correlation                                                                                                                                                                  CCC     D
                                                                                                                                                                                                                                                                                                                                        r =889
coefficients      were significantly         increased       and the SEES were                                                                                                                                                                                                                                                 SEE        =2.43                    kg
                                                                                                                                                                                                                      30
significantly        reduced.      No differences           were found          in the                                                                                                                                          ii    I             I                I                 I                         I                      I                     I                 I           I
regression     coefficients       between     set 1 and set 2 of normal                                                                                                                                                              30                        40                                           50                                        60                                70
men, obese men, normal                  women,      or obese women,             in-
                                                                                                                                                                                                                                                                            LBM(BIA)                                 (kg)
dicating   the validity        and reproducibility       of fatness-specific
equations     (Table 5). However,           significant    differences      were                                                                                                                                                                  ( Bestfitting                      equation                         for all women)

observed     between        the regression     equations     for the normal                                                                                                                              FIG 2. Relationship   between densitometrically determined lean body
and obese subjects             for both men and women.                 Further-                                                                                                                      mass (LBMd) and lean body mass (LBM) predicted from bioelectrical
more,           the mean predicted                                       LBM values obtained                                                                                            by ap-       impedance    analysis (BIA) and other indices with use of the best-fitting
plying          the normal group’s                                     equations to the obese                                                                                   subjects             equation for the women in all four laboratories.
LEAN            BODY          MASS       ESTIMATION                BY IMPEDANCE                                                                         11
TABLE 4
Fatness-specific     equations      for predicting         LBM

                                                                    Normal                                                                                       Obese

                                    SetI                             Set2                         Setl                              Setl                         Set2                               SetI
   Variable                      (n=244)                           (n=228)                       +set2                         (n=295)                        (n=302)                              +set2
Men
   HCight                        0.00060171                    0.00071366                     0.00066360                        0.00072092                     0.001020                         0.00088580
   Resistance               -0.01959                         -0.02319                      -0.02 1 17                        -0.0542     1                  -0.08245                         -0.02999
   Weight                        0.65940                           0.59597                     0.62854                         0.48291                        0.38179                            0.42688
   Age                      -0. 14244                        -0.     10545                 -0. 12380                         -0.0542  1                     -0.08245                         -0.07002
   Intercept                   8.73968                           10.64701                     9.33285                         11.48504                       16.69512                         14.52435
     R                         0.948                              0.943                       0.946                             0.937                          0.939                           0.937
      SEE                      2.50                                2.44                       2.47                              2.97                          3.04                             3.03

                                                                    Normal                                                                                       Obese

                                     Seti                             Set2                         SetI                             SetI                         Set2                                Sell
   Variable                       (n= 146)                         (n= 177)                      +set2                            (n=99)                       (n=76)                              +set2

Women
  Height2                      0.00060098                          0.00066464                 0.00064602                       0.000955      14               0.00077596                         0.00091186


                                                                                                                                                                                                                   Downloaded from www.ajcn.org by on January 11, 2008
  Resistance                -0.018 17                        -0.01        121              -0.01 397                         -0.01420                       -0.01 560                        -0.01466
   Weight                        0.40328                           0.43868                     0.42087                          0.3 1 134                      0.282 16                         0.29990
   Age                      -                                -                             -                                 -0.07187                       -0.06215                         -0.07012
   Intercept                     15.26646                          7.18338                     10.43485                         7.47371                      14.20227                           9.37938
     R                            0.839                            0.903                        0.907                           0.953                          0.954                            0.952
     SEE                          1.90                             2.00                         1.97                           2.06                           1.81                               1.97


obese,     there is a need for a technique             to determine     which                              pendent          of densitometrically                 determined               body   fatness,
prediction         equation       is most applicable.        The validity      of                          would         significantly         improve        the prediction               of LBMd,      an
fatness-specific          equations    for predicting       LBMd requires       a                          independent              group     ofsubjects        was studied.              These     subjects
method        of categorizing        subjects   that is objective     and in-                              (88 men,         72 women)           underwent            hydrostatic          weighing,       BIA
dependent         ofdensitometry.         Body mass index (BMI), body                                      measurement,         and skinfold            thickness       measurements.
surface      area (BSA), and percent            ofdesirable     body weight                                Percent           fat was derived
                                                                                                                           body                       from the sum of the biceps,
according        to the 1959 Metropolitan             Life Insurance      stan-                            triceps, suprailiac      crest, and subscapular               skinfolds      with
dards         (13)
                were tested as possible            classification        criteria.                         use of the tabled values of Durnin                  and Womersely           (14).
Classification       of the subjects       by these indices did not sig-                                   The subjects     were divided        into normal          and obese groups
nificantly    improve       the prediction     ofLBMd:          categorization                             based on whether        anthropometrically             determined       percent
ofthe subjects        according      to whether      they had a BMI less                                   fat was less than or greater             than 20% for men and less
than     or greater     than 26, were below or above the 50th                                              than or greater       than 30% for women.                   Compared         with
percentile     ofBSA for their sex, or were less than or greater                                           densitometrically                 determined          percent           fat,   82 of 88 men
than 120% of desirable             body weight        did not lead to sig-                                 (93%)     and     66 of 72 women            (92%) were correctly                 catego-
nificant    increases      in the multiple       correlation        coefficients                           rized with respect             to their level of fatness.           To determine
or significant      reductions      in the SEEs. Each of these three                                       the effectiveness            of this classification,         for each subgroup
criteria   also was tested as a continuous    variable:     in separate                                    (normal and obese men, normal and obese women)                                    LBMd
analyses,      each ofthe indices was entered      forcibly     into the                                   was compared             with LBM estimated                with use of the gen-
regression       equation to predict LBMd at the first step, and                                           eralized       equations         and LBM estimated               with use of the
height2,     resistance,  weight,   and age were entered          block-                                   fatness-specific           equations.      These       results     are shown              in
wise at the second step (1 1). Separate     analyses were carried                                          Table 7. Use ofthe generalized                 BIA equations            significantly
out for men and women.               The resulting         correlations     and                            underestimated             LBMd for both the normal                  men and nor-
SEEs were not significantly            different    from those obtained                                    mal women.               However,       the question            remained            as to
by use ofthe generalized            equations      derived      from all men                               whether        use of the BIA fatness-specific                 equations          signifi-
and all women        (individually)       pooled together           (Figs 1 and                            cantly       improved           the prediction           of LBMd             over       an-
2), indicating    that BSA, BMI, and percent                  desirable   body                             thropometry             alone.       To answer          this    question,            LBM
weight      did not significantly          improve      the prediction         of                          values (LBMa)               were derived        from anthropometrically-
LBMd.                                                                                                      determined          percent       body fat: weight - (weight                X percent
                                                                                                           fat). LBMd was regressed               on LBMa and LBM determined
 Use ofanthropometry                       to categorize         subjects                                  with use of the fatness-specific                 equations        with LBMa en-
   To test whether categorization  ofsubjects                                   into two levels            tered forcibly at the first step. The significance                        ofthe entry
of fatness on the basis of anthropometry,                                       which is inde-             of LBM derived               with the fatness-specific             BIA equations
SEGAL                  ET AL
TABLES                                                                                                                                                           for men and from                      2.63 to 2.09 kg for women).                                 Thus,
Cross-validation                of fatness-specific      equations                for predicting               lean body mass*                                   anthropometrically                    determined  percent fat can                             be used
(LBM)                                                                                                                                                            reliably         as the criterion      for determining     which                              fatness-
                                                                                                                                                                 specific        BIA equation      to apply.  There is obviously                               no need
                                                                Normal                         Normal                             All normal
                                                                                                                                                                 to prescreen   subjects who are extremely        lean or extremely
                                                                 seti                              set2                               men
                                                                                                                                                                 obese. However,       for subjects    who are neither   clearly lean
Men                                                                                                                                                              nor obese, anthropometry           may be useful in determining
   Normal              men
           LBM (normal set I eq)                              0.948           (2.50)        0.942             (2.45)                   -
                                                                                                                                                                 the optimal    BIA prediction        equation.  It is important     to
           LBM (normal set 2 eq)                              0.947 (2.51)                  0.943             (2.44)                   -                         note, however,     that the fatness-specific   BIA equations      sig-
           LBM (obese men’s eq)                                       -                               -                       0.939 (2.60)t                      nificantly            improve        the     prediction          of LBMd            over      anthro-
                                                                  Obese                         Obese                              All obese                     pometry             alone.
                                                                  sell                             set2                               men
   Obese           men                                                                                                                                           Manufacturer’s                  prediction         equation
           LBM (obese set 1 eq)                               0.937           (2.97)        0.934             (.318)                   -


           LBM         (obese    set 2 eq)                    0.933           (3.06)        0.939             (3.05)                   -
                                                                                                                                                                        Equations      are         provided with the BIA    instrument       for
           LBM (normal              men’s eq)                          -                              -                       0.932            (3.l3)t
                                                                                                                                                                 the        prediction              of LBM:     for  men      LBM = 6.493
                                                                Normal                         Normal                              All normal                    + 0.4936(height2/resistance)              + 0.332(weight);         and      for
                                                                      set 1                     set 2                                women
                                                                                                                                                                 women         LBM            5.09 1 + 0.6483(height2/resistance)
Women                                                                                                                                                            + 0. 1699(weight).           The correlation       between       LBMd     and


                                                                                                                                                                                                                                                                           Downloaded from www.ajcn.org by on January 11, 2008
    Normal             women
                                                                                                                                                                 LBM predicted            with use of the manufacturer’s            equation
           LBM (normal set I eq)                              0.916           (1.90)        0.897             (2.05)                    -


           LBM(normalset2eq)                                  0.911           (1.93)        0.903(2.00)                                    -
                                                                                                                                                                 was r = 0.857          (SEE     =  3.70 kg) for men and r = 0.800
           LBM (obese women’s                  UI)                        -                               -                      0.897 (2.06)t                   (SEE = 3.18 kg) for women.               However,     the mean predicted
                                                                                                                                                                 LBM was significantly             greater than LBMd for both men
                                                                  Obese                          Obese                              Allobese
                                                                   set 1                          set 2                              women                       (69.2        ± 8.52       kg predicted             LBM        vs 64.0       ± 8.2        kg LBMd)
                                                                                                                                                                 and women                (47.3 ± 6.2 kg predicted  LBM vs 44.6 ± 5.30
    Obese women
       LBM (obese set 1 eq)                                   0.953           (2.05)        0.953             (1.97)                       -
                                                                                                                                                                 kg LBMd),               indicating  that the manufacturer’s   equation
       LBM (obese set 2 eq)                                   0.952           (2.06)        0.954             (1.81)                       -                     systematically              overestimated                 LBMd        for both           sexes.    This
       LBM (normal   women’s                     ui)                      -                               -                       0.938 (2.20)t                  overestimation  of LBMd by the manufacturer’s equation
                                                                                                                                                                 was most apparent    in the obese men and women      (Ta-
     11 Best-fining   equations     for predicting    LBM for normal       and obese men and
women       denved   from set 1 were applied        to set 2 and vice versa. Measured           LBM                                                              ble 6).
(LBMd) was regressed on LBM predicted               with use ofthe equation       developed     from
the opposite       t and correlations     between    measured   and cross-predicted        LBM and
SEES are shown. Effect of fitness-specific            equations is indicated      by regression     of
                                                                                                                                                                 Discussion
LBMd on LBM cross predicted               by applying     obese subjects’ equation to normal
subjects and vice versa.
       t Slope significantly             different     from      1, p         <   0.05;   intercept               significantly       different                      The results ofthis study confirm                    the validity ofthe BIA
from       0, p<        0.05.                                                                                                                                    method        for predicting        LBM in large heterogeneous                       sam-
                                                                                                                                                                 ples of men and women.                   In contrast        to previous          reports
                                                                                                                                                                 (2-4),      height2       and resistance           individually          rather      than
at the second step was then determined.                                                                          For both men                                    height2/resistance           were selected by the stepwise                  regression
and women the addition  ofLBM    derived                                                                      from the fatness-                                  process.      This finding was consistent                 among the four labs.
specific BIA equations     significantly     improved                                                                      the       predic-                     Also, whereas           in previous       studies (3, 4) the slopes of the
tion of LBMd:     the change       in the correlation
                                               coefficients                                                                                                      prediction         equations       were not reliably           different       between
(from R = 0.934 to 0.943 for men and from R = 0.923                                                                                                              men and women,                 in the present         study significant            differ-
to 0.952 for women)   was highly significant (p < 0.0001)                                                                                                        ence in the regression                coefficients        were found           between
as were the reduction  in the SEEs (from 2.53 to 2.22 kg                                                                                                         men and women.               It is possible that discrepancies                 between


TABLE              6
Comparison                of mean (±SD) densitometrically                                     determined                     lean body mass (LBMd)                            with    lean body     mass (LBM)            cross-p redicted     with use of fatness-
specific           equations    and RJL System’s   equation

                                                                                            Normal                   men                                   Obese men                               Normal         women                      Obese women
               LBMd                                                                        64. 12             ±    7.56                                  63.95      ±    8.63                        44.54    ±   4.64                       44.71    ± 6.36
               LBM        (manufacturer’s     eq)                                          66.60              ±    7. 18                                 7 1 . 19   ±    8.95                        46.56    ±   5.44                       48.87    ±     7.04
               LBM        (obese men’s eq)                                                 57.98              ±    5.90
               LBM        (normal     men’s eq)                                                                                                          71.51      ±   10.1 1
               LBM        (obese women’s      eq)                                                                                                                                                    41.38    ±   3.91
               LBM        (normal     women’s   eq)                                                                                                                                                                                          49.63    ± 7.79

       S
           p   <    0.01        vs LBMd.
Segal
Segal

More Related Content

Viewers also liked

C2CNetwork Newsletter 1
C2CNetwork Newsletter 1C2CNetwork Newsletter 1
C2CNetwork Newsletter 1OVAM
 
Correlation between organ dysfunctions and vertebral displacements
Correlation between organ dysfunctions and vertebral displacementsCorrelation between organ dysfunctions and vertebral displacements
Correlation between organ dysfunctions and vertebral displacementsES-Teck India
 
Power Start Presentation
Power Start PresentationPower Start Presentation
Power Start Presentationshawbodymagic
 
Impedance dispersion
Impedance dispersionImpedance dispersion
Impedance dispersionES-Teck India
 
Sierra club final presentation
Sierra club final presentationSierra club final presentation
Sierra club final presentationJen
 
Wat is het C2C project? Walter Tempst, OVAM
Wat is het C2C project? Walter Tempst, OVAMWat is het C2C project? Walter Tempst, OVAM
Wat is het C2C project? Walter Tempst, OVAMOVAM
 
EIS technology : bioimpedance application in selective serotonin reuptake
EIS technology : bioimpedance application in selective serotonin reuptakeEIS technology : bioimpedance application in selective serotonin reuptake
EIS technology : bioimpedance application in selective serotonin reuptakeES-Teck India
 
C2 c maastricht_plan c_walter
C2 c maastricht_plan c_walterC2 c maastricht_plan c_walter
C2 c maastricht_plan c_walterOVAM
 
Chapter 8 Energy Balance And Body Composition
Chapter 8 Energy Balance And Body CompositionChapter 8 Energy Balance And Body Composition
Chapter 8 Energy Balance And Body CompositionDavenport University
 
Bioimpedance overview
Bioimpedance overview Bioimpedance overview
Bioimpedance overview ES-Teck India
 
Factors that influence nutrition intake in human
Factors that influence nutrition intake in humanFactors that influence nutrition intake in human
Factors that influence nutrition intake in humanLuxemberg Ng
 
Welkomswoord door Henny De Baets
Welkomswoord door Henny De BaetsWelkomswoord door Henny De Baets
Welkomswoord door Henny De BaetsOVAM
 

Viewers also liked (16)

Compensation Plan J
Compensation Plan JCompensation Plan J
Compensation Plan J
 
C2CNetwork Newsletter 1
C2CNetwork Newsletter 1C2CNetwork Newsletter 1
C2CNetwork Newsletter 1
 
Oxidative stress
Oxidative stressOxidative stress
Oxidative stress
 
Angitensin and ptg
Angitensin and ptgAngitensin and ptg
Angitensin and ptg
 
Tables nhanes
Tables nhanesTables nhanes
Tables nhanes
 
Correlation between organ dysfunctions and vertebral displacements
Correlation between organ dysfunctions and vertebral displacementsCorrelation between organ dysfunctions and vertebral displacements
Correlation between organ dysfunctions and vertebral displacements
 
Power Start Presentation
Power Start PresentationPower Start Presentation
Power Start Presentation
 
Impedance dispersion
Impedance dispersionImpedance dispersion
Impedance dispersion
 
Sierra club final presentation
Sierra club final presentationSierra club final presentation
Sierra club final presentation
 
Wat is het C2C project? Walter Tempst, OVAM
Wat is het C2C project? Walter Tempst, OVAMWat is het C2C project? Walter Tempst, OVAM
Wat is het C2C project? Walter Tempst, OVAM
 
EIS technology : bioimpedance application in selective serotonin reuptake
EIS technology : bioimpedance application in selective serotonin reuptakeEIS technology : bioimpedance application in selective serotonin reuptake
EIS technology : bioimpedance application in selective serotonin reuptake
 
C2 c maastricht_plan c_walter
C2 c maastricht_plan c_walterC2 c maastricht_plan c_walter
C2 c maastricht_plan c_walter
 
Chapter 8 Energy Balance And Body Composition
Chapter 8 Energy Balance And Body CompositionChapter 8 Energy Balance And Body Composition
Chapter 8 Energy Balance And Body Composition
 
Bioimpedance overview
Bioimpedance overview Bioimpedance overview
Bioimpedance overview
 
Factors that influence nutrition intake in human
Factors that influence nutrition intake in humanFactors that influence nutrition intake in human
Factors that influence nutrition intake in human
 
Welkomswoord door Henny De Baets
Welkomswoord door Henny De BaetsWelkomswoord door Henny De Baets
Welkomswoord door Henny De Baets
 

Similar to Segal

Validation and reliability_of_the_stayhealthy_bc3_body_composition_analyzer_i...
Validation and reliability_of_the_stayhealthy_bc3_body_composition_analyzer_i...Validation and reliability_of_the_stayhealthy_bc3_body_composition_analyzer_i...
Validation and reliability_of_the_stayhealthy_bc3_body_composition_analyzer_i...Steven E. Greene
 
RBE of the MIT clinical epithermal neutron beam
RBE of the MIT clinical epithermal neutron beamRBE of the MIT clinical epithermal neutron beam
RBE of the MIT clinical epithermal neutron beamkent.riley
 
Development and Validation of prediction for estimating resting energy expend...
Development and Validation of prediction for estimating resting energy expend...Development and Validation of prediction for estimating resting energy expend...
Development and Validation of prediction for estimating resting energy expend...IOSR Journals
 
Avida Ed Research Presentation
Avida Ed Research PresentationAvida Ed Research Presentation
Avida Ed Research Presentationdiontaedm
 
ESO system, ES-BC system and EIS-GS system - Miami University study
ESO system, ES-BC system and EIS-GS system - Miami University study ESO system, ES-BC system and EIS-GS system - Miami University study
ESO system, ES-BC system and EIS-GS system - Miami University study ES-Teck India
 
Hormônios menstruais x lassidão lca
Hormônios menstruais x lassidão lcaHormônios menstruais x lassidão lca
Hormônios menstruais x lassidão lcaGustavo Resek Borges
 
Lafont proteins 2007
Lafont proteins 2007Lafont proteins 2007
Lafont proteins 2007scbegay
 
The Assembly, Structure and Activation of Influenza a M2 Transmembrane Domain...
The Assembly, Structure and Activation of Influenza a M2 Transmembrane Domain...The Assembly, Structure and Activation of Influenza a M2 Transmembrane Domain...
The Assembly, Structure and Activation of Influenza a M2 Transmembrane Domain...Haley D. Norman
 
dual-event machine learning models to accelerate drug discovery
dual-event machine learning models to accelerate drug discoverydual-event machine learning models to accelerate drug discovery
dual-event machine learning models to accelerate drug discoverySean Ekins
 
A New Platform for Combining the ‘Bottom-Up’ PBPK Paradigm and POPPK Data Ana...
A New Platform for Combining the ‘Bottom-Up’ PBPK Paradigm and POPPK Data Ana...A New Platform for Combining the ‘Bottom-Up’ PBPK Paradigm and POPPK Data Ana...
A New Platform for Combining the ‘Bottom-Up’ PBPK Paradigm and POPPK Data Ana...mjamei
 
Cargas baixas e altas-adaptações-ao-trein0-de-força-schoenfeld2017.pdf
Cargas baixas e altas-adaptações-ao-trein0-de-força-schoenfeld2017.pdfCargas baixas e altas-adaptações-ao-trein0-de-força-schoenfeld2017.pdf
Cargas baixas e altas-adaptações-ao-trein0-de-força-schoenfeld2017.pdfFrancisco de Sousa
 
Recognizing the Patterns Within: How Biomedical Data Can Reveal Health vs. Di...
Recognizing the Patterns Within: How Biomedical Data Can Reveal Health vs. Di...Recognizing the Patterns Within: How Biomedical Data Can Reveal Health vs. Di...
Recognizing the Patterns Within: How Biomedical Data Can Reveal Health vs. Di...Larry Smarr
 
00049 J Silva Research Profile Jpr 2006
00049 J Silva Research Profile Jpr 200600049 J Silva Research Profile Jpr 2006
00049 J Silva Research Profile Jpr 2006jcruzsilva
 

Similar to Segal (20)

Validation and reliability_of_the_stayhealthy_bc3_body_composition_analyzer_i...
Validation and reliability_of_the_stayhealthy_bc3_body_composition_analyzer_i...Validation and reliability_of_the_stayhealthy_bc3_body_composition_analyzer_i...
Validation and reliability_of_the_stayhealthy_bc3_body_composition_analyzer_i...
 
Twb children
Twb childrenTwb children
Twb children
 
1342.full
1342.full1342.full
1342.full
 
A04302001017
A04302001017A04302001017
A04302001017
 
A03120101015
A03120101015A03120101015
A03120101015
 
RBE of the MIT clinical epithermal neutron beam
RBE of the MIT clinical epithermal neutron beamRBE of the MIT clinical epithermal neutron beam
RBE of the MIT clinical epithermal neutron beam
 
Development and Validation of prediction for estimating resting energy expend...
Development and Validation of prediction for estimating resting energy expend...Development and Validation of prediction for estimating resting energy expend...
Development and Validation of prediction for estimating resting energy expend...
 
Ffm formula
Ffm formulaFfm formula
Ffm formula
 
Avida Ed Research Presentation
Avida Ed Research PresentationAvida Ed Research Presentation
Avida Ed Research Presentation
 
ESO system, ES-BC system and EIS-GS system - Miami University study
ESO system, ES-BC system and EIS-GS system - Miami University study ESO system, ES-BC system and EIS-GS system - Miami University study
ESO system, ES-BC system and EIS-GS system - Miami University study
 
Hormônios menstruais x lassidão lca
Hormônios menstruais x lassidão lcaHormônios menstruais x lassidão lca
Hormônios menstruais x lassidão lca
 
Lafont proteins 2007
Lafont proteins 2007Lafont proteins 2007
Lafont proteins 2007
 
The Assembly, Structure and Activation of Influenza a M2 Transmembrane Domain...
The Assembly, Structure and Activation of Influenza a M2 Transmembrane Domain...The Assembly, Structure and Activation of Influenza a M2 Transmembrane Domain...
The Assembly, Structure and Activation of Influenza a M2 Transmembrane Domain...
 
dual-event machine learning models to accelerate drug discovery
dual-event machine learning models to accelerate drug discoverydual-event machine learning models to accelerate drug discovery
dual-event machine learning models to accelerate drug discovery
 
A New Platform for Combining the ‘Bottom-Up’ PBPK Paradigm and POPPK Data Ana...
A New Platform for Combining the ‘Bottom-Up’ PBPK Paradigm and POPPK Data Ana...A New Platform for Combining the ‘Bottom-Up’ PBPK Paradigm and POPPK Data Ana...
A New Platform for Combining the ‘Bottom-Up’ PBPK Paradigm and POPPK Data Ana...
 
Cargas baixas e altas-adaptações-ao-trein0-de-força-schoenfeld2017.pdf
Cargas baixas e altas-adaptações-ao-trein0-de-força-schoenfeld2017.pdfCargas baixas e altas-adaptações-ao-trein0-de-força-schoenfeld2017.pdf
Cargas baixas e altas-adaptações-ao-trein0-de-força-schoenfeld2017.pdf
 
Sarcopenia and Vitamin D
Sarcopenia and Vitamin DSarcopenia and Vitamin D
Sarcopenia and Vitamin D
 
CUN-BAE PDF
CUN-BAE PDFCUN-BAE PDF
CUN-BAE PDF
 
Recognizing the Patterns Within: How Biomedical Data Can Reveal Health vs. Di...
Recognizing the Patterns Within: How Biomedical Data Can Reveal Health vs. Di...Recognizing the Patterns Within: How Biomedical Data Can Reveal Health vs. Di...
Recognizing the Patterns Within: How Biomedical Data Can Reveal Health vs. Di...
 
00049 J Silva Research Profile Jpr 2006
00049 J Silva Research Profile Jpr 200600049 J Silva Research Profile Jpr 2006
00049 J Silva Research Profile Jpr 2006
 

More from ES-Teck India

EIS Technology: New marker using bioimpedance technology in screening for ADHD
EIS Technology: New marker using bioimpedance technology in screening for ADHDEIS Technology: New marker using bioimpedance technology in screening for ADHD
EIS Technology: New marker using bioimpedance technology in screening for ADHDES-Teck India
 
EIS Technology: bioimpedance chronoamperometry in adjunct to screen the prost...
EIS Technology: bioimpedance chronoamperometry in adjunct to screen the prost...EIS Technology: bioimpedance chronoamperometry in adjunct to screen the prost...
EIS Technology: bioimpedance chronoamperometry in adjunct to screen the prost...ES-Teck India
 
Summary of clinical investigations es teck complex system
Summary of clinical investigations es teck complex systemSummary of clinical investigations es teck complex system
Summary of clinical investigations es teck complex systemES-Teck India
 
Pulse wave reflection
Pulse wave reflectionPulse wave reflection
Pulse wave reflectionES-Teck India
 
Ptg and cardiac output.jsp
Ptg and cardiac output.jspPtg and cardiac output.jsp
Ptg and cardiac output.jspES-Teck India
 
Guidelines heart rate_variability_ft_1996[1]
Guidelines heart rate_variability_ft_1996[1]Guidelines heart rate_variability_ft_1996[1]
Guidelines heart rate_variability_ft_1996[1]ES-Teck India
 
Arterioscler thromb vasc_biol_22_147
Arterioscler thromb vasc_biol_22_147Arterioscler thromb vasc_biol_22_147
Arterioscler thromb vasc_biol_22_147ES-Teck India
 
Serotonin ssri effects
Serotonin ssri effectsSerotonin ssri effects
Serotonin ssri effectsES-Teck India
 
Serotonin and blood flow
Serotonin and blood flowSerotonin and blood flow
Serotonin and blood flowES-Teck India
 
Dopamine and ischemia
Dopamine and ischemiaDopamine and ischemia
Dopamine and ischemiaES-Teck India
 

More from ES-Teck India (20)

EIS Technology: New marker using bioimpedance technology in screening for ADHD
EIS Technology: New marker using bioimpedance technology in screening for ADHDEIS Technology: New marker using bioimpedance technology in screening for ADHD
EIS Technology: New marker using bioimpedance technology in screening for ADHD
 
Es teck india
Es teck indiaEs teck india
Es teck india
 
EIS Technology: bioimpedance chronoamperometry in adjunct to screen the prost...
EIS Technology: bioimpedance chronoamperometry in adjunct to screen the prost...EIS Technology: bioimpedance chronoamperometry in adjunct to screen the prost...
EIS Technology: bioimpedance chronoamperometry in adjunct to screen the prost...
 
Summary of clinical investigations es teck complex system
Summary of clinical investigations es teck complex systemSummary of clinical investigations es teck complex system
Summary of clinical investigations es teck complex system
 
Stptg 4
Stptg 4Stptg 4
Stptg 4
 
Stptg 2
Stptg 2Stptg 2
Stptg 2
 
Sdptg1
Sdptg1Sdptg1
Sdptg1
 
Pulseox[1]
Pulseox[1]Pulseox[1]
Pulseox[1]
 
Pulse wave reflection
Pulse wave reflectionPulse wave reflection
Pulse wave reflection
 
Pulse wave indice
Pulse wave indicePulse wave indice
Pulse wave indice
 
Pulse wave analysis
Pulse wave analysisPulse wave analysis
Pulse wave analysis
 
Ptg and cardiac output.jsp
Ptg and cardiac output.jspPtg and cardiac output.jsp
Ptg and cardiac output.jsp
 
Guidelines heart rate_variability_ft_1996[1]
Guidelines heart rate_variability_ft_1996[1]Guidelines heart rate_variability_ft_1996[1]
Guidelines heart rate_variability_ft_1996[1]
 
Arterioscler thromb vasc_biol_22_147
Arterioscler thromb vasc_biol_22_147Arterioscler thromb vasc_biol_22_147
Arterioscler thromb vasc_biol_22_147
 
About pulseoximetry
About pulseoximetryAbout pulseoximetry
About pulseoximetry
 
Serotonin ssri effects
Serotonin ssri effectsSerotonin ssri effects
Serotonin ssri effects
 
Serotonin and blood flow
Serotonin and blood flowSerotonin and blood flow
Serotonin and blood flow
 
Fat mass and leptin
Fat mass and leptinFat mass and leptin
Fat mass and leptin
 
Dopamine
DopamineDopamine
Dopamine
 
Dopamine and ischemia
Dopamine and ischemiaDopamine and ischemia
Dopamine and ischemia
 

Recently uploaded

Jogeshwari ! Call Girls Service Mumbai - 450+ Call Girl Cash Payment 90042684...
Jogeshwari ! Call Girls Service Mumbai - 450+ Call Girl Cash Payment 90042684...Jogeshwari ! Call Girls Service Mumbai - 450+ Call Girl Cash Payment 90042684...
Jogeshwari ! Call Girls Service Mumbai - 450+ Call Girl Cash Payment 90042684...Anamika Rawat
 
Premium Bangalore Call Girls Jigani Dail 6378878445 Escort Service For Hot Ma...
Premium Bangalore Call Girls Jigani Dail 6378878445 Escort Service For Hot Ma...Premium Bangalore Call Girls Jigani Dail 6378878445 Escort Service For Hot Ma...
Premium Bangalore Call Girls Jigani Dail 6378878445 Escort Service For Hot Ma...tanya dube
 
All Time Service Available Call Girls Marine Drive 📳 9820252231 For 18+ VIP C...
All Time Service Available Call Girls Marine Drive 📳 9820252231 For 18+ VIP C...All Time Service Available Call Girls Marine Drive 📳 9820252231 For 18+ VIP C...
All Time Service Available Call Girls Marine Drive 📳 9820252231 For 18+ VIP C...Arohi Goyal
 
Call Girls Raipur Just Call 9630942363 Top Class Call Girl Service Available
Call Girls Raipur Just Call 9630942363 Top Class Call Girl Service AvailableCall Girls Raipur Just Call 9630942363 Top Class Call Girl Service Available
Call Girls Raipur Just Call 9630942363 Top Class Call Girl Service AvailableGENUINE ESCORT AGENCY
 
Call Girls Rishikesh Just Call 9667172968 Top Class Call Girl Service Available
Call Girls Rishikesh Just Call 9667172968 Top Class Call Girl Service AvailableCall Girls Rishikesh Just Call 9667172968 Top Class Call Girl Service Available
Call Girls Rishikesh Just Call 9667172968 Top Class Call Girl Service Availableperfect solution
 
Model Call Girls In Chennai WhatsApp Booking 7427069034 call girl service 24 ...
Model Call Girls In Chennai WhatsApp Booking 7427069034 call girl service 24 ...Model Call Girls In Chennai WhatsApp Booking 7427069034 call girl service 24 ...
Model Call Girls In Chennai WhatsApp Booking 7427069034 call girl service 24 ...hotbabesbook
 
Coimbatore Call Girls in Thudiyalur : 7427069034 High Profile Model Escorts |...
Coimbatore Call Girls in Thudiyalur : 7427069034 High Profile Model Escorts |...Coimbatore Call Girls in Thudiyalur : 7427069034 High Profile Model Escorts |...
Coimbatore Call Girls in Thudiyalur : 7427069034 High Profile Model Escorts |...chennailover
 
💕SONAM KUMAR💕Premium Call Girls Jaipur ↘️9257276172 ↙️One Night Stand With Lo...
💕SONAM KUMAR💕Premium Call Girls Jaipur ↘️9257276172 ↙️One Night Stand With Lo...💕SONAM KUMAR💕Premium Call Girls Jaipur ↘️9257276172 ↙️One Night Stand With Lo...
💕SONAM KUMAR💕Premium Call Girls Jaipur ↘️9257276172 ↙️One Night Stand With Lo...khalifaescort01
 
Low Rate Call Girls Bangalore {7304373326} ❤️VVIP NISHA Call Girls in Bangalo...
Low Rate Call Girls Bangalore {7304373326} ❤️VVIP NISHA Call Girls in Bangalo...Low Rate Call Girls Bangalore {7304373326} ❤️VVIP NISHA Call Girls in Bangalo...
Low Rate Call Girls Bangalore {7304373326} ❤️VVIP NISHA Call Girls in Bangalo...Sheetaleventcompany
 
Andheri East ) Call Girls in Mumbai Phone No 9004268417 Elite Escort Service ...
Andheri East ) Call Girls in Mumbai Phone No 9004268417 Elite Escort Service ...Andheri East ) Call Girls in Mumbai Phone No 9004268417 Elite Escort Service ...
Andheri East ) Call Girls in Mumbai Phone No 9004268417 Elite Escort Service ...Anamika Rawat
 
Independent Call Girls In Jaipur { 8445551418 } ✔ ANIKA MEHTA ✔ Get High Prof...
Independent Call Girls In Jaipur { 8445551418 } ✔ ANIKA MEHTA ✔ Get High Prof...Independent Call Girls In Jaipur { 8445551418 } ✔ ANIKA MEHTA ✔ Get High Prof...
Independent Call Girls In Jaipur { 8445551418 } ✔ ANIKA MEHTA ✔ Get High Prof...parulsinha
 
8980367676 Call Girls In Ahmedabad Escort Service Available 24×7 In Ahmedabad
8980367676 Call Girls In Ahmedabad Escort Service Available 24×7 In Ahmedabad8980367676 Call Girls In Ahmedabad Escort Service Available 24×7 In Ahmedabad
8980367676 Call Girls In Ahmedabad Escort Service Available 24×7 In AhmedabadGENUINE ESCORT AGENCY
 
Best Rate (Guwahati ) Call Girls Guwahati ⟟ 8617370543 ⟟ High Class Call Girl...
Best Rate (Guwahati ) Call Girls Guwahati ⟟ 8617370543 ⟟ High Class Call Girl...Best Rate (Guwahati ) Call Girls Guwahati ⟟ 8617370543 ⟟ High Class Call Girl...
Best Rate (Guwahati ) Call Girls Guwahati ⟟ 8617370543 ⟟ High Class Call Girl...Dipal Arora
 
Call Girls Rishikesh Just Call 8250077686 Top Class Call Girl Service Available
Call Girls Rishikesh Just Call 8250077686 Top Class Call Girl Service AvailableCall Girls Rishikesh Just Call 8250077686 Top Class Call Girl Service Available
Call Girls Rishikesh Just Call 8250077686 Top Class Call Girl Service AvailableDipal Arora
 
Call Girls Service Jaipur {8445551418} ❤️VVIP BHAWNA Call Girl in Jaipur Raja...
Call Girls Service Jaipur {8445551418} ❤️VVIP BHAWNA Call Girl in Jaipur Raja...Call Girls Service Jaipur {8445551418} ❤️VVIP BHAWNA Call Girl in Jaipur Raja...
Call Girls Service Jaipur {8445551418} ❤️VVIP BHAWNA Call Girl in Jaipur Raja...parulsinha
 
Call Girls in Delhi Triveni Complex Escort Service(🔝))/WhatsApp 97111⇛47426
Call Girls in Delhi Triveni Complex Escort Service(🔝))/WhatsApp 97111⇛47426Call Girls in Delhi Triveni Complex Escort Service(🔝))/WhatsApp 97111⇛47426
Call Girls in Delhi Triveni Complex Escort Service(🔝))/WhatsApp 97111⇛47426jennyeacort
 
Top Rated Hyderabad Call Girls Erragadda ⟟ 9332606886 ⟟ Call Me For Genuine ...
Top Rated  Hyderabad Call Girls Erragadda ⟟ 9332606886 ⟟ Call Me For Genuine ...Top Rated  Hyderabad Call Girls Erragadda ⟟ 9332606886 ⟟ Call Me For Genuine ...
Top Rated Hyderabad Call Girls Erragadda ⟟ 9332606886 ⟟ Call Me For Genuine ...chandars293
 
Call Girl In Pune 👉 Just CALL ME: 9352988975 💋 Call Out Call Both With High p...
Call Girl In Pune 👉 Just CALL ME: 9352988975 💋 Call Out Call Both With High p...Call Girl In Pune 👉 Just CALL ME: 9352988975 💋 Call Out Call Both With High p...
Call Girl In Pune 👉 Just CALL ME: 9352988975 💋 Call Out Call Both With High p...chetankumar9855
 
Best Rate (Patna ) Call Girls Patna ⟟ 8617370543 ⟟ High Class Call Girl In 5 ...
Best Rate (Patna ) Call Girls Patna ⟟ 8617370543 ⟟ High Class Call Girl In 5 ...Best Rate (Patna ) Call Girls Patna ⟟ 8617370543 ⟟ High Class Call Girl In 5 ...
Best Rate (Patna ) Call Girls Patna ⟟ 8617370543 ⟟ High Class Call Girl In 5 ...Dipal Arora
 
Call Girl in Indore 8827247818 {LowPrice} ❤️ (ahana) Indore Call Girls * UPA...
Call Girl in Indore 8827247818 {LowPrice} ❤️ (ahana) Indore Call Girls  * UPA...Call Girl in Indore 8827247818 {LowPrice} ❤️ (ahana) Indore Call Girls  * UPA...
Call Girl in Indore 8827247818 {LowPrice} ❤️ (ahana) Indore Call Girls * UPA...mahaiklolahd
 

Recently uploaded (20)

Jogeshwari ! Call Girls Service Mumbai - 450+ Call Girl Cash Payment 90042684...
Jogeshwari ! Call Girls Service Mumbai - 450+ Call Girl Cash Payment 90042684...Jogeshwari ! Call Girls Service Mumbai - 450+ Call Girl Cash Payment 90042684...
Jogeshwari ! Call Girls Service Mumbai - 450+ Call Girl Cash Payment 90042684...
 
Premium Bangalore Call Girls Jigani Dail 6378878445 Escort Service For Hot Ma...
Premium Bangalore Call Girls Jigani Dail 6378878445 Escort Service For Hot Ma...Premium Bangalore Call Girls Jigani Dail 6378878445 Escort Service For Hot Ma...
Premium Bangalore Call Girls Jigani Dail 6378878445 Escort Service For Hot Ma...
 
All Time Service Available Call Girls Marine Drive 📳 9820252231 For 18+ VIP C...
All Time Service Available Call Girls Marine Drive 📳 9820252231 For 18+ VIP C...All Time Service Available Call Girls Marine Drive 📳 9820252231 For 18+ VIP C...
All Time Service Available Call Girls Marine Drive 📳 9820252231 For 18+ VIP C...
 
Call Girls Raipur Just Call 9630942363 Top Class Call Girl Service Available
Call Girls Raipur Just Call 9630942363 Top Class Call Girl Service AvailableCall Girls Raipur Just Call 9630942363 Top Class Call Girl Service Available
Call Girls Raipur Just Call 9630942363 Top Class Call Girl Service Available
 
Call Girls Rishikesh Just Call 9667172968 Top Class Call Girl Service Available
Call Girls Rishikesh Just Call 9667172968 Top Class Call Girl Service AvailableCall Girls Rishikesh Just Call 9667172968 Top Class Call Girl Service Available
Call Girls Rishikesh Just Call 9667172968 Top Class Call Girl Service Available
 
Model Call Girls In Chennai WhatsApp Booking 7427069034 call girl service 24 ...
Model Call Girls In Chennai WhatsApp Booking 7427069034 call girl service 24 ...Model Call Girls In Chennai WhatsApp Booking 7427069034 call girl service 24 ...
Model Call Girls In Chennai WhatsApp Booking 7427069034 call girl service 24 ...
 
Coimbatore Call Girls in Thudiyalur : 7427069034 High Profile Model Escorts |...
Coimbatore Call Girls in Thudiyalur : 7427069034 High Profile Model Escorts |...Coimbatore Call Girls in Thudiyalur : 7427069034 High Profile Model Escorts |...
Coimbatore Call Girls in Thudiyalur : 7427069034 High Profile Model Escorts |...
 
💕SONAM KUMAR💕Premium Call Girls Jaipur ↘️9257276172 ↙️One Night Stand With Lo...
💕SONAM KUMAR💕Premium Call Girls Jaipur ↘️9257276172 ↙️One Night Stand With Lo...💕SONAM KUMAR💕Premium Call Girls Jaipur ↘️9257276172 ↙️One Night Stand With Lo...
💕SONAM KUMAR💕Premium Call Girls Jaipur ↘️9257276172 ↙️One Night Stand With Lo...
 
Low Rate Call Girls Bangalore {7304373326} ❤️VVIP NISHA Call Girls in Bangalo...
Low Rate Call Girls Bangalore {7304373326} ❤️VVIP NISHA Call Girls in Bangalo...Low Rate Call Girls Bangalore {7304373326} ❤️VVIP NISHA Call Girls in Bangalo...
Low Rate Call Girls Bangalore {7304373326} ❤️VVIP NISHA Call Girls in Bangalo...
 
Andheri East ) Call Girls in Mumbai Phone No 9004268417 Elite Escort Service ...
Andheri East ) Call Girls in Mumbai Phone No 9004268417 Elite Escort Service ...Andheri East ) Call Girls in Mumbai Phone No 9004268417 Elite Escort Service ...
Andheri East ) Call Girls in Mumbai Phone No 9004268417 Elite Escort Service ...
 
Independent Call Girls In Jaipur { 8445551418 } ✔ ANIKA MEHTA ✔ Get High Prof...
Independent Call Girls In Jaipur { 8445551418 } ✔ ANIKA MEHTA ✔ Get High Prof...Independent Call Girls In Jaipur { 8445551418 } ✔ ANIKA MEHTA ✔ Get High Prof...
Independent Call Girls In Jaipur { 8445551418 } ✔ ANIKA MEHTA ✔ Get High Prof...
 
8980367676 Call Girls In Ahmedabad Escort Service Available 24×7 In Ahmedabad
8980367676 Call Girls In Ahmedabad Escort Service Available 24×7 In Ahmedabad8980367676 Call Girls In Ahmedabad Escort Service Available 24×7 In Ahmedabad
8980367676 Call Girls In Ahmedabad Escort Service Available 24×7 In Ahmedabad
 
Best Rate (Guwahati ) Call Girls Guwahati ⟟ 8617370543 ⟟ High Class Call Girl...
Best Rate (Guwahati ) Call Girls Guwahati ⟟ 8617370543 ⟟ High Class Call Girl...Best Rate (Guwahati ) Call Girls Guwahati ⟟ 8617370543 ⟟ High Class Call Girl...
Best Rate (Guwahati ) Call Girls Guwahati ⟟ 8617370543 ⟟ High Class Call Girl...
 
Call Girls Rishikesh Just Call 8250077686 Top Class Call Girl Service Available
Call Girls Rishikesh Just Call 8250077686 Top Class Call Girl Service AvailableCall Girls Rishikesh Just Call 8250077686 Top Class Call Girl Service Available
Call Girls Rishikesh Just Call 8250077686 Top Class Call Girl Service Available
 
Call Girls Service Jaipur {8445551418} ❤️VVIP BHAWNA Call Girl in Jaipur Raja...
Call Girls Service Jaipur {8445551418} ❤️VVIP BHAWNA Call Girl in Jaipur Raja...Call Girls Service Jaipur {8445551418} ❤️VVIP BHAWNA Call Girl in Jaipur Raja...
Call Girls Service Jaipur {8445551418} ❤️VVIP BHAWNA Call Girl in Jaipur Raja...
 
Call Girls in Delhi Triveni Complex Escort Service(🔝))/WhatsApp 97111⇛47426
Call Girls in Delhi Triveni Complex Escort Service(🔝))/WhatsApp 97111⇛47426Call Girls in Delhi Triveni Complex Escort Service(🔝))/WhatsApp 97111⇛47426
Call Girls in Delhi Triveni Complex Escort Service(🔝))/WhatsApp 97111⇛47426
 
Top Rated Hyderabad Call Girls Erragadda ⟟ 9332606886 ⟟ Call Me For Genuine ...
Top Rated  Hyderabad Call Girls Erragadda ⟟ 9332606886 ⟟ Call Me For Genuine ...Top Rated  Hyderabad Call Girls Erragadda ⟟ 9332606886 ⟟ Call Me For Genuine ...
Top Rated Hyderabad Call Girls Erragadda ⟟ 9332606886 ⟟ Call Me For Genuine ...
 
Call Girl In Pune 👉 Just CALL ME: 9352988975 💋 Call Out Call Both With High p...
Call Girl In Pune 👉 Just CALL ME: 9352988975 💋 Call Out Call Both With High p...Call Girl In Pune 👉 Just CALL ME: 9352988975 💋 Call Out Call Both With High p...
Call Girl In Pune 👉 Just CALL ME: 9352988975 💋 Call Out Call Both With High p...
 
Best Rate (Patna ) Call Girls Patna ⟟ 8617370543 ⟟ High Class Call Girl In 5 ...
Best Rate (Patna ) Call Girls Patna ⟟ 8617370543 ⟟ High Class Call Girl In 5 ...Best Rate (Patna ) Call Girls Patna ⟟ 8617370543 ⟟ High Class Call Girl In 5 ...
Best Rate (Patna ) Call Girls Patna ⟟ 8617370543 ⟟ High Class Call Girl In 5 ...
 
Call Girl in Indore 8827247818 {LowPrice} ❤️ (ahana) Indore Call Girls * UPA...
Call Girl in Indore 8827247818 {LowPrice} ❤️ (ahana) Indore Call Girls  * UPA...Call Girl in Indore 8827247818 {LowPrice} ❤️ (ahana) Indore Call Girls  * UPA...
Call Girl in Indore 8827247818 {LowPrice} ❤️ (ahana) Indore Call Girls * UPA...
 

Segal

  • 1. Original Research Communications-general Lean body mass estimation by bioelectrical impedance analysis: a four-site cross-Validation study13 Karen R Segal, EdD; Marta Van Loan, PhD; Patricia I Fitzgerald, PhD; James A Hodgdon, PhD; and Theodore B Van Itaiie, MD ABSTRACT This study validated further the bioelectrical impedance analysis (BIA) method for body composition estimation. At four laboratories densitometrically-determined lean body mass (LBMd) was compared with BIA in 1567 adults (1069 men, 498 women) aged 17-62 y and with body fat. Equations 3-56% for predicting LBMd from resistance measured by BIA, height2, weight, and age were obtained for the men and women. Application of each equation to the data from the other labs yielded small reductions in R values and small increases in SEES. Some regression coefficients differed among labs but these differences were eliminated after adjustment for differences among labs in the subjects’ body fatness. All data were pooled to LBMd: the resulting R values ranged from 0.907 Downloaded from www.ajcn.org by on January 11, 2008 derive fatness-specific equations for predicting to 0.952 with SEES of 1.97-3.03 kg. These results confirm the validity of BIA and indicate that the precision of predicting LBM from impedance can be enhanced by sex- and fatness-specific equations. AmfClinNutr l988;47:7-l4. KEY WORDS Body composition, densitometry, bioelectrical impedance analysis, lean body mass Infroduction sites in large samples of men and women who vary widely in age and body fat content. The use of bioelectrical impedance analysis (BIA) in body composition assessment has been investigated re- cently. BIA, a portable impedance analyzer (RJL Systems, Subjects and methods Detroit, MI), is a localized 50-kHz current-injection Subjects method that yields a measure of total body resistivity. Fifteen hundred sixty-seven subjects (1069 men, 498 women) The method is based on the principle that impedance to aged 17-62 y were studied in four laboratories located in four the electrical flow of an injected current is related to the different cities in the United States: San Francisco, CA (lab A); volume ofa conductor (the human body) and the square New York, NY (lab B); Natick, MA (lab C); and San Diego, CA of the length of the conductor (height). Hoffer et al (1) demonstrated that total body water (TBW) and lean body mass (LBM) were strongly correlated with height2/resis- I From the Division of Pediatric Cardiology (KRS), Mount Sinai tance, where body resistivity or impedance was measured School ofMedicine, New York, NY; the US Dept of Agriculture (MVL), with a tetrapolar electrode configuration. Western Human Nutrition Research Center, San Francisco, CA; the US Several recent studies (2-4) demonstrated strong cor- Army Research Institute ofEnvironmental Medicine (PIF), Natick, MA; relations between BIA (either height2/resistance measured the Naval Health Research Center(JAH), San Diego, CA; and the Obesity with BIA or LBM and TBW predicted from BIA with use Research Center (TBVI), St. Luke’s-Roosevelt Hospital Center, New of equations provided by the manufacturer) and TBW York, NY. 2 Supported in part by grants from the National Institutes of Arthritis, measured by isotope dilution and densitometrically de- Diabetes, and Digestive and Kidney Diseases (grant #AM-26687) and termined LBM. However, these studies have usually made by the Naval Medical Research and Development Command (work unit use of small or heterogeneous samples, and the repro- #M0096.OOl-1050). ducibility of the method between laboratories has not been 3 Address reprint requests to Dr Karen R Segal, Annenberg 3-45, determined by means of cross-validation studies. Mount Sinai School ofMedicine, Box 1201, 1 Gustave Levy Place, New The purpose of this study is to cross-validate the BIA York, NY 10029. method by comparing the relationship between BIA and Receivedianuary 12, 1987. densitometrically determined LBM at four geographical Accepted for publication March 24, 1987. Am J Clin Nuir l988;47:7-14. Printed in USA. © 1988 American Society for Clinical Nutrition 7
  • 2. SEGAL ET AL (lab D). After all experimental procedures were explained to the tions to predict densitometrically determined LBM (LBMd) for subjects their written informed consent was obtained. The test each sample. Resistance, reactance, height2/resistance, weight, protocol was reviewed and approved by the institutional review height2, age, and sex (dummy coded with males, = 0, females board at each of the participating institutions. Each subject = 1) were offered as possible predictors. LBMd was used as the completed all measurementS on the same morning. Most of the dependent variable. The regressions were carried out in stepwise subjects were studied after an overnight (12 h) fast and those fashion. Before pooling the data from males and females, the who were not tested after an overnight fast were at least 3 h equality of the slopes for males and females was tested for sta- postabsorptive. tistical significance (1 1). A quadruple cross-validation of the equations for predicting Densitometry LBMd from BIA was carried out according to the procedure Body fat content and LBM were determined by densitometry. described by Lord and Novick (12): the best-fitting equation At lab B, body density was determined by hydrostatic weighing derived from each data set was applied to the other three data in a stainless steel tank in which a swing seat was suspended sets. For each data set statistical significance ofthe deviation of from a Chatillon 15-kg scale (Chatillon, New York, NY). At the regression of LBMd on LBM, cross-predicted with use of labs A, C, and D, the underwater weighing systems were mod- the equations derived from the other three laboratories, from ifications ofthe method ofAkers and Buskirk (5), which makes the line of identity was tested. This procedure was followed to use of force transducers. The subjects submerged beneath the test the significance of differences in the best-fitting regression surface of the water while expiring maximally and remained as lines among laboratories (1 1). motionless as possible at the point of maximal expiration for Additional statistical analyses ofthe data are described in the , 5 5 while underwater weight was recorded. After several prac- results section. The 0.05 level of significance was used for all tice trials to familiarize the subjects with the test procedure, 10 data analyses. Downloaded from www.ajcn.org by on January 11, 2008 trials were performed except in lab A where only 4 trials were performed. The estimated underwater weight was the highest Results value that was reproduced three times (6). In labs A, B, and C residual lung volume was estimated by means of the closed- The characteristics of the subjects are shown in Table circuit oxygen dilution method of Wilmore (7) with use of a I The population . varied widely with respect to age and Collins spirometer (Warren E Collins, Braintree, MA) and a body composition. The same predictor variables were se- Hewlett Packard Model 47302A (Hewlett-Packard, Cupertino, lected by the stepwise regression procedure in all four sets CA) or a Med-Science Model 505D nitrogen analyzer (Fiske Med-Science, St Louis, MO). In lab D, residual volume was of data: R, ht2, wt, age, and sex. The data from the men measured by the closed-circuit helium dilution method (8) with and women were treated separately because the regression use of a Collins Model 3002 modular lung analyzer (Warren E coefficients ofthe best-fitting regression lines were signif- Collins). In labs B, C, and D, two trials were performed while icantly different for men and women. The best-fitting the subjects assumed a sitting position that duplicated body po- equations for each laboratory are shown in Table 2. Re- sition in the tank during underwater weighing. Residual volume sistance and height2, individually, were better predictors at lab A was measured in the water at the time ofthe underwater of LBMd than the calculated height2/resistance, as deter- weighing. Body density was calculated from the formula of mined by greater correlation coefficients and smaller SEES. Goldman and Buskirk (9) and percent body fat was derived The residuals were analyzed and found to be randomly from body density by use ofthe Siri equation (10): percent body fat = (4.95/density) - 4.5. LBM is the difference between total body weight and fat weight, where fat weight equals total body weight multiplied by percent body fat. TABLE 1 Characteristics of the subjects (mean ± SD) Bioe!ectrical impedance analysis LabA LabB LabC LabD Total body resistivity was measured with a four-terminal por- (n = 96) (n = 99) (n = 490) (n = 404) table impedance analyzer (RJL Systems, Detroit, MI). Mea- surements were made while the subjects lay comfortably on a Men stretcher with the limbs abducted from the body. Current-injector Age 32± 9 26± 8 34± 8 32± 7 electrodes were placed just below the phalangeral-metacarpal Weight(kg) 75±12 79±12 79±12 88±13 joint in the middle of the dorsal side of the right hand and just Height(cm) 178± 8 179± 7 175± 7 179± 7 below the transverse (metatarsal) arch on the superior side of LBM(kg)* 61± 8 66± 7 62± 8 67± 8 the right foot. Detector electrodes were placed on the posterior Percent fat 18 ± 7 16 ± 8 22 ± 7 23 ± 8 side of the right wrist, midline, with the prominent pisiform Resistance(Q) 485±63 459±47 442±55 432 ±49 bone on the medial (fifth phalangeal) side and ventrally across LabA LabB LabC LabD the medial ankle bone ofthe right ankle with the foot semiflexed. (n = 64) (n = 81) (n = 224) (n = 141) Resistance (R) to the flow ofa 50-kHz injected current was mea- sured on a 0- l000-( scale and reactance (Xc) was measured on Women a 0-20041 scale. Empirically derived formulas provided by the Age 35± 9 29±10 24± 5 27± 6 manufacturer of the instrument were used to calculate es- Weight(kg) 59± 8 71±23 61± 8 63± 9 timated LBM. Height(cm) 165± 8 165± 7 163± 6 164± 7 LBM (kg)* 43 ± 6 48 ± 7 44 ± 6 45 ± 5 Statistical analyses Percent fat* 27 ± 8 29 ± 12 28 ± 6 27 ± 8 Resistance(Q) 587±58 551±68 554±62 559±68 Multiple regression analyses were applied to the data from each laboratory to derive best-fitting multiple regression equa- S Determined from hydrodensitometry. LBM = lean body mass.
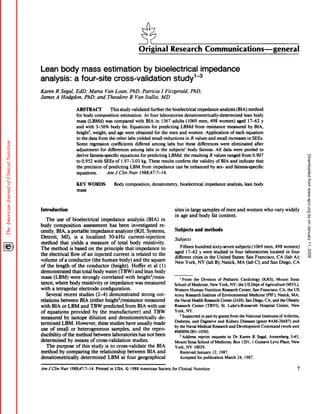
  • 3. LEAN BODY MASS ESTIMATION BY IMPEDANCE 9 TABLE 2 ofidentity. Reductions in the correlation coefficients and Best-fitting equations for predicting lean body mass for each lab and increases in the SEEs resulting from application of the all labs pooled equations derived at other laboratories compared with vnab1e Lab A Lab B Lab C Lab D All labs the best-fitting equations were minimal. However, as Men shown in Table 3, differences in regression equations were Height2 0.00109 0.00124 0.00122 0.00140 0.00132 found among some ofthe laboratories. For the men these Resistance -0.01607 -0.06626 -0.03736 -0.06336 -0.04394 differences were attributable to differences among the lab- Weight 0.41004 0.26261 0.31973 0.26079 0.30520 oratories in body fat content: The lab C and lab D men Age -0. 15407 -0.22776 -0.13038 -0. 15634 -0.16760 were significantly fatter than the lab A and lab B men. Intercept 8.14874 41.35041 19.77883 32.29519 22.66827 R 0.9$ I 0.907 0.882 0.896 0.898 When adjustment was made statistically for differences SEE 3.28 2.91 3.62 3.49 3.61 in body fat content among the four labs, differences among regression equations were eliminated. Specifically, LBMCI vuiable Lab A Lab B Lab C Lab D All Labs was regressed on body fat and residualized LBMd values Women were obtained. The residualized LBMd, purged of any Height2 0.00112 0.00114 0.000942 0.00103 0.00108 Resistance -0.03797 -0.02502 -0.01410 -0.02578 -0.02090 relationship with body fat, was used as the dependent Weight 0.21110 0.18856 0.31153 0.22280 0.23199 variable and stepwise regressions were carried out for each Age -0. 12953 -0.06498 -0. 14505 -0.01802 -0.06777 lab using resistance, height2, weight, and age as the in- Intercept 27.16729 19.25955 10.91436 18.29870 14.59453 dependent variables. The resulting regression equations R 0.891 0.942 0.876 0.861 0.889 were analyzed for statistical differences among labs. For SEE 2.51 2.31 2.15 2.42 2.43 Downloaded from www.ajcn.org by on January 11, 2008 both men and women (even though the differences among labs in the women’s body fat did not achieve statistical significance) no statistical differences among labs in the distributed and were uncorrelated with the predicted LBM regression coefficients were obtained when this adjustment values. for body fat was made. This confounding effect of body fatness on the prediction of LBMd supports a previous Quadruple cross-validation finding that the error in predicting LBMd from BIA was significantly related to obesity (4). The quadruple cross-validation of the equations for The relationship between LBM predicted from height2, predicting LBMd is shown in Table 3. The purpose of the resistance, weight, and age and LBMd for men and women quadruple cross-validation was to determine the repro- (all labs pooled but separate equations for men and ducibility across laboratories of the relationship between women) is shown in Figures 1 and 2. When the data are LBMd and LBM predicted from BIA and other variables. expressed as percent body fat, the correlations between LBMd was regressed on LBM predicted by each of the densitometrically determined percent body fat and pre- equations in order to determine whether the slopes and dicted percent body fat are r = 0.809 and r = 0.852 for intercepts differed from 1 and 0, respectively, indicating men and women, respectively, with SEEs of4.44% fat for that the regression lines differed significantly from the line men and 3.98% fat for women. TABLE 3 Quadruple cross-validation ofequations for predicting lean body mass (LBM): correlations (and SEE) between densitometrically determined LBM (LBMd) and LBM predicted by best-fitting equation from each lab and all labs pooled LabA LabB LabC LabD Men LBM (lab A equation) 0.911 (3.23) 0.854 (3.54)t 0.872 (3.75) 0.854 (4.08)ff LBM (lab B equation) 0.832 (4.34)t1 0.907 (2.86) 0.860 (3.92)tf 0.892 (3.54) LBM (lab C equation) 0.896 (3.47) 0.883 (3. 19) 0.882 (3.61) 0.884 (3.66) LBM (lab D equation) 0.853 (4.09)ff 0.902 (2.94) 0.871 (3.77)t 0.896 (3.48) LBM (all labs equation) 0.886 (3.62) 0.893 (3.06) 0.88 1 (3.63) 0.889 (3.58) LabA L.abB LabC LabD Women LBM (lab A equation) 0.891 (2.45) 0.936 (2.38)tf 0.834 (2.45)tt 0.841 (2.55)tf LBM (lab B equation) 0.878 (2.58) 0.942 (2.27) 0.854 (2.30) 0.856 (2.44) LBM (lab C equation) 0.859 (2.76) 0.932 (2.44)ff 0.876 (2.15) 0.832 (2.62) LBM (lab D equation) 0.868 (2.68) 0.936 (2.38)ff 0.853 (2.32) 0.861 (2.40) LBM (all labs equation) 0.872 (2.64) 0.940 (2.30) 0.866 (2.22) 0.856 (2.44) S Best-fitting results for each lab are indicated by italics. t Intercept significantly different from 0; p < 0.05. :l:Slope significantly different from 1; p < 0.05.
  • 4. SEGAL ET AL 90 and vice versa were significantly different from LBMd 000 5 0 (Table 6). DO DO C 0 0 D*C* C Figures 3 and 4 show the relationship between LBMd CC0O* 0* 0 0 80- O ODD 0 0 and LBM predicted with use of the fatness-specific equa- *000*CDS 11 CS *0000000*C *0000000000 C * tions. The dispersion ofdata points is considerably smaller DDDO000000000* DO than when the generalized equations were applied (Figs 0’ 70- * *A000IHSO*ODCDO* DSS0N*0000000 C #{149}000000000000*OC 1 and 2). For men, the R value increased from 0.896 to C CC00000000* CC* A 00*0*0*00*000 0.938 and the SEE decreased from 3.62 to 2.84 kg with SI A 0*110000000S0* * E 60- *CC*0*00000*0* use of fatness-specific equations. For women, the multiple 0 *DC00000CXOC000C SD CDA C000*000110 ACC0000000COC C C A I k A correlation coefficient R increased from 0.889 to 0.930 C 0 SI 5Q C ACAC0000COC ACC*D*AC B=LabB and the SEE decreased from 2.43 to 1.95 kg with use of CCC A C *CCC - - fatness-specific equations. For the men when the data are -J CCC DLabD expressed as percent body fat, the correlation between C C * = Multiple data 40 densitometrically determined and predicted percent body points fat increases from 0.809 to 0.896 and the SEE decreases C r.896 from 4.44% fat to 3.35% fat with use ofthe fatness-specific 30 SEE =3.62kg equations. For the women the correlation between den- I I I I sitometrically determined percent body fat and predicted .. 40 50 60 70 80 90 percent body fat increases from 0.852 to 0.909 and the Downloaded from www.ajcn.org by on January 11, 2008 LBM(BIA) (kg) SEE decreases from 3.98% fat to 3. 18% fat with use of the (Best fitting equation for all men) fatness-specific equations. The practical application of the fatness-specific equa- FIG 1. Relationship between densitometrically determined lean body tions is questionable since their use depends on prior mass (LBMd) and lean body mass (LBM) predicted from bioelectrical knowledge of an individual’s Further- body fat content. impedance analysis (BIA) and other indices with use of the best-fitting equation for the men in all four laboratories. more, the fatness-specific equations for predicting LBMd are the basis of categorizing the subjects with respect to densitometrically determined percent body fat, and it is important to note that percent fat and LBM are not truly Fatness-speafic prediction equations independent since both are derived from hydrodensitom- etry. Although for subjects who are obviously lean or obese Additional analyses were applied to the data to char- there would be no question as to which prediction is most acterize further the relationship between body fatness and appropriate, for subjects who are neither clearly lean nor the prediction of LBMd by BIA and to determine the appropriateness of fatness-specific equations. The total populations of men and women were divided randomly into two subsets for the purpose of cross-validation and each subset was divided into normal and obese groups 65- S S based on whether the subjects were less than or greater 55 than 20% and 30% body fat for men and women, respec- 60- S SB tively. For each of the two sets of normal and obese men 0’ S S A S and normal and obese women (total of eight subsets), an 55 - CD. 0 C DOD equation for predicting LBMd was derived. The same set *C *C* C O * *D*C*OSD S of variables (height2, resistance, weight, and age) entered SI E 50 - SCC #{149}0*0*00*SC *B** IHI C D 0 into all equations except that age did not enter into the *S**C*C*SCDS (I) C A***IHHI*** S equations for the two sets ofnormal women. The fatness- C **IHHI***C * A = Lab A . 45 - D *0*5*1155CC CD C specific equations and the cross-validation ofthese equa- C*****000**C B Lab B #{149} S*C*0000 SO C C = Lab C tions between the two randomly generated sets for each 40 - S*S**IIOOS*0C *005*5000CC 0 = Lab D -I sex and level of fatness are shown in Tables 4 and 5. Use C *B*DC*CDCC *C**CSCC 11 : Multiple data of these fatness-specific equations greatly improved the AACC *SC points 35 - #{149}CDC C accuracy of predicting LBMd: the multiple correlation CCC D r =889 coefficients were significantly increased and the SEES were SEE =2.43 kg 30 significantly reduced. No differences were found in the ii I I I I I I I I I regression coefficients between set 1 and set 2 of normal 30 40 50 60 70 men, obese men, normal women, or obese women, in- LBM(BIA) (kg) dicating the validity and reproducibility of fatness-specific equations (Table 5). However, significant differences were ( Bestfitting equation for all women) observed between the regression equations for the normal FIG 2. Relationship between densitometrically determined lean body and obese subjects for both men and women. Further- mass (LBMd) and lean body mass (LBM) predicted from bioelectrical more, the mean predicted LBM values obtained by ap- impedance analysis (BIA) and other indices with use of the best-fitting plying the normal group’s equations to the obese subjects equation for the women in all four laboratories.
  • 5. LEAN BODY MASS ESTIMATION BY IMPEDANCE 11 TABLE 4 Fatness-specific equations for predicting LBM Normal Obese SetI Set2 Setl Setl Set2 SetI Variable (n=244) (n=228) +set2 (n=295) (n=302) +set2 Men HCight 0.00060171 0.00071366 0.00066360 0.00072092 0.001020 0.00088580 Resistance -0.01959 -0.02319 -0.02 1 17 -0.0542 1 -0.08245 -0.02999 Weight 0.65940 0.59597 0.62854 0.48291 0.38179 0.42688 Age -0. 14244 -0. 10545 -0. 12380 -0.0542 1 -0.08245 -0.07002 Intercept 8.73968 10.64701 9.33285 11.48504 16.69512 14.52435 R 0.948 0.943 0.946 0.937 0.939 0.937 SEE 2.50 2.44 2.47 2.97 3.04 3.03 Normal Obese Seti Set2 SetI SetI Set2 Sell Variable (n= 146) (n= 177) +set2 (n=99) (n=76) +set2 Women Height2 0.00060098 0.00066464 0.00064602 0.000955 14 0.00077596 0.00091186 Downloaded from www.ajcn.org by on January 11, 2008 Resistance -0.018 17 -0.01 121 -0.01 397 -0.01420 -0.01 560 -0.01466 Weight 0.40328 0.43868 0.42087 0.3 1 134 0.282 16 0.29990 Age - - - -0.07187 -0.06215 -0.07012 Intercept 15.26646 7.18338 10.43485 7.47371 14.20227 9.37938 R 0.839 0.903 0.907 0.953 0.954 0.952 SEE 1.90 2.00 1.97 2.06 1.81 1.97 obese, there is a need for a technique to determine which pendent of densitometrically determined body fatness, prediction equation is most applicable. The validity of would significantly improve the prediction of LBMd, an fatness-specific equations for predicting LBMd requires a independent group ofsubjects was studied. These subjects method of categorizing subjects that is objective and in- (88 men, 72 women) underwent hydrostatic weighing, BIA dependent ofdensitometry. Body mass index (BMI), body measurement, and skinfold thickness measurements. surface area (BSA), and percent ofdesirable body weight Percent fat was derived body from the sum of the biceps, according to the 1959 Metropolitan Life Insurance stan- triceps, suprailiac crest, and subscapular skinfolds with dards (13) were tested as possible classification criteria. use of the tabled values of Durnin and Womersely (14). Classification of the subjects by these indices did not sig- The subjects were divided into normal and obese groups nificantly improve the prediction ofLBMd: categorization based on whether anthropometrically determined percent ofthe subjects according to whether they had a BMI less fat was less than or greater than 20% for men and less than or greater than 26, were below or above the 50th than or greater than 30% for women. Compared with percentile ofBSA for their sex, or were less than or greater densitometrically determined percent fat, 82 of 88 men than 120% of desirable body weight did not lead to sig- (93%) and 66 of 72 women (92%) were correctly catego- nificant increases in the multiple correlation coefficients rized with respect to their level of fatness. To determine or significant reductions in the SEEs. Each of these three the effectiveness of this classification, for each subgroup criteria also was tested as a continuous variable: in separate (normal and obese men, normal and obese women) LBMd analyses, each ofthe indices was entered forcibly into the was compared with LBM estimated with use of the gen- regression equation to predict LBMd at the first step, and eralized equations and LBM estimated with use of the height2, resistance, weight, and age were entered block- fatness-specific equations. These results are shown in wise at the second step (1 1). Separate analyses were carried Table 7. Use ofthe generalized BIA equations significantly out for men and women. The resulting correlations and underestimated LBMd for both the normal men and nor- SEEs were not significantly different from those obtained mal women. However, the question remained as to by use ofthe generalized equations derived from all men whether use of the BIA fatness-specific equations signifi- and all women (individually) pooled together (Figs 1 and cantly improved the prediction of LBMd over an- 2), indicating that BSA, BMI, and percent desirable body thropometry alone. To answer this question, LBM weight did not significantly improve the prediction of values (LBMa) were derived from anthropometrically- LBMd. determined percent body fat: weight - (weight X percent fat). LBMd was regressed on LBMa and LBM determined Use ofanthropometry to categorize subjects with use of the fatness-specific equations with LBMa en- To test whether categorization ofsubjects into two levels tered forcibly at the first step. The significance ofthe entry of fatness on the basis of anthropometry, which is inde- of LBM derived with the fatness-specific BIA equations
  • 6. SEGAL ET AL TABLES for men and from 2.63 to 2.09 kg for women). Thus, Cross-validation of fatness-specific equations for predicting lean body mass* anthropometrically determined percent fat can be used (LBM) reliably as the criterion for determining which fatness- specific BIA equation to apply. There is obviously no need Normal Normal All normal to prescreen subjects who are extremely lean or extremely seti set2 men obese. However, for subjects who are neither clearly lean Men nor obese, anthropometry may be useful in determining Normal men LBM (normal set I eq) 0.948 (2.50) 0.942 (2.45) - the optimal BIA prediction equation. It is important to LBM (normal set 2 eq) 0.947 (2.51) 0.943 (2.44) - note, however, that the fatness-specific BIA equations sig- LBM (obese men’s eq) - - 0.939 (2.60)t nificantly improve the prediction of LBMd over anthro- Obese Obese All obese pometry alone. sell set2 men Obese men Manufacturer’s prediction equation LBM (obese set 1 eq) 0.937 (2.97) 0.934 (.318) - LBM (obese set 2 eq) 0.933 (3.06) 0.939 (3.05) - Equations are provided with the BIA instrument for LBM (normal men’s eq) - - 0.932 (3.l3)t the prediction of LBM: for men LBM = 6.493 Normal Normal All normal + 0.4936(height2/resistance) + 0.332(weight); and for set 1 set 2 women women LBM 5.09 1 + 0.6483(height2/resistance) Women + 0. 1699(weight). The correlation between LBMd and Downloaded from www.ajcn.org by on January 11, 2008 Normal women LBM predicted with use of the manufacturer’s equation LBM (normal set I eq) 0.916 (1.90) 0.897 (2.05) - LBM(normalset2eq) 0.911 (1.93) 0.903(2.00) - was r = 0.857 (SEE = 3.70 kg) for men and r = 0.800 LBM (obese women’s UI) - - 0.897 (2.06)t (SEE = 3.18 kg) for women. However, the mean predicted LBM was significantly greater than LBMd for both men Obese Obese Allobese set 1 set 2 women (69.2 ± 8.52 kg predicted LBM vs 64.0 ± 8.2 kg LBMd) and women (47.3 ± 6.2 kg predicted LBM vs 44.6 ± 5.30 Obese women LBM (obese set 1 eq) 0.953 (2.05) 0.953 (1.97) - kg LBMd), indicating that the manufacturer’s equation LBM (obese set 2 eq) 0.952 (2.06) 0.954 (1.81) - systematically overestimated LBMd for both sexes. This LBM (normal women’s ui) - - 0.938 (2.20)t overestimation of LBMd by the manufacturer’s equation was most apparent in the obese men and women (Ta- 11 Best-fining equations for predicting LBM for normal and obese men and women denved from set 1 were applied to set 2 and vice versa. Measured LBM ble 6). (LBMd) was regressed on LBM predicted with use ofthe equation developed from the opposite t and correlations between measured and cross-predicted LBM and SEES are shown. Effect of fitness-specific equations is indicated by regression of Discussion LBMd on LBM cross predicted by applying obese subjects’ equation to normal subjects and vice versa. t Slope significantly different from 1, p < 0.05; intercept significantly different The results ofthis study confirm the validity ofthe BIA from 0, p< 0.05. method for predicting LBM in large heterogeneous sam- ples of men and women. In contrast to previous reports (2-4), height2 and resistance individually rather than at the second step was then determined. For both men height2/resistance were selected by the stepwise regression and women the addition ofLBM derived from the fatness- process. This finding was consistent among the four labs. specific BIA equations significantly improved the predic- Also, whereas in previous studies (3, 4) the slopes of the tion of LBMd: the change in the correlation coefficients prediction equations were not reliably different between (from R = 0.934 to 0.943 for men and from R = 0.923 men and women, in the present study significant differ- to 0.952 for women) was highly significant (p < 0.0001) ence in the regression coefficients were found between as were the reduction in the SEEs (from 2.53 to 2.22 kg men and women. It is possible that discrepancies between TABLE 6 Comparison of mean (±SD) densitometrically determined lean body mass (LBMd) with lean body mass (LBM) cross-p redicted with use of fatness- specific equations and RJL System’s equation Normal men Obese men Normal women Obese women LBMd 64. 12 ± 7.56 63.95 ± 8.63 44.54 ± 4.64 44.71 ± 6.36 LBM (manufacturer’s eq) 66.60 ± 7. 18 7 1 . 19 ± 8.95 46.56 ± 5.44 48.87 ± 7.04 LBM (obese men’s eq) 57.98 ± 5.90 LBM (normal men’s eq) 71.51 ± 10.1 1 LBM (obese women’s eq) 41.38 ± 3.91 LBM (normal women’s eq) 49.63 ± 7.79 S p < 0.01 vs LBMd.