Recommended

Recommended
More Related Content
Similar to Presentation1 (3)
Similar to Presentation1 (3) (20)
Presentation1 (3)
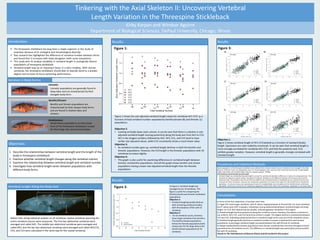
- 1. § The threespine stickleback has long been a staple organism in the study of evolution because of its ecological and morphological diversity § Past research has highlighted the difference of vertebral number between forms and found that it increases with body elongation (with some exceptions). § This study aims to analyze variability in vertebral length in ecologically diverse populations of threespine stickleback § Vertebral length may be an important factor in a fish’s mobility. With shorter vertebrae, the threespine stickleback should able to laterally bend to a greater degree and increase its burst swimming performance. Introduction: Objectives: 1. Describe the relationships between vertebral length and the length of the body in threespine stickleback 2. Examine whether vertebral length changes along the vertebral column 3. Examine the relationship between vertebral length and vertebral number 4. Investigate how vertebral length varies between populations with different body forms Results: Results: Variation in Body Forms: Limnetic: Benthic and Stream populations are characterized by their deeper body forms and are found in shallow lakes and streams. Anadromous populations are the ocean form of the threespine stickleback, known for their large size and armored plates. Benthic/Stream: Anadromous: Limnetic populations are generally found in deep lakes and are characterized by their elongate body form. Tinkering with the Axial Skeleton II: Uncovering Vertebral Length Variation in the Threespine Stickleback Twenty populations of the threespine stickleback were collected from nineteen bodies of water in Alaska and were brought to the Field Museum of Natural history for photography and x-‐ray. The photographs and x-‐rays were then scaled and measured for standard (body) length, body depth, and vertebral length using the computer program TPSDig2. Standardizing vertebral length by body length: • Vertebral length was standardized by body length to account for variation attributable to differences in body size among specimens. This was done by regression analysis and the calculation of residuals. Residuals are the difference between the measured value and the predicted value. The predicted value for each fish was added to the calculated residual to standardize by size. A grand mean was also necessary for these calculations. However, the anadromous populations tend to be much larger than the benthic/stream and limnetic populations. To ensure accuracy, two separate grand means for standard length were calculated: one for benthic/stream and limnetic populations (45.64 mm), and one for the anadromous populations (69.50 mm). Data on the anadromous populations is not shown here. Procedures and Statistical Methods: Figure 1 shows the size-‐adjusted vertebral length values for vertebrae AV1-‐CV3 as a function of total vertebral number separated by benthic/stream (B) and limnetic (L) populations. Objective 2: • Looking vertically down each column, it can be seen that there is a decline in size-‐ adjusted vertebral length moving posteriorly along the body axis from AV1 to CV3. AV1 is the longest vertebra, followed by AV2. AV3, CV1, and CV2 tend to have similar size-‐adjusted values, while CV3 consistently shows a much lower value. Objective 3: • As vertebral number goes up, vertebral length declines in both the benthic and limnetic populations. However, the CV3 length in the limnetic populations with 34 vertebrae increases slightly. Objective 4: • This graph is also useful for examining differences in vertebral length between limnetic and benthic populations. Overall the graph shows benthic and stream populations having a lower size-‐adjusted vertebral length than the limnetic populations. Kirby Karpan and Windsor Aguirre Department of Biological Sciences, DePaul University, Chicago, Illinois Vertebral Length Along the Body Axis: Figure 1: Rather than doing statistical analysis on all vertebrae, twelve vertebrae spanning the entire vertebral column were measured. The first two abdominal vertebrae were averaged and called AV1. The middle two abdominal vertebrae were averaged and called AV2, and the last two abdominal vertebrae were averaged and called AV3.CV1, CV2, and CV3 were calculated in the same way for the caudal vertebrae. Figure 3: Objective 1: Figure 3 shows vertebral length of AV1-‐CV3 plotted as a function of standard (body) length. Specimens are color coded by ecomorph. It can be seen that vertebral length is more strongly correlated for vertebrae AV1-‐CV2, and that the posterior end, CV3, exhibits greater variation. However, vertebral length is generally strongly correlated with standard length. In terms of the four objectives, it has been seen that: 1) Larger fish have longer vertebrae, with R2 values ranging between 0.70 and 0.94. For most vertebrae, the R2 values were 0.87 or greater, indicating a strong relationship between vertebral length and body length. For CV3, the relationship was weaker, indicating greater variability in this region. 2) Vertebral length declines posteriorly along the vertebral column. However, the pattern of decline is not uniform. AV3, CV1, and CV2 tend to be similar in length. The largest decline is consistently between CV2 and CV3, indicating substantial decline in vertebral length at the very end of the vertebral column. 3) Vertebral length generally declines as vertebral number increases in both benthic and limnetic populations. Surprisingly, vertebral length increased between fish with 30 and 31 vertebrae. 4) Deeper bodied benthic/stream populations have shorter vertebrae than the more elongate limnetic populations for all vertebral counts. The difference in vertebral length was particularly pronounced for fish with 33 vertebrae. Thanks to The Field Museum of Natural History and all involved in this project. Conclusions: Results: Figure 2: In Figure 2, vertebral length was averaged across all vertebrae. This figure is useful for comparing the benthic/stream and limnetic stickleback populations. Objective 3: • Vertebral length generally declines with increasing vertebral number, with the exception of fish with 31 vertebrae. Objective 4: • For all vertebral counts, limnetics have longer vertebrae than benthics. The benthic/stream populations follow the limnetic populations fairly closely save for the large drop in the benthic/stream populations at 33 vertebrae.