1. Long : SunCoke Energy Partners L.P. (NYSE:SXCP)
Analyst : Kelvin Li
September 26, 2016
Queen’s University
Target Price $18
Key Statistics Company Overview
0K
500K
1,000K
1,500K
2,000K
$0
$5
$10
$15
$20
Sep Nov Jan Mar May Jul
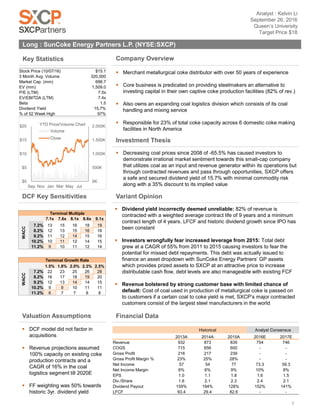
YTD Price/Volume Chart
Volume
Close
Merchant metallurgical coke distributor with over 50 years of experience
Core business is predicated on providing steelmakers an alternative to
investing capital in their own captive coke production facilities (82% of rev.)
Also owns an expanding coal logistics division which consists of its coal
handling and mixing service
Responsible for 23% of total coke capacity across 6 domestic coke making
facilities in North America
Investment Thesis
Decreasing coal prices since 2008 of -65.5% has caused investors to
demonstrate irrational market sentiment towards this small-cap company
that utilizes coal as an input and revenue generator within its operations but
through contracted revenues and pass through opportunities, SXCP offers
a safe and secured dividend yield of 15.7% with minimal commodity risk
along with a 35% discount to its implied value
Variant Opinion
Dividend yield incorrectly deemed unreliable: 82% of revenue is
contracted with a weighted average contract life of 9 years and a minimum
contract length of 4 years. LFCF and historic dividend growth since IPO has
been constant
Investors wrongfully fear increased leverage from 2015: Total debt
grew at a CAGR of 55% from 2011 to 2015 causing investors to fear the
potential for missed debt repayments. This debt was actually issued to
finance an asset dropdown with SunCoke Energy Partners’ GP assets
which provides prized assets to SXCP at an attractive price to increase
distributable cash flow, debt levels are also manageable with existing FCF
Revenue bolstered by strong customer base with limited chance of
default: Cost of coal used in production of metallurgical coke is passed on
to customers if a certain coal to coke yield is met, SXCP’s major contracted
customers consist of the largest steel manufacturers in the world
Stock Price (10/07/16) $15.1
3 Month Avg. Volume 320,000
Market Cap. (mm) 698.7
EV (mm) 1,509.0
P/E (LTM) 7.5x
EV/EBITDA (LTM) 7.4x
Beta 1.5
Dividend Yield 15.7%
% of 52 Week High 97%
DCF Key Sensitivities
Financial Data
Historical Analyst Consensus
2013A 2014A 2015A 2016E 2017E
Revenue 932 873 839 754 746
COGS 715 656 600 - -
Gross Profit 216 217 239 - -
Gross Profit Margin % 23% 25% 28% - -
Net Income 57 54 77 73.3 59.3
Net Income Margin 6% 6% 9% 10% 8%
EPS 1.0 1.1 1.8 1.6 1.5
Div./Share 1.6 2.1 2.3 2.4 2.1
Dividend Payout 159% 194% 128% 152% 141%
LFCF 93.4 29.4 82.6 - -
Valuation Assumptions
DCF model did not factor in
acquisitions
Revenue projections assumed
100% capacity on existing coke
production contracts and a
CAGR of 16% in the coal
logistics segment till 2020E
FF weighting was 50% towards
historic 3yr. dividend yield
1
Terminal Multiple
WACC
14 7.1x 7.6x 8.1x 8.6x 9.1x
7.2% 13 15 16 18 19
8.2% 12 13 15 16 18
9.2% 11 12 14 15 16
10.2% 10 11 12 14 15
11.2% 9 10 11 12 14
Terminal Growth Rate
WACC
14 1.5% 1.8% 2.0% 2.3% 2.5%
7.2% 22 23 25 26 28
8.2% 16 17 18 19 20
9.2% 12 13 14 14 15
10.2% 9 9 10 11 11
11.2% 6 7 7 8 8
2. 2
Risks
Rising supply equipment and replacement costs: Unlike coal prices, equipment replacement costs are unable to
be passed on to customers. If the cost of maintaining and buying equipment increases, profits may be harmed–
Mitigating factor: costs have generally been stable with minimal deviation from the historic mean
Interest rate risk: SXCP’s leverage ratio has increased from 2.1x to 4.3x from 2014-2015, on a debt/capital ratio
basis, this implies a jump from 30.1% to 54.6%. This exposes the company to interest rate risks on variable rate
loans and risk of missed debt repayments. – Mitigating factor: only 6.1% of loans are bank loans which generally
have a variable rate associated with the debt, management also mentions in its 2015 MD&A that 2016 will be the
year focused on amortizing debt
Heavy reliance on contract terms: There exists take-or-pay agreements with customers in which customers (steel
manufacturers) purchase all of SXCP’s capacity of coke. Reduced demand for steel may put pressure on customers
and cause them to renegotiate contract terms – Mitigating factor: customers are major players in the steel
production industry ex. Arcelor Mittal, AK Steel, and United States Steel Corp. SXCP additionally has one of the
highest coal to coke yields in merchant metallurgical coke production giving it a competitive advantage
Reasons for Existing Opportunity
Comparable companies could not be used as there are no pure play existing merchant metallurgical coke producers
that are public other than SXCP, therefore the company was valued on a historic multiple and DCF basis
Public investors lack understanding of contracted benefits: 44% of ownership in SXCP stock is from public
shareholders with many misinterpreting the correlation between decreasing coal prices and SXCP’s contracted
revenue with it being minimal
China’s economic slowdown has caused increase pessimism on steel markets: Customers of SXCP are steel
manufacturers and decreasing demand has caused investors to assume lack of metallurgical coke purchases from
SXCP. Merchant coke purchases account for a minimal amount of coke production in the United states as most of it
is made in-house at steel manufacturing sites and has historically been purchased at 100% capacity from SXCP
Continuous negative sentiment for the metals and mining industry: iShares MSCI Global Metals & Mining
Producers (PICK) which tracks upstream M&M producers has returned a CAGR of -15% for the past five years.
Investors are hesitant to take large positions in an industry that has proven to provide minimal gains over the years
Summary of Valuations
$13 $14 $10 $9
$6
$24 $25
$36
$19
$28
$0
$10
$20
$30
$40
$50
$60
3yr Historic
EV/EBITDA Range
25th to 75th Percentile
(6.8x-9.3x)
3yr Historic
P/BV Range
25th to 75th Percentile
(0.9x-1.6x)
3yr Historic
Div. Yield
(6.6%-24.9%)
DCF
Multiples Method
(7.1x-9.1x)
DCF
GGM
(2%-3%)
Target Price = $18
Current Price = $15
Capital Gains = 20%
Dividend Yield = 15%
Total Return = 35%
3. 3
Appendix I : Thesis Details
Decreasing coal prices have minimal effects on bottom-line
If coal to coke yields are above the contractual standards signed by SXCP and its customers, than a pass through will
occur in which the customer under the obligations of the contract pays for the cost of coal used to make SXCP’s coke.
Historically, coal to coke yields have not deviated drastically from the average yield of 68.3% for the past 6 years.
Below is a graph highlighting historic capacity utilization and coal to coke yields. From IPO to 2014, the correlation
between coal prices and SXCP stock was actually lower with an R2 of 0.3151, this is because investors understood the
business model and the details of the contract early on the company’s life, overtime it became a quick way to play the
commodity market and misinformed investors came in causing the correlation between SXCP and coal to increase to a
R2 value of 0.9355. It is expected that this correlation overtime will once again return back to its original levels.
Dividend yield incorrectly deemed unreliable
Since SXCP’s IPO in 2013, the company has never missed a dividend payout and has been increasing it’s dividend
every year. Historically, SXCP has been trading at a 5% dividend yield but due to a increased selloff last year in
commodities, the company trades at ~15% yield. This dividend is safe as the company has 82% of it’s total revenue
contracted with a minimum contract life of 4 years and a weighted average contract life of 9. The other 18% of revenue
is contributed by the coal logistics segment and may hinder dividend performance. Fortunately, the coal logistics
segment has grown at a CAGR of 81% over the past 3 years and is most likely going to keep growing moving forward
based off of historical growth rates. Below are details on the company’s domestic coke production contracts.
Furthermore, the company’s dividend is bolstered by strong LFCF growth CAGR of 65% within the past 4 years.
Overtime, it is assumed the company will return back to historic dividend yields of 5.4% once the market realizes how
safe this dividend truly is.
Contract Value Propositions
Customers required to take all coke produced up to contract max
Long-term take-or-pay brings stability during market & industry downturns
Commodity risk taken on by passing coal, transportation, & operating costs to customers
No early termination
97% 100% 102% 101% 98% 97% 100%
67% 67% 69% 69% 69% 69% 70%
0%
20%
40%
60%
80%
100%
120%
2010A 2011A 2012A 2013A 2014A 2015A 2016E
Capacity Utilization Coke Yields
Facility Location Customer Year of Contract # of Cokemaking
Startup Expiration Ovens Capacity (000's)
Owned & Operated
Jewell Vansant, Virginia ArcelorMittal 1962 2020 142 720
Indiana Harbour East Chicago, Indiana ArcelorMittal 1998 2023 268 1220
Haverhill Phase I Franklin Furnace, Ohio ArcelorMittal 2005 2020 100 550
Haverhill Phase II Franklin Furnace, Ohio Ak Steel 2008 2022 100 550
Granite City Granite City, Illinois U.S. Steel 2009 2025 120 650
Middletown Middletown, Ohio AK Steel 2011 2032 100 550
Operated
Victoria Victoria, Brazil ArcelorMittal 2007 2023 320 1700
Equity Method Investment
VISA SunCoke Odisha, India Various 2007 n/a 88 440
Total 1238 6380
R² = 0.3151
0
100
200
0 50 100 150 200
SXCP Vs. KOL (Coal ETF) IPO to Dec. 2014
R² = 0.9355
0
50
100
0 50 100 150 200
SXCP Vs. KOL (Coal ETF) Dec 2014 to Present
4. 4
Investors wrongfully fear increased leverage
The amount of debt that SXCP has taken on over the years has increased drastically. Investors have priced in this
leverage as a sign of risk. The debt was taken on to finance an asset dropdown of SunCoke GP assets which
essentially is SXCP LP buying its own assets at an advantageous price. Generally, dropdowns are a good sign as GP’s
tend to sell off their prized assets to LP’s in order to increase distributable cash flow. In 2015, SXCP paid ~$200mm for
the GP’s Granite City assets, the likely increase in distributable cash flow from the acquisition will offset the debt raised
for the purchase. Generally, LP’s receive the asset at a price that is discounted compared to a strategic acquisition of
another company’s assets. Therefore SXCP would’ve issued even more debt if it was not a dropdown purchase. An
asset drop down is defined as the following: to drop down is to sell acquired assets to yourself. A drop-down transaction
is the acquisition of assets by a corporation, followed by a contribution of those assets to a partnership. Additionally,
SXCP’s unlevered free cash flow generation over the years has been consistently positive since 2012 and is expected
to grow in 2016E making the chance of missing interest and amortization payments to be slim.
Revenue bolstered by strong customer base with limited chance of default
82% of SXCP’s revenue is contracted with major steel manufacturers such as U.S. Steel, Arcelor Mittal, and AK Steel.
In 2015, AK Steel produced and shipped over 7 million tons of steel, while 1/5 of global car production in 2015 was from
Arcelor Mittal. With roughly 25% of metallurgical coke needed to be purchased on the open market, SXCP’s customers
are not too dependent on merchant coke production as part of their costs. Therefore, it is unlikely steel manufacturers
will renegotiate contracts when most of their resources come from in house production. SXCP also has some of the
purest metallurgical coke which negates the risk of imported coke from foreign countries such as China which
inherently is less pure.
225 225
190
399
896
0%
-16%
110% 124%
-40%
-20%
0%
20%
40%
60%
80%
100%
120%
140%
0
100
200
300
400
500
600
700
800
900
1000
2011 2012 2013 2014 2015
Total Debt ($mm)
Total Debt
YoY % Change
99%
36%
12%
0%
20%
40%
60%
80%
100%
120%
2013-2014 2014-2015 2015-2016E
Dividend Growth
CAGR 49%
54
103
43
113
136
0%
20%
40%
60%
0
50
100
150
2012A 2013A 2014A 2015A 2016E
UFCF Growth (mm)
CAGR 54%
1.50
2.97
0.93
2.63
3.34
0%
10%
20%
30%
40%
50%
60%
70%
-
0.50
1.00
1.50
2.00
2.50
3.00
3.50
4.00
2012A 2013A 2014A 2015A 2016E
LFCF / Share
CAGR 65%
5.4%
9.5%
11.6%
0.0%
2.0%
4.0%
6.0%
8.0%
10.0%
12.0%
14.0%
2013A 2014A 2015A
Historic Div. Yield
5. 5
Projection Schedule:
Coke Full Capacity
(000's)
2016E 2017E 2018E 2019E 2020E
Jewell 720 91 91 91 91 0
Indiana Harbour 1220 154 154 154 154 154
Haverhill Phase I 550 69 69 69 69 69
Haverhill Phase II 550 69 69 69 69 69
Granite City 650 82 82 82 82 82
Middletown 550 69 69 69 69 69
Victoria 1700 215 215 215 215 215
VISA SunCoke 440 56 56 56 56 56
Total Domestic Coke Rev 6380 806 806 806 806 715
4 Yr Average Rev 812
Avg Rev/000's Coke 0.13
Avg. 5 yr Capacity Utilization 99%
Domestic coke production
revenue was projected out
assuming no other contracts
were formed within the next 5
years. The Jewell contract
expires in 4 years therefore it
was assumed that no production
would come from that factory in
2020E
Appendix II : Domestic Coke Bottom-Up Production Schedule
Appendix III - A: 3-Statement Model Linked to DCF
Income Statement Historical Forecasted Period
2013 2014 2015 2016 2017 2018 2019 2020
Revenues 932 873 839 911 933 946 953 866
COGS (715) (656) (600) (679) (695) (705) (710) (645)
Gross Profit 216 217 239 232 238 241 243 221
Operating Expenses
R&D 0 0 0 0 0 0 0 0
SG&A (28) (27) (34) (31) (32) (32) (33) (30)
D&A (47) (54) (67) (61) (63) (64) (64) (58)
EBIT 141 135 137 140 143 145 147 133
EBITDA 188 189 205 201 206 209 211 191
Net Interest (15) (37) (48) (54) (49) (45) (40) (36)
EBT 126 98 90 86 94 101 106 97
Less: Taxes (69) (44) (12) (33) (36) (38) (40) (37)
Net Income 57 54 77 54 58 62 66 60
Balance Sheet Historical Forecasted Period
2013 2014 2015 2016 2017 2018 2019 2020
Current Assets
Cash 46 33 49 50 50 54 62 67
A/R 27 39 41 37 38 39 39 36
Inventories 59 90 77 79 81 82 83 75
Prepaid Expenses 2 1 2 2 2 2 2 2
Total Current Assets 134 164 169 168 171 176 185 179
Net PP&E 871 1,213 1,327 1,319 1,312 1,304 1,297 1,290
Net Intangible assets 23 31 206 206 206 206 206 206
Goodwill 0 8 68 68 68 68 68 68
Total Assets 1,028 1,417 1,769 1,761 1,756 1,754 1,755 1,742
Current Liabilities
Short-Term Debt 40 0 1 0 0 0 0 0
A/P 59 61 45 57 58 59 59 54
Accrued Expenses 11 24 30 23 23 24 24 22
Total Current Liabilities 110 85 77 79 81 83 83 76
Long Term Debt 153 406 947 872 797 722 647 572
Shareholder's Equity 765 927 745 809 877 949 1,025 1,094
Total Liabilities & SE 1,028 1,417 1,769 1,761 1,756 1,754 1,755 1,742
Balance Check 0 0 0 0 0 0 0 0
Cash Flow Statement Historical Forecasted Period
2013 2014 2015 2016 2017 2018 2019 2020
Cash from Operating Activities
Net Income 57 54 77 54 58 62 66 60
D&A 47 54 67 61 63 64 64 58
Changes in NWC:
(Increase)/Decrease in A/R - (13) (2) 4 (1) (1) (0) 4
(Increase)/Decrease in Inventories - (31) 13 (2) (2) (1) (1) 8
(Increase)/Decrease in Prepaid Expenses - 1 (1) 0 (0) (0) (0) 0
Increase/(Decrease) in A/P - 2 (16) 11 1 1 0 (5)
Increase/(Decrease) in Accrued Expenses - 13 7 (8) 1 0 0 (2)
Net Cash from Operations 104 80 146 121 120 125 130 122
Cash from Investing Activities
Capital Expenditures (46) (68) (42) (54) (55) (56) (56) (51)
Net Cash from Investing (46) (68) (42) (54) (55) (56) (56) (51)
Cash from Financing Activities
Issuance/(Repayment) of Debt (75) (75) (75) (75) (75)
Dividend Issuance (120) (96) (108) (108) (108) (108) (108) (108)
Issuance/(Buyback) of Stock 117 117 117 117 117
Net Cash from Financing (66) (66) (66) (66) (66)
Net Change in Cash 2 (0) 4 8 5