More Related Content
Similar to Kalleen Poster Mentorship
Similar to Kalleen Poster Mentorship (20)
Kalleen Poster Mentorship
- 1. RESEARCH POSTER PRESENTATION DESIGN © 2012
www.PosterPresentations.com
We conducted an analysis of current bird ranges in Peninsular Malaysia
and Sumatra to determine their accuracy. We chose this area due to the
region’s known ecological importance as home to large-scale biodiversity.
We started the refinement of current ranges by using the known preferred
elevation of each regional bird species and updated the region’s forest area
using a forest canopy analysis. Our findings showed that preferred bird
habitat in Peninsular Malaysia and Sumatra was drastically reduced when
applying this method, and shows that such minimal vector mapping can be
an inaccurate technique when used in consideration for conservation of
forest-dwelling bird species. Following these findings, we conducted
another analysis on RSPO-certified oil palm data sets to quantify the
accuracy of the best-compiled oil palm database in Sumatra. We found
that this set is unreliable, and more oil palm is present in Sumatra than
previously considered. Setting conservation priorities in areas that contain
or will contain oil palm negates the purpose of prioritization, and our data
shows that current methods of analyzing bird presence is inaccurate and
that using our technique will help improve conservation efforts in the
region.
Abstract
Introduction
In this project, Arc-GIS, a spatial mapping software, was used to develop visual
answers to the question of oil palm impact and bird range refinement within
Peninsular Malaysia and Sumatra. First, using bird range shapefiles from
Birdlife, a conservation organization with the most compiled information on bird
ranges and features, a general map of all birds in Malaysia was compiled. These
ranges, however, were most likely imprecise due to the nature of minimal-vector
analysis. Minimal vector targets sightings of a particular species and creates a
literal shape verified by an ornithologist. While this method is useful and fast, it
is inaccurate to use such a map when looking at conservation priorities because
it fails to consider elevational preferences and habitat preferences of each
species of endemic bird within the range. The first polygons that were gathered
from birdlife are shown in the leftmost map of Figure 1. Using this knowledge, a
python program was developed with the help of Ocampo-Penuela in order to
examine the species that were compiled within Peninsular Malaysia and
Sumatra, and to refine them by the elevation that was listed as their preferred
elevation within birdlife.org, the leading organization on the classification and
database on bird information in the world. This refinement by preferred bird
elevation is seen in the central map of figure 1. As seen in the figure, the
warmer colors correlate to an increased concentration of endemic bird diversity
within the region, and many of the lowlands are seen to be preferred by the
greatest amount of endemic birds within Malaysia. Figure three attempted to
make the figure more accurate by restricing potetntial bird locations by forest
habitat, which is the principal location for forest dwelling birds. Forest dwelling
birds were the only type of birds used within the study, to prevent from not
including viable bird habitat from our information. Figure threen was shown to
drastically reduce viable habitat as the deforestation in the area caused a large
amount of forest habitat to be depleted. In this study, however, it was determined
that the habitat refinement map could be even more dramatically impacted than
previously thought. The data on forest cover was obtained by using an algorithm
that identifies forest cover as a percentage of green reflected by a satellite
orbiting earth. Oil palm, however, is a crop that has most dramatically impacted
the region and is extremely green in color and very dense. This led us to the
conclusion that oil palm could be interfering with the accuracy of the forest layer
and the next figures show the steps taken to solve this inaccuracy.
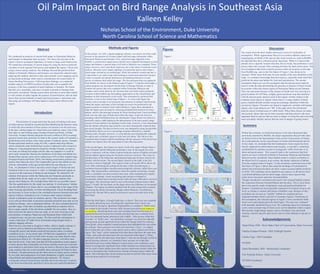
In the second figure, four frames are shown. In the first, upper leftmost frame a
map of Sumatra and the Malaysian peninsula is seen. In the legend, the color
scale is explained, with the whitest regions being the regions of highest elevation
and the darkest regions being the elevations closest to sea level. This is just toi
familiarization of the Malaysian and Sumatran landscape for those who are not
familiar with the terrain. The second figure, directly to the right, is the first
elevation I chose to highlight. This region in blue is all terrain 300 m above sea
level. After confirming the ecological relevance of this forested region, a
correlation between higher elevation and ecologically relevant, viable forest was
made. After doing further confirmation within the satellite technology, Google
Earth, a correlation was discovered in more area. After expanding the original,
conservative estimate, a more enveloping and conclusive estimate of
elevationally related forest was discovered within all areas 100m above sea level
and higher. This elevational cutoff is seen in the bottom leftmost frame within
figure 2. Finally, the last frame on this figure shows the difference in elevational
estimates. The region was almost doubled from the more conservative estimate,
showcasing the drastic elevational changes within Malaysia. The difference
between the 100 and 300 m cutoff in elevation is seen in the pink color in the
final frame.
Within the third figure, a Google Earth layer is shown. This layer was compiled
by visually identifying areas of ecologically significant forest, which was
determined by having no significant fragmentation or cropland A “buffer zone”
was created at the boundry between viable forested area and human-impacted
surroundings. Identifying these areas and excluding them from the layer is a
significant decision because this excludes area that may have overhead forest
cover but increased human interaction with wildlife.. After an area within this
“boundry” or “buffer zone” was identified, a polygon was drawn by manually
placing points around significant forest within the Google Earth Pro software.
These points, when compiled, created polygons that highlighted this area within
the software. These polygons were then converted into a “layer,” or a digital
sheet of data that can overlay a map and be used to add or subtract area from a
region. This “layer” can be combined with other layers that show the same type
of data, such as the elevation layer that was discussed within figure 2. When
combined with the elevation layer from figure 2 that was run through ArcGIS (a
spacial layering software), we compiled a more accurate set of data that
identified forest cover within Malaysia.As these layers were combined, a new
dataset of ecologically significant forest within Sumatra was obtained and can
now be used in future studies from other species conservatoin studies within the
region to disciplinest that would need an estimate of human impact within the
region. This technique that was developed can also be used for other areas where
a percent green analysis is not accurate.
Methods and Figures
Figure 1
Figure 2
Figure 3
Discussion
Our results from the three studies showcase a series of verification of
assumptions. While organizations that serve to protect endemic species are
campaigning on behalf of the species they keep records on, such as Birdlife,
the data that they have collected can be inaccurate. While it is known that
animals have a specific location that they like to reside, this preference is not
always taken into account when creating priorities for land conservation. The
first assumption that birds would be present within all locations in the data
from Birdlife.org, seen in the first frame of Figure 1, has shown to be
incorrect. While some birds may be seen outside of the area identified in this
study, it is common knowledge that most species, especially birds need their
preferred elevation and habitat for food and reproduction. The second
assumption disproven was the assumption that the percent green analysis
used to create the data determining the presence or absence of forest would
be accurate within the chosen region of Peninsular Malaysia and Sumatra.
This was inaccurate because of the climate of South East Asia serving as a
good incubator for Oil Palm, a highly green and dense crop that interferes
with the percent green analysis used in this region. Further studies in the
southeast asian region or regions where there is a large number of dense
green cropland should consider using the technique identified within the
second two figures. Elevation was found to negatively correlate with human
impact, and visual analysis can “fill” in the gaps where the elevational
analysis misses lowland areas of viable forest. When these factors are taken
into account, future data can be more accurate and help conserve the most
important land for species that are most in danger of extinction and even help
more accurately identify species that are most in danger of going extinct.
Summary
Within this research, we found bird species to be more threatened than
previously assumed by Birdlife, the major organization that provides data
on threat levels to the International Union on the Conservation of Nature,
the world authority on the classification of extinct and threatened species.
In this study, we concluded that the Southeastern Asian region has been
heavily impacted by deforestation and oil palm, a crop that is commonly
misidentified by satellites as part of ecologically viable forest due to its
dense and green nature. This research leads to the conclusion that bird
species are more restricted in habitat in Peninsular Malaysia and Sumatra
than previously considered. Since habitat extent is a direct correlation to
the threat level of a species to go extinct, the drastic reduction of habitat
from the original frame in Figure 1 to the extremely constricted area in the
last frame of Figure 1 shows that using the technique of refinement by
habitat and preferred elevation can show a more accurate habitat preferred
by birds. This technique can be applied to any species, as all species have
a preferred habitat(s) and elevation range, such as insect species that
prefer lower elevations and more forested habitat.
Though considered a correlation previously, this research helped confirm
the connection between forested habitat and elevation. This is most likely
due to the specific needs of plantation crops and preferred habitat for
humans. Croplands are most generally required to be located closer to sea
level, as climate is warmer and fosters a healthier crop. Because of this,
mountains are not seen as “suitable” habitat for cropland and less
impacted montane forest is present in mountain regions. Continuing on
this assumption, the selected regions in Figure 2 were considered viable
forest cover and transferred to the third figure. This area was combined
with manually identified forest cover. By combining these two techniques,
a new, more accurate map of forest cover can be identified within a region
that has had a high human impact, such as Southeast Asia and South
America, and this specific data can be used to refine habitats of species of
interest.
Acknowledgements
Stuart Pimm, PhD - Doris Duke Chair of Conservation, Duke University
Natalia Ocampo-Penuela - PhD, Fulbright Scholar
Varsha Vijay - PhD Candidate
NCSSM
Sarah Shoemaker, PhD - Mentorship Coordinator
The Nicholas School - Duke University
NCSSM Foundation
Monsanto
Prioritization of conservation has the goal of looking at all areas
of where species should be located and then identifying the fraction areas
in which the most amount of these species are present over the total area..
In the past, refining ranges for conservation was relatively scarce. One of the
first teams to start refining ranges Ocampo-Penuela and Pimm, of Duke
University. Ocampo Penuela and pimm devised a method in 2014 on setting
practical conservation priorities for birds in the western Andes of Colombia, a
global biodiversity hotspot with a large amount of endemic species. Ocampo-
Penuela performed analyses using Arc-GIS, a spatial analyzing software,
which entailed the same methods that was have employed in this research in
Malaysia. Using programming developed by Ocampo Penuela, an analysis
was done on refining bird ranges and this data was mapped so it could be
more easily interpreted. Because the limitations of elevation and habitat loss
threaten these species, areas can be reduced up to 83% of their original range
(Ocampo-Penuela and Pimm, 2014). Developing conservation priorities is a
practice that relates the idea of the irreplaceable species that inhabit an area
with the vulnerability of the species that habitat the area (Brooks et al.).
First, we attempted to find or develop current ranges of Malaysian and
Sumatran birds in our research in order to highlight practical regions to
conserve in the total area of Malaysia and Sumatra. We identified 130
endemic bird species within the Malaysian and Sumatran peninsula as
suitable birds for the study out of a total 159 possible endemic bird
species from Malaysia. We excluded these birds for two possible reason.
The first qualification for this study was habitiat. If a bird species’ habitat
was not identified to be forest, then it was excluded due to the range of the
study focusing specifically on forest dwelling birds. Forest dwelling birds
are necessary to focus on due to the correlation between forested areas and
species richness (Atratakorn et al.) Common other regions included
coastal or plantation areas for endemic species. This exclusion was major
as we will use these birds to prioritize potential protected areas that are not
settled by humans, such as plantation habitats. We also excluded based on
possible range. If the data on birdlife.org identified an endemic bird to
have a range outside of the elevations avaliable for our country, then we
had to discount the species from our study, as we were focusing on the
prioritization of endemic Malaysian and Sumatran birds within both
ecological areas, not just one country. We then used this information to
create a map layer of viable forest in Sumatra using Google Earth, a
sattelite imaging software.
When forest is converted to oil palm or rubber, which is highly common in
countries such as Indonesia and Malaysia, bird communities become
ecologically poorer and habitat-restricted bird species reduce in number
(Aratrakorn et al.). At its current state, Oil Palm has expanded by 1,874,000
hectares in Malaysia, and over half of this increase was taken directly from
forested areas (Koh et al.) Oil palm expansion, however, will affect more
than bird diversity. It has been seen that Oil Palm plantations cannot support
as many species than ecologically rich forests, and the current use of percent-
green analysis to determine which areas are forest is flawed in these southeast
asian countries that rely on the incredibly dense and green Oil Palm for their
livelihood. Oil palm presence has also been shown to reduce species richness
by over half, and management of oil palm plantations is highly correlated
with pollution and enhanced greenhouse gas emissions . We mapped
ecologically relevant forested areas manually due to the relevance of habitat
to the forest-dwelling birds identified in these previous studies(Fitzherbert et
al..
Nicholas School of the Environment, Duke University
North Carolina School of Science and Mathematics
Kalleen Kelley
Oil Palm Impact on Bird Range Analysis in Southeast Asia
Figures