1. Heavy Metal Mining and the Potential Contamination of
Sensitive Marine Habitats in Coastal Alaska
Justin Fehntrich
Stony Brook University
Abstract:
Alaska has a thriving mining industry that supplies
many useful commodities to industry including heavy
metals. Elements such as mercury, arsenic, lead and
cadmium are among those commodities mined in
Alaska that have a direct correlation with marine life by
being the most common contaminants found in fish
consumed by humans such as Chinook salmon. Mine
spills and accidents account for a proportion of those
materials that become marine pollutants when they
make their way into ground water and rivers leading to
pristine marine environments. For this research project
I utilized ArcMap Version 10.3.1 along with data from
the United States Geological Survey (USGS) and the
Alaska State Geo-Spatial Data Clearinghouse (ASGDC).
The purpose of this project was to assess heavy metal
contamination and potential risks to biological systems
by conduction trends analysis for areas which are
regularly fished commercially around Alaska’s coastline.
The Cook Inlet is the area most susceptible to
contamination due to the Susitna River mouth. This
research is important for public health awareness as
well as a guide for the Alaskan fishing industry by
providing information about which areas are safest to
fish. This project can also generate awareness about
serious environmental threats that can be remediated
by making improvements to mine safety protocols and
providing educational outreach to potential consumers
of the Alaskan fishery.
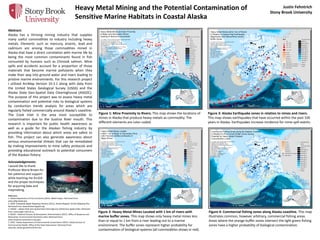
Figure 1: Mine Proximity to Rivers. This map shows the locations of
mines in Alaska that produce heavy metals as commodity. The
different elements are color coded.
Figure 2: Heavy Metal Mines Located with 1 km of rivers with
marine buffer zones. This map shows only heavy metal mines less
than or equal to 1 km from a river leading out to a marine
environment. The buffer zones represent higher probability for
contamination of biological systems (all commodities shows in red).
Figure 3: Alaska Earthquake zones in relation to mines and rivers.
This map shows earthquakes that have occurred within the past 100
years in Alaska. Earthquakes increase incidence for mine-spill events.
Figure 4: Commercial fishing zones along Alaska coastline. This map
illustrates common, however arbitrary, commercial fishing areas.
Areas where the orange buffer zones intersect the light green fishing
zones have a higher probability of biological contamination.
Chinook Salmon. Photo: www.wildretreat.com
Acknowledgements:
I would like to thank
Professor Maria Brown for
her patience and support
while teaching me ArcGIS
and the proper techniques
for acquiring data and
mapmaking.
References:
1. Alaska Department of Fish and Game (2015). MESA Project. Retrieved from:
www.adfg.alaska.gov.
2. SDMI: Statewide Digital Mapping Initiative (2012). Alaska Mapped: ArcGIS Mapping Files
Retrieved from: www.alaskamapped.org
3. ASGDC – Alaska State Geo-Spatial Data Clearinghouse (2010) Geo-Spatial Data. Retrieved
from: www.asgdc.state.ak.us.
4. NOAA – National Oceanic & Atmospheric Administration (2015). Office of Response and
Restoration. Environmental Sensitivity Index. Retrieved from:
www.response.restoration.noaa.gov
5. ADEC: Alaska Department of Environmental Conservation (2015). Alaska Division of
Environmental Health, Office of the State Veterinarian. Retrieved from:
www.dec.alaska.gov/eh/vet/fish.htm