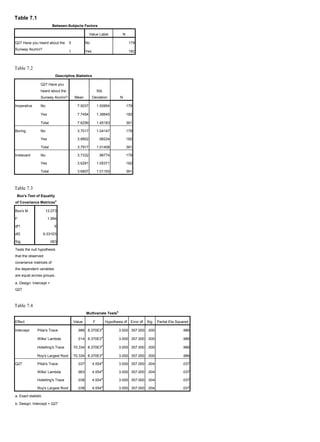
1. Table 7.1<br />Between-Subjects FactorsValue LabelNQ27 Have you heard about the Sunway Alumni?0No1791Yes182<br />Table 7.2<br />Descriptive StatisticsQ27 Have you heard about the Sunway Alumni?MeanStd. DeviationNImperativeNo7.50371.50954179Yes7.74541.38645182Total7.62561.45183361BoringNo3.70171.04147179Yes3.8802.98224182Total3.79171.01458361IrrelevantNo3.7332.96774179Yes3.62911.05371182Total3.68071.01193361<br />Table 7.3<br />Box's Test of Equality of Covariance MatricesaBox's M12.073F1.994df16df29.331E5Sig..063Tests the null hypothesis that the observed covariance matrices of the dependent variables are equal across groups.a. Design: Intercept + Q27<br />Table 7.4<br />Multivariate TestsbEffectValueFHypothesis dfError dfSig.Partial Eta SquaredInterceptPillai's Trace.9868.370E3a3.000357.000.000.986Wilks' Lambda.0148.370E3a3.000357.000.000.986Hotelling's Trace70.3348.370E3a3.000357.000.000.986Roy's Largest Root70.3348.370E3a3.000357.000.000.986Q27Pillai's Trace.0374.554a3.000357.000.004.037Wilks' Lambda.9634.554a3.000357.000.004.037Hotelling's Trace.0384.554a3.000357.000.004.037Roy's Largest Root.0384.554a3.000357.000.004.037a. Exact statisticb. Design: Intercept + Q27<br />Table 7.5Levene's Test of Equality of Error VariancesaFdf1df2Sig.Imperative.6071359.436Boring.7361359.392Irrelevant1.0921359.297Tests the null hypothesis that the error variance of the dependent variable is equal across groups.a. Design: Intercept + Q27<br />Table 7.6<br />Tests of Between-Subjects EffectsSourceDependent VariableType III Sum of SquaresdfMean SquareFSig.Partial Eta SquaredCorrected ModelImperative5.272a15.2722.512.114.007Boring2.877b12.8772.809.095.008Irrelevant.978c1.978.955.329.003InterceptImperative20984.965120984.9659.998E3.000.965Boring5187.67615187.6765.065E3.000.934Irrelevant4891.60614891.6064.776E3.000.930Q27Imperative5.27215.2722.512.114.007Boring2.87712.8772.809.095.008Irrelevant.9781.978.955.329.003ErrorImperative753.5353592.099Boring367.6983591.024Irrelevant367.6653591.024TotalImperative21750.750361Boring5560.640361Irrelevant5259.438361Corrected TotalImperative758.807360Boring370.575360Irrelevant368.644360a. R Squared = .007 (Adjusted R Squared = .004)b. R Squared = .008 (Adjusted R Squared = .005)c. R Squared = .003 (Adjusted R Squared = .000)<br />Estimated Marginal Means<br />Table 7.7<br />Q27 Have you heard about the Sunway Alumni?Dependent VariableQ27 Have you heard about the Sunway Alumni?MeanStd. Error95% Confidence IntervalLower BoundUpper BoundImperativeNo7.504.1087.2917.717Yes7.745.1077.5347.957BoringNo3.702.0763.5533.850Yes3.880.0753.7334.028IrrelevantNo3.733.0763.5843.882Yes3.629.0753.4823.777<br />