Sustainability and Corporate Responsibility Report 2015
Rwanda MDG Report 2013
1. Millennium Development Goals
Rwanda
Final Progress Report: 2013
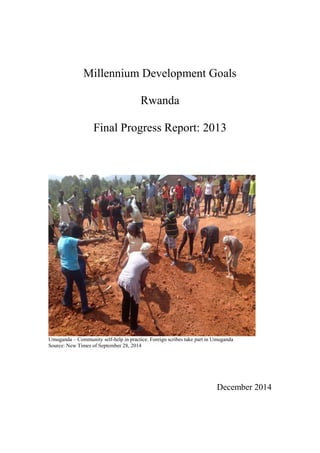
Umuganda – Community self-help in practice. Foreign scribes take part in Umuganda
Source: New Times of September 28, 2014
December 2014
2. i
Table of Contents
List of figures................................................................................................................ ii
List of boxes................................................................................................................. iii
List of tables................................................................................................................. iii
List of abbreviations .....................................................................................................iv
FOREWORD.............................................................................................................. vii
PREFACE.....................................................................................................................ix
1. Introduction and the MDG Status at a Glance...........................................................1
2. Rwanda: Its development context..............................................................................8
2.1 Enabling factors ...................................................................................................9
2.2 Challenges..........................................................................................................11
2.3 Conclusions........................................................................................................13
3. National Milestones around the MDGs ...................................................................15
3.1. Vision 2020 and EDPRS...................................................................................15
3.2. Flagship programs.............................................................................................17
3.3. Decentralization................................................................................................21
3.4. Conclusions.......................................................................................................22
4. Review of the MDG Performance ...........................................................................23
4.1.1 Status and Trends: Target 1A (Poverty) .....................................................24
4.1.2 Status and Trends: Target 1B (Employment) .............................................28
4.1.3 Status and Trends: Target 1C (Hunger)......................................................29
4.2 MDG 2: Achieve Universal Primary Education ................................................34
4.2.1 Status and Trends: Target 2 (Primary Education).......................................34
4.3 MDG 3: Promote Gender Equality and Empower Women ...............................40
4.3.1 Status and Trends: Target 3 (Gender Equality) ..........................................41
4.4 MDG 4: Reduce Child Mortality.......................................................................45
4.4.1 Status and Trends: Target 4 (Child Mortality)............................................46
4.5 MDG 5: Improve Maternal Health ....................................................................50
4.5.1 Status and trends: Target 5A (Maternal Mortality).....................................51
4.5.2 Status and trends: Target 5B (Maternal Health) .........................................53
4.6 MDG 6: Combat HIV/AIDS, Malaria and other Diseases ................................57
4.6.1 Status and Trends: Targets 6A & 6B (HIV/AIDS).....................................58
4.6.2 Status and Trends: Target 6C (Malaria and TB).........................................62
4.7 MDG 7: Ensure Environmental Sustainability ..................................................67
4.7.1 Status and Trends: Target 7A (Sustainable development)..........................68
4.8 MDG 8: Global Partnership for Development...................................................77
4.8.1 Status and Trends: Target 8D (Debt problems) ..........................................78
4.8.2 Status and Trends: Target 8F (Access to ICT)............................................82
5. The unfinished business of MDGs and emerging priorities ....................................85
5.1 Combating poverty.............................................................................................86
5.2 Reducing Hunger ...............................................................................................86
5.3 Creating Employment........................................................................................87
5.4 Improving Education .........................................................................................88
5.5 Strengthening Gender Equality..........................................................................89
5.6 Fighting diseases................................................................................................90
5.7 Greening the Environment.................................................................................91
5.8 Promoting Accountable Governance .................................................................92
5.9 Conclusions........................................................................................................93
Annex 1: Note on Data Sources...................................................................................95
3. ii
Annex 2: Methodological Note....................................................................................97
Annex 3: List of persons interviewed ..........................................................................99
Annex 4: Terms used to describe Rwanda´s homegrown development....................100
Annex 5: References and Sources.............................................................................104
Annex 6: Composition of the Evaluation Team ........................................................107
List of figures
Figure 1: The conceptual framework guiding implementation of MDGs and EDPRS
..............................................................................................................................17
Figure 2: Percentage of people living below the National Poverty Line.....................24
Figure 3: Poverty rate, by District................................................................................25
Figure 4: Extreme Poverty...........................................................................................26
Figure 5: Proportion of population living in extreme poverty; by Province................26
Figure 6: Poverty Gap Ratio ........................................................................................27
Figure 7: Unemployment rate, 16 years of age and older............................................28
Figure 8:Underweight Children under 5 years of age..................................................29
Figure 9: Proportion of children under five years stunted ...........................................29
Figure 10: Proportion of children under five years wasted..........................................30
Figure 11: Proportion of people below minimum dietary intake.................................31
Figure 12: Net Enrolment in Primary School ..............................................................34
Figure 13: Net Enrolment Rate in Primary Education by Provinces...........................35
Figure 14: Primary Completion Rate...........................................................................36
Figure 15: Literacy Rate of 15-24 Years Old ..............................................................36
Figure 16: Disaggregated Literacy Rates for 15 to 24 year olds by provinces............37
Figure 17: Literacy of women and men aged 15 years and above...............................38
Figure 18: Ratio of Girls to Boys in Primary Education .............................................41
Figure 19: Ratio of Girls to Boys in Secondary Education .........................................41
Figure 20: Proportion of Seats Held by Women in National Parliament ....................42
Figure 21: Women’s Share in Wage Employment ......................................................43
Figure 22: Infant Mortality Rate..................................................................................46
Figure 23: Under-5 Mortality Rate ..............................................................................46
Figure 24: Infant Mortality, By Province ....................................................................47
Figure 25: Proportion of one-year-oldChildren Immunized against Measles .............48
Figure 26: Maternal Mortality Ratio............................................................................51
Figure 27: Births attended by Skilled Health Personnel..............................................51
Figure 28: Birth attended by skilled health personnel, the last 5 years, by province ..52
Figure 29: Adolescent birth rates, 2000/01-2010/11 ...................................................53
Figure 30: Antenatal care coverage – four visits, urban versus rural ..........................53
Figure 31: Contraceptive Prevalence Rate...................................................................54
Figure 32: Condom Use at Last High Risk Sex...........................................................59
Figure 33: Proportion of Population Aged 15-24 with Comprehensive Correct
Knowledge of HIV/AIDS ....................................................................................59
Figure 34: Ratio of school attendance of orphans to non-orphans aged 10–14 years .60
Figure 35: Rates of school attendance of orphans to non-orphans aged 10-14 years; by
Province ...............................................................................................................61
Figure 36: Proportion of population with advanced HIV infection using antiretroviral
drugs.....................................................................................................................61
Figure 37: Malaria Mortality Rate for adults and children over 5 years per 100.000 .62
4. iii
Figure 38: Malaria Mortality Rates among Children under-5 and over-5 years..........63
Figure 39: Proportion of children under-5 sleeping under insecticide-treated nets.....63
Figure 40: Children Under-5 sleeping under an ITN net; by Province........................64
Figure 41: Percentage of tuberculosis cases detected and cured under DOTS............64
Figure 42: Tuberculosis Mortality Rate per 100.000...................................................65
Figure 43: CO2 Emission Per Capita...........................................................................68
Figure 44: CO2 emissions per capita – a regional and global comparison..................69
Figure 45: Proportion of land covered by forest..........................................................70
Figure 46: Consumption of Ozone Depleting Substances ...........................................71
Figure 47: Proportion of population using an improved drinking water source..........73
Figure 48: Access to Safe Drinking Water by Province..............................................74
Figure 49: Access to Safe Drinking Water by District ................................................74
Figure 50: Proportion of population using an improved sanitation facility.................75
Figure 51: Access to Improved Sanitation Facilities by Province...............................75
Figure 52: Debt Service as a Percentage of Exported Goods and Services.................78
Figure 53: Donor support by modality compared to total ODA 2007–2009/10 in
million US$..........................................................................................................80
Figure 54: ODA and Domestic Revenues 2003–2011 in RWF Billions .....................81
List of boxes
Box 1: Imihigo at work in Kigali.................................................................................10
Box 2: Private sector in agriculture .............................................................................20
List of tables
Table 1: Progress in indicators, MDG 1 ......................................................................23
Table 2: Proportion of population living in poverty; by Province...............................25
Table 3: Unemployment rate (census figures).............................................................28
Table 4: Progress in indicators, MDG 2 ......................................................................34
Table 5: Net Enrolment Rates, Primary Education, 2008-2012 ..................................35
Table 6: Disaggregated Literacy Rates for 15 to 24 year olds.....................................37
Table 7: Progress in indicators, MDG 3 ......................................................................40
Table 8: Net Enrolment Rates, Primary Education, 2008-2012 ..................................41
Table 9: Net Enrolment Rates, Secondary Education, 2008-2012 ..............................42
Table 10: Progress in indicators, MDG 4 ....................................................................45
Table 11: Variations in infant and under-5 mortality rates (2010/11).........................47
Table 12: Children immunized against measles, disaggregated ..................................48
Table 13: Progress in indicators, MDG 5 ....................................................................50
Table 14: Birth attended by skilled health personnel over the last 5 years..................52
Table 15: Married Women 15-49 years using modern contraceptives........................54
Table 16: Progress in indicators, MDG 6 ....................................................................57
Table 17: Progress on indicators, MDG 7 ...................................................................67
Table 18: Progress in indicators, MDG 8 ....................................................................78
Table 19: Current Key Vision 2020 Targets................................................................86
5. iv
Table 20: Summary of Unfinished Business and Emerging Priorities 2015-2030......94
List of abbreviations
9YBE Nine Years Basic Education
AfDB African Development Bank
AIDS Acquired Immune Deficiency Syndrome
ART Antiretroviral Treatment
ARVs Antiretrovirals
CFCs Chlorofluorocarbons
CHW Community Health Workers
CIP Crop Intensification Program
CO2 Carbon Dioxide
CPAF Common Performance Assesment Framework
CPD Continuous Professional Development
DAD Development Assistance Database
DBS Direct Budget Support
DDPs District Development Plans
DHS Demographic and Health Survey
DOTS Directly Observed Treatment Short Course
DPs Development Partners
DPCG Development Partners Coordination Group
DRC Democratic Republic of Congo
EDPRS Economic Development and Poverty Reduction Strategy
EICV Enquêté Intégrale des Conditions de vie des
Ménages/Integrated Household Living Conditions Survey
FAO Food and Agriculture Organization
FONERWA Fund for Environment and Climate Change
FSWs Female Sex Workers
GBV Gender-Based Violence
GDP Gross Domestic Product
GGCRS Green Growth and Climate Resiliance
GMO Gender Monitoring Office
GNI Gross National Income
GoR Government of Rwanda
HCFCs Hydrochlorofluorocarbon
HIPC Heavily Indebted Poor Countries
HIV Human Immunodeficiency Virus
ICT Information and Communication Technology
IEC Information and Education Campaign
IMF International Monetary Fund
IPAR Institute of Policy Analysis and Research
IT Information Technology
ITN Insectside Treated Net
ITU International Telecommunications Union
JADFs Joint Action Development Forums
6. v
LED Local Economic Development
LLIN Long Lasting Insecticide Net
M&E Monitoring and Evaluation
MDGs Millennium Development Goals
MDRI Multilateral Debt Relief Initiative
MIGEPROF Ministry of Family and Gender Promotion
MINAGRI Ministry of Agriculture and Animal Resources
MINECOFIN Ministry of Finance and Economic Development
MSM Men having Sex with Men
MSMEs Micro, Small and Medium Enterprises
NGOs Non-Government Organisations
NISR National Institute of Statistics of Rwanda
ODA Official Development Assistance
ODS Ozone Depleting Substance
OECD Organisation for Economic Co-operation and Development
OLPC One Laptop per Child
OVC Orphans and other vulnerable children
PBHF Performance-Based Health Financing
PEPFAR Presidential Emergency Program for AIDS Relief
PMTCT Prevention of Mother to Child Transmission
PPA Participatory Poverty Assessment
PPP Public Private Partnerships
PPP Purchasing Power Parity
PRSP Poverty Reduction Strategy Paper
RBC Rwanda Biomedical Center
RDHS Rwanda Demographic and Health Survey
REMA Rwanda Environmental Management Authority
RWF Rwandan Franc
SBS Sector Budget Support
SSPs Sector Strategic Plans
SWAp Sector-Wide Approach
TB Tuberculosis
TVET Technical and Vocational Education and Training
TVs Televisions
UN United Nations
UNDP United Nations Development Programme
UNFPA United Nations Population Fund
UNICEF United Nations Children’s Organisation Fund
VCT Voluntary Counselling and Testing
VSAT Very Small Arpeture Terminals
VUP Vision 2020 Umurenge Programme
WHO World Health Organization
8. vii
FOREWORD
The government of Rwanda recognizes Millennium Development Goals (MDGs) as
benchmarks of the progress the country makes towards sustainable development.
Rwanda has demonstrated how agreed goals and determined action can deliver real
improvements for a country’s citizens.
Focus provided by the MDGs has been vital in delivering positive outcomes and used
as tool for framing policies and priorities to drive forward National Development
Agenda.
The Millennium Development Goals have been translated into the Economic
Development and Poverty Reduction Strategies (EDPRS I & II), which provide the
framework for the budget allocation of priority sectors and actions identified to ensure
that the MDG goals are met. In addition, the priority areas are also reflected in the
national framework – Vision 2020 – which outlines the country’s long-term
development targets.
Currently, Rwanda is among a few countries at the forefront in achieving Millennium
Development Goals. The country has made impressive progress on several MDGs,
especially in universal primary education; gender equality and women empowerment;
infant and maternal mortality; HIV prevalence; and environmental sustainability.
Many steps have been taken in bridging gender gaps through economic empowerment
programmes for women; women guarantee fund, women entrepreneurship program
and having rights to property and inheritance. The same spirit is captured in the
constitution which guarantees that 30% of leadership positions in parliament must be
held by women.
In the education sector, free education has been extended to cover 12 years of basic
schooling from the original 9 years, thereby including the entire secondary school
cycle. Introduction of performance-based financing in the health sector and
community-based health insurance are among other key achievements realized.
Collaboration among public, private, and nongovernmental organizations (NGOs),
has remained concrete, providing a common language and bringing together various
actors. This collaboration has brought about positive advancement in governance,
inclusive growth, economic transformation and the knowledge-based economy.
Today, farmers benefit from the Crop Intensification Program (CIP) which immensely
contributes to increased agricultural productivity and accrue the source of households’
revenues.
Indeed, the existing progress is as a result of a participatory approach between the
public and stakeholders by building partnerships to enhance mutual accountability. In
the process, the country has produced supportive evidences of the requirements to
develop the human and institutional capacities needed to deliver sustainable
development for Rwanda.
9. viii
As one of the countries piloting thematic areas of the post-2015 Sustainable
Development Goals, Rwanda upholds building effective institutions, good governance
and rule of law as key priorities for future development.
Rwanda recognizes the need to stay focused after the expiry of the Millennium
Development Goals at the end of 2015. Our institutions, public and private sectors are
obliged to keep up this commendable pace of economic transformation.
Amb. Claver GATETE
Minister of Finance and Economic Planning
10. ix
PREFACE
The Government of Rwanda has made achieving the Millennium Development Goals
(MDGs) central to its policy framework, as defined in the long term development
agenda, the Vision 2020, as well as the medium term strategies, EDPRS1 and EDPRS
2. The overriding long-term national development objective is to transform Rwanda
into a middle-income country by 2020.
For the last decade, Rwanda’s macroeconomic stability has been strengthened, and
important steps have been made in establishing the base for sustained growth and
further poverty reduction. These gains were particularly pronounced during the
implementation of EDPRS1, and they are clearly reflected in the high levels of
sustained and inclusive economic growth, expanded basic social services, significant
poverty reduction, gender empowerment and an overall impressive progress towards
most of the MDGs. This progress has been achieved not only thanks to the strong and
sustained political commitment at the highest level, but also with a significant
international support for well-designed and efficiently executed national scale
programs.
This is the fourth progress report on the MDGs for Rwanda, and it documents the
overall progress that the country is making towards reducing poverty and promoting
human development. It also discusses the redistribution efforts made by the
Government to address the spatial disparities observed in poverty alleviation and
access to health and education services, especially for women and youth.
We are now only one year away from the set deadline of the Millennium development
Goals, and the Consultations for the Post 2015 Development Agenda, in which
Rwanda is an active participant, are already underway. The findings of this report
give grounds for considerable optimism, not only for more progress towards the
achievement of the MDG goals by the end of 2015, but also for the potential for
success in the upcoming implementation of the post 2015 development agenda.
The UN family, together with other Development Partners, are indeed proud to be a
strong partner of the Government in its determination to assure a bright future for the
people of Rwanda.
Lamin M. Manneh
UN Resident Coordinator/ UNDP Resident Representative
11. 1
1. Introduction and the MDG Status at a Glance
This report is the fourth MDG Progress Report for Rwanda. It assesses the country’s
achievements in relation to the Millennium Development Goals (MDGs), including a
sub-regional disaggregation of data wherever possible and relevant. The country´s
generally impressive development performance has been tracked since the turn of the
century. Rwanda has produced three MDG Country Reports to-date, one in 2003,
another in 2007 and a third – still unofficial – in 2012, the latter based on 2010 data.
The 2013 Report draws on the data used in the first three reports and also presents
data gathered from the National Institute of Statistics Rwanda (NISR) primarily in its
Demographic and Health Survey (DHS) and Integrated Household Living Conditions
Survey (EICV), reports on the Economic Development and Poverty Reduction
Strategy (EDPRS), select sector ministry reports, donor reports, newspaper articles
and a few independent documents1
. It is especially important to point out that the
Report includes select data from the 2012 Census but only as complementary
information given that the Census does not directly track MDGs, and its purpose is
different than that of the household surveys used as primary data sources here. In
accordance with the Addendum to the Guidelines for the MDG Reports issued by the
UNDP in 2013, it covers a broader set of issues than previous reports. Thus, in
addition to the regular reporting on progress and challenges, it reflects on the national
milestones around the MDGs in the Rwandan development context, and identifies the
unfinished business that remains as well as emerging priorities.
The MDGs have played an important catalyzing role in the implementation of
national development policies in Rwanda by providing specific universally accepted
targets and indicators thus laying the foundation for a comparative perspective on the
country´s performance. They have informed and complemented national strategies as
laid out in Vision 2020 and the Economic Development and Poverty Reduction
Strategy (EDPRS1 and EDPRS2).
Rwanda´s progress toward the MDGs is largely a story of success as recognized
notably in 2013 by the United Nations´ MDG Africa Report issued jointly by the
African Union, African Development Bank, UN Economic Commission for Africa
and UNDP2
. In assessing country progress towards the MDGs, Rwanda among a
handful of countries, stands out as being on track to achieve almost all the Goals by
2015. Some targets have already been reached and in reference to others Rwanda is
likely to do so. Progress is especially notable in efforts to reduce the number of
people living in poverty and in hunger as well as in relation to key indicators in the
education and health sectors. Significant achievements have also been recorded in
1
For further information about methdological issues, see Annex 2.
2
UNDP 2013. Assessing Progress in Africa toward the Millenium Development Goals. Food Security
in Africa: Issues, Challenges and Lessons. New York: UNDP.
12. 2
other sectors such as the environment. Even where there are no set targets, the trend is
generally positive indicating that the country is moving in the right direction.
There are still areas that require enhanced efforts by the Government and other
stakeholders. These include getting women and youth into off-farm employment, and
in spite of general improvements in the health sector, reducing under-5 and infant
mortality rates, increasing the number of four times antenatal care visits, getting more
children to use antiretroviral drugs and, perhaps most of all, intensifying the fight
against HIV/AIDS.
The Government of Rwanda is aware of these shortfalls and is ready to make a
sustained effort to implement policies aimed at reaching these targets. Even if some of
them will not be reached by 2015, there is convincing evidence both in existing data
and current policy intentions that the country´s development performance will
continue to be going up rather than down.
Previous MDG reports have confirmed the progress that Rwanda has made but
because they were issued much earlier their focus was primarily on whether the
country was on track or not. It was more difficult in earlier reports to conclude with
any degree of certainty whether or not it would reach MDG targets. This 2013 Report
has been produced at a time when Rwanda is approaching the 2015 finish line. There
is greater certainty in what is said in this report because there is more extensive
longitudinal data available and with the finish in sight it is also easier to sketch what
is likely to happen by 2015. Against this background, it is especially important to
point out that this Report is the most positive of all the four MDG reports. In other
words, Rwanda has done better than what was expected in previous years. The details
of the country performance are shown at a glance below and are further discussed
MDG by MDG in Chapter 4.
The Report uses three colours: “green” when a target has been achieved or exceeded;
“yellow”, when likely to be achieved; and “red” when not likely to be achieved.
Target Assessment Legend
Not Likely to be Achieved
Likely to be achieved
Already Achieved/Exceeded
13. 3
Status at a Glance
Baseline
2000
2005/6 2010/11
2015
Target
Target
Status
Goal 1: Eradicate Extreme Poverty and
Hunger
Target 1A: Halve between 2000 and
2015 the proportion of people in
poverty
1.1a: Percentage of population below
the National Poverty Line3 60,4% 56,7% 44,9% 30,2%
1.1b: Extreme Poverty4
40% 36% 24,1% 20%
1.2: Poverty Gap Ratio at $1 a day
(PPP), percentage
24.4% 22.3% 14.8% 12.2%
1.3: Share of poorest quintile in
national consumption
4,6% 5,2%
No
Target
Target 1B:Achieve full and productive
employment and decent work for all,
including women and young people
1.5: Unemployment rate 16 years of
age and older5 1,4% 1,6% 0,9%
No
Target
Target 1C: Halve, between 2000 and
2015, the proportion of people who
suffer from hunger
1.8a: Percentage of underweight
children under five years.
24,3% 18% 11,4% 12,2%
1.8b: Child malnutrition (% of under
five children stunted)6 42,6% 51% 44,2% 24.5%
1.8c: Child malnutrition (% of under
five children wasted)7 6,8% 5% 2,8% 2%
1.9: Proportion of population below
minimum level of dietary intake.
40% 35,8% 24,1% 20%
Goal 2: Achieve Universal Primary
Education
Target 2A: Ensure that by 2015
children everywhere, boys and girls
alike will be able to complete a full
course of primary schooling
3
The use of national poverty line is allowed and replaces the official MDG indicator of the % of the
population under $1.00 per day. It is based on the cost of buying the minimum food consumption
basket plus an allowance for essential non-food consumption.
4
Not an official MDG Indicators, but tracked by the Government of Rwanda
5
The indicator used here is the % of unemployed over age 16 instead of the official indicator -
Employment-to-population ratio
6
Not an official MDG Indicator. The Government of Rwanda tracks progress on this indicator, which
is related to UN MDG 1.8
7
Not an official MDG Indicator . The Government of Rwanda tracks progress on this indicator, which
is related to UN MDG 1.8
14. 4
Baseline
2000
2005/6 2010/11
2015
Target
Target
Status
2.1: Net enrolment rate in primary
school8 72,6% 86,6%
96,5
(2012)
100%
2.2: Proportion of pupils starting
grade one who reach last grade of
primary school
22% 51,7%
72,7%
(2012)
100%
2.3a: Literacy rates of women and
men aged 15 -24 years
57,4% 76,9% 83,7%
No
target
2.3b: Literacy rates of women and men
aged 15 years and above9 52,4% 65,3% 69,7%
No
target
Goal 3: Promote Gender Equality and
Empower Women
Target 3: Ensure that gender disparity
in primary and secondary education is
eliminated, preferably by 2005, and in
all levels for education no later than
2015
3.1a: Ratio of girls to boys in primary
school10 1,00 1,03 1,03 1,00
3.1b: Ratio of girls to boys in
secondary school11 0,51 0,81 0,93 1,00
3.2: Share of women in waged
employment in the non-agricultural
Sector
7,6% 13,7% 18,1% 50%
3.3: Percentage of seats held by
women in national parliament 26% 48,8%
64%
(2013)
50%
Goal 4: Reduce Child Mortality
Target 4: Reduce by two-thirds
between 2000 and 2015 the under-five
mortality rate
4.1: Under-five mortality rate per
1000 live births
196,2 152 76 50.1
4.2: Infant mortality rate per 1000 live
births
107 86 50 28.2
4.3: Proportion of one-year-old
children immunized against measles
87% 85,6% 95% 100%
Goal 5: Improve Maternal Health
Target 5A: Reduce by three-quarters,
between 2000 and 2015, the maternal
8
Rwanda only has % data available for this indicator. The formulasderived from UNESCO’s Education
Indicators Technical Guidelines
9
Not an official MDG Indicator, but tracked by the Government of Rwanda, Related to Indicator 2.3a
10
Gender Parity Index (GPI), is the ratio between the Gross Enrolment Ratio (GER) of girls and that of
boys
11
Ibid
15. 5
Baseline
2000
2005/6 2010/11
2015
Target
Target
Status
mortality ratio
5.1: Maternal mortality ratio - deaths
per 100.000 live births
1071 750 476 268
5.2: Proportion of births attended by
skilled health professionals
31% 39% 69%
No
target
Target 5B: Achieve by 2015 universal
access to reproductive health
5.3a: Married Women 15–49 years
using modern contraceptives
4,3% 10,3% 45,1%
No
Target
5.3b:All Women 15–49 years using
modern contraceptives 5,6% 25,2%
No
Target
5.4: Adolescent birth rate (% total live
births) 5,2% 4,2% 4,1%
No
Target
5.5a: Antenatal care coverage at least
one visit 92,5% 94,4% 98% 100
5.5b: Antenatal care coverage at least
four visits 10,4% 13,3% 35,4% 100
5.6: Unmet need for family planning
for married women
36% 37,9% 18,9%
No
Target
Goal 6: Combat HIV/AIDS. Malaria
and Other Diseases
Target 6A. Have halved by 2015 and
begun to reverse the spread of
HIV/AIDS
6.1: HIV prevalence rate amongst
population aged 15–2412 1,0% 1,0%
No
Target
6.1a: HIV prevalence rate amongst
women 15-49 & men 15-5413 3% 3%
No
Target
6.2: Use of condom last high risk sex
Male - 39.5% 66.2%
No
Target
Female
-
19,7%
26
28,5%
42%
No
Target
12
This information stems from those who agreed to be tested during the DHS2 and DHS3 surveys
13
Not an official MDG Indicator. This information from those who agreed to be tested during the DHS
2 and 3 surveys
16. 6
Baseline
2000
2005/6 2010/11
2015
Target
Target
Status
6.3: Proportion of population aged 15–
24 years with comprehensive correct
knowledge of HIV/AIDS
Male 53,6% 47,4%
No
Target
Female 50,9% 52,6%
No
Target
6.4: Ratio of school attendance of
orphans to non-orphans aged 10–14
years
0,8 0,92 0,91
No
Target
Target 6B: Achieved by 2010 universal
access to treatment for HIV/AIDS for
all those who need it
6.5: Proportion of population with
advanced HIV infection using
antiretroviral drugs
Target
data was
2010
Adults 86,6% 100%
Children 53,9% 100%
Target 6C: By 2015 have halted and
begun to reverse the incidence of
malaria and other major diseases.
6.6a: Malaria incidence rates per
100.000
26 13
Halt and
reverse
6.6b: Malaria mortality rate over 5
years of age per 100.000
52 37,7
Halt and
reverse
6.6c: Malaria mortality rate children
0–5 years per 100.000
41
6.7: Proportion of children under five
sleeping under an insecticide-treated
bed nets
5% 59,7% 69,6%
No
Target
6.9: Tuberculosis Mortality rate per
100.000
48 21 12
Halt and
reverse
6.10: Percentage of tuberculosis cases
detected and cured under DOTS
23% 43% 60%
Halt and
reverse
Goal 7: Ensure Environmental
Sustainability
Target 7A: Integrate the principles of
sustainable development into the
country’s policies and programmes and
reverse the loss of environmental
resources
7.1: Proportion of land covered by
forest.
12,4% 20%
24,5%
(2013)
25
17. 7
Baseline
2000
2005/6 2010/11
2015
Target
Target
Status
7.2 CO2 emission per capita – parts
per million
0,082 0,055 0,055
No
Target
7.3a Consumption of ozone depleting
substances – CFCs – DOP Metric tons
30,1 12 0,0 0.0
7.3b Consumption of ozone depleting
substances – HCFCs - DOP Metric tons
0,3 3,1
4,4
(2012)
No
Target
Target 7C: Halve by 2015 the
proportion of people without
sustainable access to safe drinking
water and basic sanitation
7.8: Proportion of population using an
improved drinking water source
64,1% 70,3% 74,2% 82%
7.9: Proportion of population using an
improved sanitation facility
51,5% 58,5% 74,5% 74,5%
Goal 8: Develop a Global Partnership
for Development
Target 8.D: Deal comprehensively with
the debt problems of developing
countries through national and
international measures in order to make
debt sustainable in the long term
8.12: Debt service as percentage of
exports goods and services
No
Baseline
8% 10,13% 10%
Target 8.F: In cooperation with the
private sector. Make available the
benefits of new technologies -
especially information and
communications
8.14 Telephones - percentage of
households with either a land line or
mobile phone
No
Baseline
65%
(2013)
No
Target
8.15 Internet users
No
Baseline
20%
(2013)
No
Target
18. 8
2. Rwanda: Its development context
As the country is marking the 20th
commemoration of the Genocide against the Tutsis,
it is important to remember that twenty years ago Rwanda was a shell of a nation. In
July 1994, approximately one million people or more14
had been killed meaning more
than 400 lives were lost every hour in the 100 days the genocide continued. In
addition, millions of Rwandans were displaced from their homes as they fled, most to
neighbouring countries. Its institutions and system of government had been destroyed,
trust among its people lost. As Tony Blair, the former British Prime Minister, notes
about the country: “Rwanda, desperately poor, without skilled labour and resources
and the people demoralized and divided, found itself in an unprecedented situation”15
.
It had to start all over again.
The country´s post-genocide development strategy rests on the premise that security
and stability must be sustained at whatever cost. In pursuing its development
ambitions, initially slowly but in recent years in accelerated fashion, the Government
believes that uniting its people behind the common cause of progress is the most
effective way of creating a new national, Rwandan, rather than Tutsi, Hutu and Twa
identity. Sustaining this unity has been crucial to its economic and social
development.
Boosted by an average annual economic growth rate of more than 10% in the decade
after 1995, this momentum has been sustained culminating in a perfect developmental
"hat trick" of sustained economic growth, poverty reduction and a reduction in
income inequality in 201216
. Despite the disruptions caused by the 2008-9 global
financial crisis, during 2005-11, annual economic growth grew by a robust 8% on
average, the headcount poverty and extreme poverty ratios both fell by nearly 12
percentage points, taking a million people out of poverty, and income inequality
declined17
.
The Government has undertaken a number of reforms and other initiatives including
reforming the public financial system to make it comply with international good
practice. These institutional reforms have set the framework for the country´s
remarkable economic progress with high growth rates and investments flowing into
the country. Despite having little in terms of natural resources, the country is
economically vibrant. Public policy reforms don´t remain only on paper; they are
being vigorously implemented.
The reforms and the political will that Rwanda has demonstrated in the last two
decades have earned it the trust and confidence of its Development Partners (DPs) as
14
Tony Blair, ”20 years after the genocide, Rwanda is a beacon of hope”, The Citizen (Dar es Salaam),
April 8, 2014
15
.Ibid.
16
Republic of Rwanda 2013a. Economic Development and Poverty Reduction Strategy 2013-2018
(EDPRS2). Kigali: Ministry of Finance and Economic Planning, p. 1.
17
Ibid, pp 3-4.
19. 9
confirmed in the review of progress toward achieving its Paris Declaration targets
ahead of the 2011 Busan meeting in which the country ended up as one of two top
performers18
and in the 2013 Africa MDG Report cited above in the Introduction19
.
Rwanda´s achievements have also been acknowledged in NGO circles. In a 2013
report issued by ONE20
, Rwanda is ranked first among 48 African countries that have
registered substantial progress in achieving the MDGs21
.
Because of the confidence that the DPs have shown in the Government, they have
been ready to finance a considerable chunk of its development programs. The foreign
aid component has at times covered up to 50% of the development budget but since
the Government has made good use of these external funds it has been less of an issue
than in other countries with no such sterling record. What is more, the Government
has done its best to hold individual donor agencies and governments accountable for
their own commitments ranking them according to how well they live up to the Paris
Declaration targets.
Like every country, Rwanda faces its challenges as well as opportunities. The rest of
this chapter, therefore, will address in greater detail the factors that facilitate or may
hinder the country´s development, especially as it relates to reaching the MDGs.
2.1 Enabling factors
Enabling factors are those that facilitate the implementation of public policies.
Perhaps most important is the presence of political will – a commitment by
government leaders to act on its promises and commitments. Rwanda´s development
has benefitted tremendously from the existence of a strong political will. The country
has taken pride in showing its ability to move ahead. Like its own Vision 2020, the
MDGs serve as valuable catalysts for doing so. For a country that is so committed to
avoid a repetition of its troubled past, registering progress on a set of global indicators
is especially significant. Moving upward on these global scales helps generate
approval by development partners and a willingness to fund Rwanda´s policies.
Needless to say, it also enhances the task of building the nation afresh.
While the political will to adhere to the MDGs is an integral part of the country´s
human development success, it is also attributable to strong institutions. An important
mechanism for ensuring discipline and accountability in the public service has been
the use of performance contracts (imihigo). These contracts are embedded in relevant
local cultural norms and practices and thus relatively easy for officials to adopt.
18
OECD 2011. Evaluation of the Implementation of the Paris Declaration: A Synthesis Report. Paris:
OECD-DAC.
19
UNDP 2013.
20
A global campaign and advocacy organization of more than three million people taking action to end
extreme poverty and preventable diseases.
21
New Times (Kigali), May 29, 2013.
20. 10
Taken together, a “development state”, i.e. one that takes a strong and disciplined
approach to steering progress in a certain direction, and community mobilization are
cornerstones of Rwanda´s policy to transform the country toward a middle-income
level by 2020. The political settlement that permits this comprehensive approach in
which state and society both play an important role has been successfully upheld for
some fifteen years. Although there have been incidents of opposition to this
successful approach, the settlement has prevented Rwanda from turning back towards
the “ethnicized” politics that characterized the country during its first three decades of
independence.
Box 1: Imihigo at work in Kigali
Because of its unique history and the perceived inevitability to avoid a repetition of
the 1994 Genocide against the Tutsis, the MDGs have been quite effectively
mainstreamed into the country´s own development strategy. “Vision 2020” which was
adopted just before the turn of the century, together with EDPRS1 and EDPRS2,
offers policy perspectives identical to the MDGs. Although the national vision and
strategy are broader, there is a mutual reinforcement between the global goals, on the
one hand, and the national ones, on the other.
The trust and confidence that Rwanda has earned among its DPs is another enabling
factor. Rwanda’s Aid Policy articulates a clear framework for coordination of
development assistance, and the policy dialogue between Government and donors has
been frank and regular. Several platforms exist to promote effective dialogue between
government and the donor community. Development partners participated actively in
the preparation of Rwanda’s poverty reduction strategies, and in the mechanisms to
monitor its implementation. The Development Partners Forum, held annually,
provides a high level platform to discuss economic developments, aid coordination as
CEOs the world over seeking ways to boost their organizations’ productivity could
do worse than take a look at the Rwandan concept of imihigo. An essentially
untranslatable Kinyarwanda word, it’s usually rendered as “performance contract”;
sometimes just “goal” or “target”. But none begin to do the idea justice. Signed
imihigos carry far greater moral force and, increasingly prevalent in the public
sector in Rwanda, they indicate an utterly unshakeable determination to succeed in
one’s objective, come what may. To judge by the extraordinary level of civic pride
in the streets not just of Rwanda’s capital, Kigali, but in other cities as well, they
work. The spirit of imihigo seems visible in every immaculately manicured public
garden, every mown verge, every neatly painted kerbstone, every storm drain into
which not so much as a cigarette butt has been dropped. Kigali must surely be one
of the most litter-free cities in the world. This all stems, Rwandans indicate, from
their feeling that not much short of total perfection can atone for the country’s
recent history and ensure it will be remembered for something other than the 1994
genocide.
http://www.ifrc.org/ar/noticias/noticias/africa/rwanda/rwanda--un-imihigo-pour-la-reduction-des-
risques/#sthash.QI7UBZEr.dpuf
21. 11
well as progress in the implementation of the Government´s development plans,
including the MDGs. The Development Partners Coordination Group (DPCG),
comprised of representatives of government
and the development partners, meets every
quarter to discuss routine aid coordination
matters. Government, jointly with these
partners, has developed a Common
Performance Assessment Framework (CPAF)
based on EDPRS indicators, which also provide
the triggers for review and assessment of the MDGs.
The target year for Rwanda´s development ambitions tends to be perceived by
national stakeholders as 2020 when the current policy vision comes to an end. 2015 is
seen as a mid-term point. As President Kagame, who chairs the Global MDG
Advocacy Group, said at its meeting in New York in September 2013: the MDGs are
not a ceiling but a floor!22
It is necessary to think beyond 2015 and adjust policies
according to changes in the global and regional environment as well as lessons
learned.
2.2 Challenges
Each country faces challenges as it undergoes change. Some are related to the
tensions that arise as socio-economic conditions change; others to shortage of
financial and staff resources. They can usually be handled in the political or
managerial fields. The challenges that tend to be more difficult to tackle are those that
are related to underlying structural conditions that only change slowly. Development
in any African country is a long distance race, not on a smooth track but through
difficult terrain. Rwanda, notwithstanding its achievements, is no exception. It has
covered more distance than most other countries in Africa, but it faces several
remaining challenges as seen through a MDG lens.
Rwanda´s ambition to become a middle-income country by year 2020, which is laid
out in Vision 2020, is challenged by a number of structural factors that Rwanda faces
because of its geo-political situation. Five such challenges are especially significant.
The first is the country´s landlocked position. Costs of imports and exports are
aggravated by being located far from the sea. Rwanda is a champion of closer
cooperation within the East African Community. More recently, it has worked closely
with Kenya and Uganda to build a broad-gauge (1400 cms) railway from the port of
Mombasa that would allow for larger volumes of goods to be transported faster.
Rwanda also keeps the door open to possible railway links through Tanzania. These
infrastructural investments will take time to materialize but are critical to Rwanda´s
ability to continue its remarkable progress.
22
http://rwandaun.org/site/2013/09/25/president-kagames-address-at-the-opening-of-the-special...
The MDGs are not a ceiling
but a floor
President Paul Kagame, New
York, September 13, 2013
22. 12
The second challenge is its location in a region that in recent years has been plagued
by conflict and violence. Eastern Congo, which borders Rwanda has suffered from
civil war that has incurred a vast number of deaths and violence against innocent
civilians, not least the women, many of whom have been raped by soldiers or
militiamen. The insecurity in that part of DRC is in part a product of the events that
followed the Genocide against the Tutsis with the exodus of large numbers of
Rwandans to that country some of whom have taken up weapons to try to fight their
way back to Rwanda. The Government of Rwanda has made every effort to ensure
that the conflict does not spread to its own territory even if this has at times led to
criticism from the international community. Being so close to the conflict zone and
finding itself challenged by what is going on there has implications for how potential
investors are likely to look at Rwanda. With the aim of increasing numbers of
Rwandans in formal sector employment this is
a significant challenge.
The third challenge is the country´s high
population density. With its 10,5 million
people crowded on a small geographical
territory, Rwanda has the highest population
density in Africa. Household plots in the rural
areas are often subdivided and too small to
render sustainable cash incomes. Through its
Crop Intensification Program (CIP) the
Government is pursuing a policy of intensified
terracing on the many hillsides around the
country with the double aim of increasing
agricultural productivity and enhancing
sustainable land use. It is also encouraging
forms of cooperative farming that would allow
for more productive use of these small farm
plots. Such measures notwithstanding,
population growth and migration to urban
areas are likely to be increasingly serious
challenges for sustaining the gains already
made toward the MDGs and Vision 2020
although a number of interventions have been
introduced to tackle rapid population growth
rate. For instance secondary cities have been
pro-actively developed to serve as poles of growth thereby reducing pressure on
Kigali City.
The fourth challenge is to reduce dependence on foreign aid and increase the domestic
revenue base and thus tax collection. Rwanda has benefitted considerably in its effort
to reach the MDGs from support by the DPs. They have been an integral part of the
“We appreciate support from
the outside, but it should be
support for what we intend to
achieve ourselves. No one
should pretend that they care
about our nation more than
we do; or assume that they
know what is good for us
better than we do ourselves.
They should, in fact, respect
us for wanting to decide our
own fate.… While this is
encouraging, we know the
road to prosperity is a long
one. We will travel it with the
help of a new school of
development thinkers and
entrepreneurs, with those
who demonstrate they have
not just a heart, but also a
mind for the poor.”
President Paul Kagame on
foreign aid, Financial Times,
May 8, 2009
23. 13
success, especially in the social sector programs. The DPs, however, have signalled
that they will reduce their aid allocations and several of them have at times suspended
their aid for political reasons delaying implementation of vital schemes.
The Rwandan Government on its part is ready to find ways of reducing its relatively
high level of aid dependency. The government has successfully increased the
domestic revenues to GDP ratio in the past several years, but the level is still below
the regional average23
. Consequently, reductions in foreign aid constitute a challenge
for sustaining the achievements made especially in the education and health sectors. A
diversification of donor funding is taking place with additional partners in Asia and
the Middle East interested to support programs in Rwanda. For example, President
Kagame attended the Third Africa-Arab Summit in Kuwait in November 2013
confirming the growing interest that Gulf countries and their development funds have
in African countries like Rwanda. In the longer run, however, increased domestic
revenue collection is necessary. The Government is devising policies to do so but the
narrow revenue base remains a challenge as long as the private sector is less
developed.
The fifth challenge is turning the country into an IT-literate nation. The MDGs list
Internet penetration as a key metric in efforts to reduce poverty and encourage
rational development. Rwanda on its part has an ambitious national strategy to
achieve such penetration focused on providing a modern communications
infrastructure for public and private uses. As a result, Rwanda today enjoys increased
nation-wide coverage of telecommunications networks and has deployed a versatile
and high capacity national optic fiber backbone network and a national data center.
Rwanda sees itself as now being well positioned to become a regional ICT hub that
can offer a wide range of competitive ICT products and services.24
The supply side of ICT, therefore is well developed but the challenge is to make the
ordinary Rwandan increasingly IT-savvy. This is a necessity as the country tries to
transform itself into a middle-income one. The spread of smart phones is facilitating
this. For example, cash transfers are now increasingly made by people without access
to regular banking services through the use of such phones. The policy of providing a
computer for each child is another important step in this direction. In the long run, this
process will also be facilitated by increasing numbers of people being lifted out of
poverty and many moving to urban centers. These factors notwithstanding, making
people IT-literate is a matter of changing cultural and social attitudes, especially with
regard to participation in e-governance, which is part of the national strategy.
2.3 Conclusions
Rwanda is making its achievements toward the MDGs thanks to a strong political
commitment, right policies and institutions that people can relate to. There is a
23
World Bank, Rwanda Overview, updated 4 April 2014
(http://www.worldbank.org/en/country/rwanda/overview)
24
Rwanda ICT Strategy 2013/2018 (www.myict.gov.rw/ict/strategy/)
24. 14
national ownership involving stakeholders from all sectors that is not matched in
many other African countries – or countries elsewhere in the world. These institutions
constitute the basis for further enabling, wherever necessary and possible, gains
towards a sustainable human development. The country is still to reach some of the
MDG targets. Furthermore, there are many implementation hurdles to overcome such
as limited infrastructure, insufficient skilled and technical staff in many sector
ministries and in the districts, standards in schools that need further improvement, and
low use of contraceptives. These hurdles, however, are not insurmountable and given
trends to date, as this Report confirms in regard to the MDG targets, they are likely to
be successfully overcome.
25. 15
3. National Milestones around the MDGs
The MDGs have played an important role in reinforcing and strengthening Rwanda´s
ability to implement its Vision 2020. This is evident at three levels. At the strategic
level it relies on its Vision 2020 and EDPRS. At program level it relies on a series of
flagship programs to implement the national strategy. At management level, it falls
back on decentralization of responsibilities to district and lower levels to encourage a
people-centered approach to development.
Rwanda has prioritized implementing and monitoring the MDGs ever since they were
adopted and launched as evident in the progress reports from 2003, 2007 and 2012. In
the first few years, the Government and its development partners relied significantly
on the country´s first Poverty Reduction Strategy Paper. Following its expiration in
2005 Government adopted EDPRS1 with a broader development objective combining
both economic and social indicators. The strategy, since 2013 in its second phase
(EDPRS2), has provided the framework within which domestic and external resources
are channelled for accelerating the implementation of the MDGs.
3.1. Vision 2020 and EDPRS
Rwanda’s long-term development goals are embedded in its Vision 2020, which seeks
to transform Rwanda from a low-income agriculture-based economy to a knowledge-
based, service-oriented economy by 2020. In moving forward the Vision emphasizes
the importance for Rwandans to create an efficient state and the development of
skilled human capital, a vibrant private sector, a world-class infrastructure, a modern
agriculture and a system of accountable governance. Thus, the Vision covers all
aspects of the country´s development.
EDPRS puts the Vision into practice. It is sufficiently comprehensive and broader
than the MDGs, which cover key aspects of the Vision and the EDPRS1 and
EDPRS2, but focuses more on the social than the economic side of the country´s
development. The adoption of Vision 2020 in 2000 and the EDPRS1 in 2006 are
national milestones that have had a direct bearing on Rwanda´s success in moving
forward toward the MDGs.
EDPRS1 was based on three pillars to accelerate economic growth and sustainable
human development. The first pillar focused on investing in the improvement of the
business climate to achieve private sector growth and an ensuing growth of jobs and
exports. The second entailed strategies for the promotion of pro-poor rural
development and social protection aimed at eliminating extreme poverty by 2020 and
thus releasing the productive capacity of the very poor. The third, being good
economic and accountable governance by creating a comparative advantage in “soft”
infrastructure to compensate for the country´s poor hard infrastructure and
disadvantaged geographical location, EDPRS 2 is made up of four thematic areas of
26. 16
Economic Transformation, Rural Development, Accountable Governance and
Productivity and Youth Employment as well as foundational and cross cutting issues.
The Economic Transformation Thematic Area targets accelerated economic growth
through restructuring of the economy towards more services and industry thereby
enabling average growth rate of 11,5%. Rural Development focuses on ensuring that
poverty is reduced from 44,9% to below 30% mainly through increased agricultural
productivity and enhanced linkages of social protection programs. The main objective
of Productivity and Youth Employment Thematic Area is the creation of at least
200.000 new jobs annually and ensuring that growth and rural development are under
pinned by appropriate skills and productive employment. On the other hand, the
Accountable Governance Thematic Area aims at improving the overall level of
service delivery and ensures citizen satisfaction above 80%.
At an operational level EDPRS is implemented through a set of Sector Strategic Plans
(SSPs) and District Development Plans (DDPs), which are both five-year strategic
plans. They are detailed documents, which support implementation of national
priority programs at sector and district levels. The SSPs contain sector level (national)
priorities while DDPs contain district (local and grassroots) priorities. The DDP
balances national with local development priorities. The SSPs help guideline
ministries and agencies in elaborating their annual work plans while DDPs do the
same for districts. Both SSPs and DDPs were developed through a participatory
process engaging various stakeholders in Sector Working Groups (SWGs) and Joint
Action Development Forums (JADFs) and do guide sector Ministries, Agencies and
Districts during the annual planning and budgeting processes. These platforms have
been used regularly to discuss development issues and promote dialogue at central
and district levels in implementation of the Country's development plans. Thus, as
illustrated in Figure 1, through these links between the overall national strategy
document and more operational entities at ministerial and district levels, EDPRS
serves as a key mobilization and management tool for also achieving the MDGs.
27. 17
Figure 1: The conceptual framework guiding implementation of MDGs and EDPRS
Source: Republic of Rwanda 2013b.
3.2. Flagship programs
Another important milestone is the adoption of a series of interrelated programs to
tackle poverty reduction while also encouraging poor people to become increasingly
self-reliant. These programs operate in tandem at local levels and are the main reason
why the country has been able to move forward on so many fronts at the same time.
Four such programs deserve special mentioning here.
Vision 2020
EDPRS
MDGs
Sector
Strategies
District Development
Plans
MTEF
Annual Action Plans Annual Action Plans
Annual Budget
Monitoring and Evaluation
28. 18
The first is the Vision 2020 Umurenge Program that was launched in 2008 in 30
sectors (umurenge) beginning with the poorest such units. It has since expanded to
cover 240 out of the country´s 416 sector units. It is a multi-purpose program that
combines social protection with economic tools of moving out of poverty while also
providing technical advice on a number of issues from nutrition, family planning,
disease control and prevention. It has three major components.
One is the direct support given to the two poorest household categories based on a
traditional Rwandan classification system called ubudehe. It covers elderly and
disabled as well as households that are unable to generate an income of their own. In
early 2013 over 43.617 households benefitted from such direct support by the state,
up from 6.850 in 2009. Another is public works. It benefitted some 89.011 households
by early 2013, an increase from 17.886 in 2009. Each household can provide one
member for these public works schemes that focus largely on building terraces for
more productive agriculture or on roads maintenance and construction. This second
component is meant to make wage income outside of subsistence farming available
and thus allow households to buy food and other items to improve their livelihoods. A
third component is for those who already have some money but are ready to move
ahead earning more. Thus, the principal mechanism is a credit scheme. In early 2013
a total of 12.500 loans had been issued with 52.000 households as prospective
beneficiaries.
The second flagship program is the One-Cow-per-Poor-Family Program (Girinka). It
has been implemented since 2006 and places special emphasis on vulnerable groups
like child-headed and female-headed households, disabled and genocide widows. By
aiding to enhance nutrition among household members, it is an important mechanism
for tackling high
malnutrition rates among
under-5 children. It has
received wide support from
stakeholders and rural
households throughout the
country.
The main activity under this
program is the distribution
of heifers that have been
inseminated before being
passed on to farmers. The
cattle are intensively managed (by zero grazing) and as soon as they deliver, the
farmer has a ready source of income through the milk that is produced by the cow25
.
Furthermore, the first female calf is passed onto another beneficiary so the farmer gets
to “pay” for the cow that was given to him or her. Complementary to the program, in
25
http://www.minagri.gov.rw/index.php%3Fid%3D28.htm
“The main benefit of my goats so far is
manure. It is enabling me to grow more food:
cabbages, carrots, green peppers, maize and
sunflowers. Once my family has eaten, I share
my vegetables with my neighbours, and still
have a surplus to sell. I will also sell my goats’
kids when they are old enough.”
Hosea Ngiruwonsanga, farmer, Rwanda
http://www.asfg.org.uk/successtories/
29. 19
some instances depending on local circumstances, the livestock that is given out are
dairy goats.
The third flagship program is the Crop Intensification Program (CIP), which is run by
the Ministry of Agriculture and Animal Resources (MINAGRI). Started in 2007, CIP
aims to improve agricultural productivity using a multi-pronged approach involving
(a) distribution of new seeds, (b) provision of fertilizers, (c) land consolidation, (d)
improved extension services and (e) better post-harvest handling and storage. Low
productivity in Rwanda has been mainly attributed to minimal use of inputs. In a
vicious cycle, the low productivity continues to prevent farmers from using inputs, as
many farmers barely produce sufficient food to feed their family, and therefore have
no income with which to purchase yield enhancing inputs. CIP tries to break this
cycle by adopting a ‘supply-push’ approach whereby the government initially
supplies the inputs and the farmers are persuaded to use them.
The CIP has been generally quite successful in its first years. For instance, an
evaluation of the fertilizer input scheme indicates that the average fertilizer use per
household went up from 8 Kg/Hectare in 2006 to 33 Kg/Hectare in 201026
Together
with the relative success of the other components, crop yields have shot up: that of
maize, wheat and cassava has tripled; that of beans doubled. These figures are
significant because more than 80% of the MDG1 target group live in rural areas.
Although land consolidation is a difficult and culturally sensitive issue progress has
been made also in regard to this component.
The country has shown that it is fiscally manageable to achieve food security through
input supply as the multiple CIP impacts confirm. It has turned Rwanda from being a
food-insecure country to one with improved food security. The increased profitability
through crop production has uplifted the economic well being of thousands of farmers
and farm families. The consolidated use of land and synchronization of crop activities
during the season have generated large-scale employment opportunities for men and
women. CIP has spawned several microenterprises and small businesses in
processing, trading, and transportation of farm inputs and produces in rural areas. Its
future challenge is to transit from being a primarily aid-funded program to one that
relies on market mechanisms to reproduce and sustain itself (see Box 2 next page).
26
Ministry of Agriculture 2011. About Crop Intensification Programme. Kigali: MINAGRI.
30. 20
Box 2: Private sector in agriculture
The fourth flagship
program that is yet to have
a similar impact because
its lead time is inevitably
longer is the “One Laptop
per Child” (OLPC)
Program. It was launched
in 2008 with the aim of
enhancing education
through the introduction
of technology in primary
schools. It allows primary
school students early
access to computer skills
and computer science understanding while expanding their knowledge on specific
subjects like Science, Mathematics, languages and Social Sciences through online
research or content hosted on servers.
The current proposed target is to provide all students from P4 to P6 access to laptops.
By the end of 2013, 203.000 laptops had been deployed to more than 407 schools
across the country. Furthermore, 200 schools had each received one server to host
digital courses and books, one wireless local area network and digital courses aligned
“Government has been prioritizing agriculture but we cannot do it on our own as there
are other priorities like infrastructure development as well. We need the private sector to
take over from what the government has so far achieved…..The private sector should take
advantage of the numerous investments the government has made to build smallholder
capacity and benefits of consolidation of resources…..We have demonstrated that
agriculture can greatly reduce poverty. We have so far been able to reduce it by 12 per
cent taking about a million farmers out of poverty (under EDPRSI). We are trying to see
how we can interest the private sector to tap into and develop further what we have been
creating in a sector where we have land to give to investors,
You can work with the small scale farmers in the country in value addition. You can
invest in farmers and get produce from them as already there is consolidation and do what
farmers cannot afford to invest in. We need people to invest in the value chain and are
working to strengthen that position. In production dynamics, many a time the private
investors know what’s best more than government,”
Minister Agnes Kalibata addressing the ”Cracking the Nut” Conference, New Times, 15
January 2014.
“Today, local governments in Rwanda are
capable of handling complex tasks, which were
previously unheard of in local governments set
up.......... This is a result of capacity building
initiatives since the start of decentralisation.”
Commonwealth Report on the Aberdeen
Principle to promote local democracy in
Rwanda authored by the Rwanda Association of
Local Government Authorities and the Ministry
of Local Government, Kigali, May, 2013.
31. 21
with the curriculum in key subjects27
. In implementing the Program, the OLPC works
hand-in-hand with both non-governmental organizations and educational institutions
such as the National University of Rwanda and Kigali Institute of Science and
Technology.
3.3. Decentralization
Another milestone that has had a bearing on the achievements of the MDGs in
Rwanda is the decentralization of responsibilities to local levels, which was first
adopted in 2000. Rwanda’s first phase of decentralization that ran from 2001 to 2005
saw the promulgation of enabling laws, establishment of service delivery structures,
and the first ever democratically elected local government leadership. The second,
from 2006 to 2010, was a turning point in the decentralization agenda where
institutional and organizational restructuring of local governments was carried out to
streamline better service delivery. The third phase, which runs from 2011-2015, is
expected to improve and sustain the achievements made in the first two phases. The
country´s revised decentralization policy of 2012 is aimed at consolidating
participatory governance and fast-tracking a citizen-centered development.28
Thus,
decentralization in Rwanda is not only about delegating fiscal authority to district
level or to enhance service delivery but also about citizens actively participating in
national development.
Decentralization has been an important avenue for women to enter public life and
politics. While less than 10% of Rwanda's 30 mayors are women (although with Vice
Mayors included the figure would be higher), effective decentralization throughout
local government administration means that as of November 2013 38% of village,
43% of cell and 45% of sector Executive Committee members are female. District
Councils, the major decision making body at district level, usually consist of more
than 20 people of whom 45% are female29
.
Twelve years after the introduction of decentralization, Rwandans now take part in
their own governance. Many citizens have been enlightened and emboldened enough
to ask why, and to debate on different issues affecting their communities at different
platforms. These platforms include the monthly community work (Umuganda)
forums where everything comes to a standstill so that valuable works are performed
and discussions are held. Sometimes forums are devoted to a specific theme, for
instance good governance where citizens are given opportunity to articulate how they
want to be governed.
27http://wiki.laptop.org/go/OLPC_Rwanda
28http://www.minaloc.gov.rw/fileadmin/documents/Minaloc_Documents/Revised_Decentralisation_P
olicy.pdf
29
http://allafrica.com/stories/201311200877.html
32. 22
3.4. Conclusions
The successful follow-up of strategies all the way to how individual sector programs
are managed at central and local levels is the main factor why Rwanda has been able
to move forward toward the MDGs targeting not only one but all of them in a
systematic manner. Especially important to mention here is that service delivery has
not only been generally effective but has reached the more difficult target populations
such as the really poor households in the rural areas. An especially successful
example of working with the people has been the fast-tracking of the 9-Year Basic
Education policy which has allowed for the construction of additional classrooms and
enabled academic years to start on a timely basis30
.
There are still improvements to make, for example, data collection for facilitating
monitoring of progress at the district level is in need of improvement. It can be said
with some certainty therefore that as Rwanda has passed one national milestone after
another, national aspirations as manifest in Vision 2020 and other relevant documents,
on the one hand, and global development management ambitions through the MDGs,
on the other, have effectively complemented each other in a catalytic fashion that is
exceptionally successful.
30
Government of Rwanda 2013b. EDPRS: Lessons Learnt 2008-2011. Kigali: Ministry of Finance and
Economic Planning.
33. 23
4. Review of the MDG Performance
This chapter provides a detailed analysis of the eight MDGs, their respective targets
and where available, individual indicators. Each section begins with a table showing
the performance using the color code provided in the Introduction. The data
presentation is followed by a discussion of factors contributing to sustained progress,
key bottlenecks and emerging or new challenges.
4.1 MDG 1: Eradicate Hunger and Extreme Poverty
There are three targets associated with MDG 1: (a) halve between 2000 and 2015 the
proportion of people in poverty, (b) achieve full and productive employment and
decent work for all, including women and young people, and (c) halve between 2000
and 2015 the proportion of people who suffer from hunger. In Rwanda, the Targets
1A and 1C have been closely monitored. Select relevant data for Target 1B were
identified and are incorporated in the Report. In addition to the trend data shown in
Table 1, the Report also provides disaggregated data for sub-national units.
The main storyline here is that Rwanda has indeed succeeded in halving the
proportion of people who suffer from hunger, and has made good progress toward
halving the proportion of people living below the national poverty line. The same is
true for reducing the number of people living in extreme poverty. It still has to raise
the share of the poorest quintile in national income or consumption.
Table 1: Progress in indicators, MDG 131
Baseline
2000
2005/6 2010/11
2015
Target
Target
Status
MDG 1: Eradicate Extreme Poverty and Hunger
Target 1A: Halve between 2000 and 2015 the proportion of people in poverty
1.1a: Percentage of population below
the National Poverty Line
60.4% 56.7% 44.9% 30.2%
1.1b: Extreme Poverty 40% 36% 24,1% 20%
1.2: Poverty Gap Ratio at $1 a day
(PPP), percentage
24,4% 22,3% 14,8% 12,2%
1.3: Share of poorest quintile in
national consumption
4,6% 5,2%
No
Target
31
Sources for Target 1A are: EICV 2 and 3, World Bank, 2013, Poverty ratio
http://mdgs.un.org/unsd/mdg/Data.aspx, Target 1B: EICV 2 and 3, Target 1C: EICV 2 and 3, DHS
2000, 2005 and 2010.
34. 24
Baseline
2000
2005/6 2010/11
2015
Target
Target
Status
Target 1B:Achieve full and productive employment and decent work for all, including
women and young people
1.5: Unemployment rate 16 years of
age and older
1,4% 1,6% 0,9%
No
Target
Target 1C: Halve, between 2000 and 2015, the proportion of people who suffer from
hunger
1.8a: Percentage of underweight
children under five years
24,3% 18% 11,4% 12,2%
1.8b: Child malnutrition (% of under
five children stunted)
42,6% 51% 44,2% 24.5%
1.8c: Child malnutrition (% of under
five children wasted)
6,8% 5% 2,8% 2%
1.9: Proportion of population below
minimum level of dietary intake
40% 35,8% 24,1% 20%
4.1.1 Status and Trends: Target 1A (Poverty)
Figure 2: Percentage of people living below the National Poverty Line
Rwanda has been able
to reduce the
proportion of people
living in poverty,
especially between
2005/06 and 2010/11.
As shown in Figure 2
the baseline figure for
2000 is 60,4%. From
2000 to 2005, a modest
decline took place,
followed by an
accelerated reduction to
44,9% living in poverty in 2010/2011. The trend continues to be in the right direction
and it is by no means impossible that Rwanda might get close to its target of 30, 2%
by 2015.
Table 2 below demonstrates that there are clear differences between rural and urban
areas, the latter showing significant lower proportions living in poverty. There are
also differences among the provinces, although the poverty rate went down in all
provinces between 2005/06 and 2010/11. Reduction rates are seen especially in
Northern and Eastern Provinces. In 2010/11, the Southern Province had the highest
percentage of poor people (56,5%), Kigali City the lowest (16,8%).
60.40%
56.70%
44.90%
30.20%
0.00%
10.00%
20.00%
30.00%
40.00%
50.00%
60.00%
70.00%
2000 2005/06 2010/11 2015 Target
Source: EICV 1, 2 and 3
35. 25
Table 2: Proportion of population living in poverty; by Province
Proportion of population living in poverty (%)
Baseline
2000 2000/01 2005/06 2010/11
2015
Target
National 60,4% 60,4% 56,7% 44,9% 30,2%
Kigali City 22,7% 20,8% 16,8%
Southern Province 65,5% 66,7% 56,5%
Western Province 62,3% 60,4% 48,4%
Northern Province 64,2% 60,5% 42,8%
Eastern Province 59,3% 52,1% 42,6%
Urban 28,5% 22,1%
Rural 61,9% 48,7%
Sources: EICV 1,2 and 3
Figure 3: Poverty rate, by District
Further disaggregation of the data shows that while there are differences among
districts within the same Province, district data confirm once more that Southern
Province does indeed have the highest proportion of people living in poverty.
Source: EICV 3
36. 26
Figure 4: Extreme Poverty
The trends and
figures for extreme
poverty show the
same pattern. The
decline from 2000 to
2005 was relatively
modest, but then
accelerated from
2005/06 to 2010/11.
It is likely that
Rwanda will reach
the 2015 target level
of 20% in extreme
poverty.
Figure 5: Proportion of population living in extreme poverty, by Province
Figure 5 shows the
proportion of the
population that lives in
extreme poverty by
province. It confirms
the provincial
variations seen earlier.
Kigali has the lowest
percentage (7,8%),
Southern Province the
highest at 31,1%.
Considerable progress
was made between
20005/6 and 2010/2011
across the board, but,
again, Northern
Province demonstrates
the fastest decline
having halved the
percentage of people living in extreme poverty. Kigali City and Eastern Province are
Source EICV 1,2 and 3
Source: EICV 1, 2 and 3
40%
36%
24,1%
20%
0%
20%
40%
60%
80%
100%
Baseline 2000 2005/6 2010/11 2015 Target
Percentage
Extreme Poverty Target
37. 27
either below or around the level of the goal of 20% already and Northern Province is
at 23,5%. Given the trend of accelerated reduction, it is quite possible that all
provinces may reach the 20% level by 2015.
Finally, similar positive trends are observable with regard to the Poverty Gap Ratio,
i.e. the mean figure for percentage of the total population that falls below the poverty
line, and the share of the poorest quintile in national income or consumption. As can
be seen in Figure 6, the poverty gap ratio at $1 a day (PPP) has declined significantly
especially since 2005/06. The target of 18,5% is possible to reach taking into account
the accelerated trend from 2005/06 to 2010/11.
Figure 6: Poverty Gap Ratio
Source: Source EICV 1, 2 and 3
The challenge is still to lift a larger number of people in the lowest quintile into a
greater share of national income and consumption. As the figures in Table 1 shows,
the share of the poorest quintile in national consumption has increased from 4,6% in
2005/06 to 5,2% in 2010/11 so the trend is positive. Rwanda has set no target for this
indicator.
24.40%
22.30%
14.80%
12.20%
0.00%
5.00%
10.00%
15.00%
20.00%
25.00%
30.00%
Baseline 2000 2005/6 2010/11 2015 Target
38. 28
4.1.2 Status and Trends: Target 1B (Employment)
Figure 7: Unemployment rate, 16 years of age and older32
Countries like Rwanda
with a large share of the
population in agriculture
– and a growing informal
sector of self-employed
people – tend to have low
unemployment levels.
Earning an income by
whatever mean is a
necessity of life. Figure 7
confirms these low levels
and the only slight
variation that has
occurred between 2000
and 2010/11. The same is true for levels of employment, which have declined only
marginally from 86,7% in 2000, 84% in 2005 and 84,2 in 201033
. This decline may
reflect that a growing proportion of adults stay in schools or colleges. The trend,
therefore, is an indication of Rwanda´s modernization and how to create jobs for all
will be a growing policy challenge as people leave subsistence agriculture.
The 2012 census data, which were released in April 2014 provide slightly different
figures for unemployment as shown in Table 3. As can be read from the table the
figures are slightly higher than the EICV figures illustrated in figure 7.
Table 3: Unemployment rate (census figures)
Unemployment rate (%)
among the active population
aged 16 years and above
Both male
and female
Male Female
Rwanda National 3,4% 2,8% 4%
Kigali City 9,4% 5,9% 14,3%
Southern Province 3,3% 2,7% 3,7%
Western Province 2,8% 2,4% 3,1%
Northern Province 1,9% 1,7% 2%
Eastern Province 2,6% 2,1% 3%
Source: NISR 2012e, Census and Population Survey
32
The indicator used here is the % of unemployed over age 16 instead of the official indicator, which is
Employment-to-population ratio
33
NISR 2012e
Source: EICV 1, 2 and 3
1,4% 1,6%
0,9%
0%
4%
8%
12%
16%
20%
Baseline 2000 2005/6 2010/11 2015 Target
Rate
Unemployment rate 16 years of age and older
Unemployment Rate
39. 29
Overall 4,3 million persons are in the Rwandan labor market, either working or
looking for a job. Among them 3,4% were unemployed at the time of the census.
Unemployment is mainly an urban phenomenon, the rate being three-four times
higher in Kigali (9,4%) than in the rest of the provinces – the Northern Province
having the absolute lowest at 1,9%. Women are the hardest hit with an unemployment
rate of 4,0% as compared to 2,8% among males.
4.1.3 Status and Trends: Target 1C (Hunger)
Figure 8: Underweight Children under 5 years of age
Progress on Target 1C
which measures the
proportion of people
living in hunger has been
especially great. Rwanda
has already reached and
even gone below the
2015 target of 12,2% of
children under-5 years of
age being underweight,
as Figure 8 shows.
Progress with regard to
child malnutrition as
measured by percentage
of children less than five years that are stunted is more modest. As shown in Figure 9,
the figure for 2010/11 is slightly above the 2000 baseline figure, and despite some
progress in lowering the rate from 2005/06 to 2010/11, reducing the number of
stunted children remains a challenge.
Figure 9: Proportion of children under five years stunted
Sources: DHS 2000, 2005, 2010
24,3%
18%
11,4% 12,2%
0%
20%
40%
60%
80%
100%
Baseline 2000 2005/6 2010/11 2015 Target
Percentage
Percentage of underweight children under five
years
Percentage of underweight children Target
40. 30
Source: DHS 2000, 2005, 2010
The World Health Organisation (WHO) has set a range of benchmarks for reaching
specific health related goals by 2025. One of their goals is “40% reduction in the
number of stunted children under-5”34
. As shown above, the 2010/11 figure is as high
as 44,2% and showing only a modest decline from five years earlier35
. For Rwanda to
reach the reduction of 40% by 2025, progress therefore has to be speeded up
significantly.
Figures for wasted children under five years are more promising and have been
steadily decreasing in the period 2000-2010/11. As Figure 10 illustrates, progress has
been especially notable for the period 2005/06-2010/11.
Figure 10: Proportion of children under five years wasted
34
http://www.who.int/nutrition/topics/nutrition_globaltargets2025/en/
35
Source: DHS 2005 and 2010.
42.60%
51.00%
44.20%
24.50%
0.00%
10.00%
20.00%
30.00%
40.00%
50.00%
60.00%
2000 2005/06 2010/11 2015 Target
Source: DHS 2000, 2005, 2010
41. 31
The proportion of people below minimum level of dietary intake as seen in Figure 11
shows a significant decline from 40% in 2000/01 to 24,1% in 2010/11. The 2015
Target of 20% is likely to be met, as the trend line in the figure indicates. According
to the ”Comprehensive Food Security and Vulnerability Analysis and Nutrition
Survey” (2012) percentages of households with unacceptable food consumption are
especially high in the rural areas bordering Lake Kivu (42%) and west and east of the
Congo Nile Crest (43% and 29% respectively), where soils are less fertile and the
land more susceptible to erosion. Western Province accounts for the largest numbers
and highest rates of food insecure households (37%). Kigali has by far the highest
proportion of households with acceptable food consumption (93%) followed by
Eastern Province (86%), which is relatively better off than other provinces despite
being most prone to rainfall deficit36
.
Figure 11: Proportion of people below minimum dietary intake
Key factors contributing to sustained progress
Rwanda is well equipped in terms of policy frameworks and institutional mechanisms
to continue its progress towards reaching all MDG1 targets that it is tracking. Even
though there still remains a lot to be undertaken, the government has a comprehensive
and coordinated approach to national development. This means that poverty and
hunger issues are not tackled only through either social or economic interventions but
a combination of all. For example, the public works component of the VUP offers not
only income to the poor but also helps intensifying the use of land and increase its
productivity thus augmenting access to food at local levels. Similarly, the One-Cow-
per-Poor-Family Program simultaneously provides income and nutrition to families
living in poverty and suffering from hunger.
36
The Comprehensive Food Security and Vulnerability Analysis and Nutrition Survey, 2012, p.2.
Source:DHS 2000, 2005, 2010
40%
35,8%
24,1%
20%
0%
20%
40%
60%
80%
100%
Baseline 2000 2005/6 2010/11 2015 Target
Proportion
Proportion of population below minimum level of
dietary intake
Proportion of population below minimum level of dietary intake Target
42. 32
Another factor that contributes to the country´s already rapid progress is the extent to
which local communities participate in improving their living conditions. Drawing on
a number of traditional idioms and practices that go back to pre-colonial times (for
details see Annex 4) the Government has been able to situate the country´s
development challenges in a language that resonates with people. Casting the
country´s development ambitions in these terms enhances the prospect of local
ownership. They help mobilize communities to participate in development activities
both on a self-help basis and in collaboration with district and other local authorities.
Key implementation bottlenecks
There are four key implementation bottlenecks: (1) a shortage of land, (2) a small
private sector, (3) insufficient management capacity at district level, and (4) irregular
disbursement of donor funds.
The first two of these bottlenecks are structural and will take time to tackle. The
majority of households are still dependent on subsistence farming. Although there
was a decline in such households from 84,9% in 2001 to 61,3% in 2011, this did not
translate into wage-earned jobs only. Many of those without their own land went into
working for other farmers with little chance of considerably improving their
livelihoods37
. The Government is doing its best to facilitate growth of the private
sector but its ability to absorb the large numbers of jobless youth is still limited. Thus,
although the Global Competitive Index ranks Rwanda in the top twenty countries in
the world38
, its attractive business environment has yet to deliver in terms of new jobs
created. Being landlocked, it has to struggle extra hard to attract foreign investments
compared to its neighbours to the East – Kenya and Tanzania.
The third bottleneck is inadequate management capacity in government ministries and
especially in district offices. Service delivery has often fallen short of promise for this
reason as confirmed, for example, in a study commissioned by the Ministry of Trade
and Industry39
. The evaluation of EDPRS1 also points to this bottleneck identifying
weak Monitoring and Evaluation capacity and poor coordination and communication
as implementation hurdles40
.
The fourth bottleneck is both political and administrative. Some donor funds that have
been committed are not disbursed as planned. Since the Development Partners (DPs)
began to disburse their funds as direct budget support (DBS) development
cooperation has become more political. The risks, therefore, for recipient
governments have been that Partners may suspend their aid as a manifestation of their
displeasure with what they see as a violation of good governance principles. In the
37
EICV 3.
38
http://www.weforum.org/issues/global-competitiveness
39
This study titled ”An Assessment of Business Processes and Implementation of Reforms in Private
Sector-Facing Institutions 2007-2011” was carried out by the Institute of Policy Analysis and Research
(IPAR).
40
Republic of Rwanda 2013b. EDPRS1 – Lessons Learnt 2008-2011. Kigali: MINECOFIN.
43. 33
case of Rwanda this happened when these partners reacted negatively to what they
perceived as Rwanda´s involvement in the civil conflict in Eastern DRC.
In addition, despite efforts by both the Government of Rwanda and donors to
facilitate the flow of funds there have been administrative delays that have caused
problems with implementing specific policies and projects. Although the
predictability gap, i.e. the difference between funds committed and disbursed, was
reduced from one third in 2007 to one quarter of all ODA funds in 201041
it is an
ongoing problem that affects government programs like the VUP to suffer
implementation constraints and delays.
New challenges
The theme of the 2013/14 Government Budget is “Self-Reliance and Dignity”, a
theme that indicates Rwanda´s intention to reduce its dependence of foreign aid.
Although Rwanda is likely to continue receiving aid for its vital sectors, there will be
a twofold transition, involving first of all a decline in aid flows and second a shift in
focus from poverty reduction to economic growth. The latter is going to be focused on
an inclusive pro-poor approach but the transition is bound to raise issues about how
well existing gains in the social sector can be sustained.
41
http://www.oecd.org/dac/effectiveness/42155403.pdf
44. 34
4.2 MDG 2: Achieve Universal Primary Education
There is only one target associated with MDG 2: Ensure that, by 2015, children
everywhere, girls and boys alike, will be able to complete a full course of primary
schooling. The goal is mainly concerned with primary education, but comprises also
figures for youth literacy (defined as 15-24 years old). Disaggregated data is also
presented for various indicators, ranging from sub-national levels to urban versus
rural figures and male/female. The main storyline here is that Rwanda has come very
close to the indicator of 100% primary enrolment rate, and that is on course to achieve
both 100% rates for completion and literacy rates for 15-24 years old. Reaching the
100% target for literacy rates of women and men above the age of 15 years by 2015 is
beyond what can be accomplished.
Table 4: Progress in indicators, MDG 242
Baseline
2000
2005/6 2010/11
2015
Target
Target
Status
MDG 2: Achieve Universal Primary Education
Target 2A: Ensure that by 2015 children everywhere, boys and girls alike will be able to
complete a full course of primary schooling
2.1: Net enrolment rate in primary
school
72,6% 86,6%
96,5
(2012)
100%
2.2: Proportion of pupils starting grade
one who reach last grade of primary
school
22% 51,7%
72,7%
(2012)
100%
2.3a: Literacy rates of women and men
aged 15-24 years
57,4% 76,9% 83,7%
No
target
2.3b:Literacy rates of women and men
aged 15 years and above
52,4% 65,3% 69,7%
No
target
4.2.1 Status and Trends: Target 2 (Primary Education)
Figure 12: Net
Enrolment in
Primary School
Rwanda has made
steady progress on
primary school
enrolment, which has
increased from
72,6% in 2000, to
42
Sources for Target 2A are: EICV 2 and 3, and NISR Statistical Year Book 2012
Source: EICV 1, 2 and 3, and NISR 2012 Statistical Year Book
72,6%
86,6%
96,5%
100%
0%
20%
40%
60%
80%
100%
Baseline 2000 2005/6 2012 2015 Target
Percentage
Net enrolment rate in primary school
Net primary school enrolment rate Target
45. 35
96,5%43
in 2012. There was a rapid increase in primary school attendance rates
between 2000/1 and 2005/6, and although slightly slower, the steady upward trend
has continued from 2005/06 to 2012. The figure for 2012 of 96,5% is very close to
reaching the target of 100% in 2015.
With regard to sub-national variations, the EICV3 points to some slight differences
across the country, showing that some provinces have better enrolment rates than
others. These figures for 2005/06 and 2010/11 show that the highest enrolment rate is
in Northern Province (96%) with Eastern Province recording the lowest figure (89%).
These variations notwithstanding, the main point is that Rwanda has managed to
ensure an almost equal access to primary education across the country.
Figure 13: Net Enrolment Rate in Primary Education by Provinces
The EICV 3 also shows that
enrolment rates are slightly higher
for girls than for boys. This trend is
confirmed by latest figures from the
Ministry of Education’s Statistics
Yearbook (2012), which show that
the net enrolment rate in primary
school has seen a higher increase for
girls than for boys in the past five
years as shown in Table 5.
Especially striking is that the
disparity between rural (92%) and
urban (93%) areas is virtually
imperceptible.
Table 5: Net Enrolment Rates, Primary Education, 2008-2012
Net Enrolment Primary
Rate - Supplemental Data
2008 2009 2010 2011 2012
National 94,2% 92,9% 95,4% 95,9% 96,5%
Boys 93,3% 91,6% 94,2% 94,3% 95,0%
Girls 95,1% 94,1% 96,5% 97,5% 98,0%
Source: NISR 2013 Statistical Year Book
43
According to the 2012 Ministry of Education Statistics Yearbook and theRwanda 2012 Statistical
Year Book, the rates were 95,4% in 2010, and 95,9% in 2011. Hence the administrative records show
slightly higher figures than the national survey data in the EICV.
Source: EICV 2 and 3
46. 36
Figure 14: Primary Completion Rate
Rwanda has also made
notable progress in
boosting primary
school completion
rates. The proportion
of pupils reaching
Grade 6 (last grade in
primary) has increased
from 24,1% in 2000 to
72,7% in 2012 a
tripling of the rate
during the period. In
case the trend since
2000 continues its
course, the MDG goal
of 100% completion
rate will most likely be attained.
National literacy rates for the youngest age category (15-24 years old) show a marked
improvement since 2000. Although progress has slowed down somewhat since 2005
the 100% target is not completely out of reach.
Figure 15: Literacy Rate of 15-24 Years Old
Source: EICV 1, 2 and 3
57.4%
76.9%
83.7%
0%
20%
40%
60%
80%
100%
Baseline 2000 2005/6 2010/11
Rate
Literacy rates of women and men aged 15 -24 years old
NISR 2012 Statistical Yearbook
24,1%
51,7%
72,7%
0%
20%
40%
60%
80%
100%
Baseline 2000 2005/6 2012 2015 Target
Percentage
Proportion of pupils starting grade one who reach
last grade of primary school
Proportion of pupils starting grade one who reach last grade of primary school Target
47. 37
Table 6 and figure 16 provide disaggregated data showing the differences between the
provinces, which are quite small with the exception of Kigali, which has a notably
higher rate. The difference between urban and rural areas is only about 6 per cent
thanks to an accelerated growth between 2005/06 and 2010/11 in the latter. Finally, it
is important to note that women have slightly surpassed the men, since both
categories were almost 77% in 2005/06, but five years later women stand at 84,7%
and men at 82,5%.
Table 6: Disaggregated Literacy Rates for 15 to 24 year olds
2005/6 2010/11
Kigali City 86,6% 89,3%
Southern Province 77,0% 81,5%
Western Province 75,7% 83,2%
Northern Province 76,2% 84,4%
Eastern Province 73,9% 82,8%
Urban 84,7% 88,8%
Rural 75,1% 82,6%
Male 76,9% 82,5%
Female 76,8% 84,7%
Source: EICV 2 and 3
Figure 16: Disaggregated Literacy Rates for 15 to 24 year olds by provinces
Source: EICV 2 and 3
48. 38
Figure 17: Literacy of women and men aged 15 years and above
When looking at
literacy rates for
the whole
population above
15 years of age, the
trend is less
promising. As
Figure 17
illustrates, Rwanda
is not going to be
able to raise the
literacy to 100 per
cent for the
population at large
before 2015.
Key factors contributing to sustained progress
Rwanda has the highest primary school enrolment rates in Africa, and it won the
Commonwealth Education Good Practice Awards 2012, for the innovative fast-
tracking strategies of the 9-Year Basic Education Programme. This is a recognition of
the progress which Rwanda has made in increasing access to nine years basic
education and an acknowledgement of the innovative and successful approaches taken
to ensure that all children can access and complete quality basic education in Rwanda.
The official age for completing primary school in Rwanda is 12 years, but
compulsory education lasts 9 years, from age 7 to age 15. It covers primary and lower
secondary education and is commonly known as “nine years basic education”
(9YBE). The 9YBE programme was introduced in 2008, and it has recently been
increased to 12 years. It should therefore be noted, that Rwanda has since 2008
implemented an education policy, which adds additional three compulsory years of
basic education to the MDG goal of achieving universal primary education.
In 2003, Rwanda introduced free education as part of government policy to improve
school enrolment in general and the attendance of deprived children in particular. The
Rwandan government targeted achieving universal primary education in 2010, and
nine years of basic education for all children in 2015. As stated in its Vision 2020
policy document, the government aims to transform Rwanda’s agriculture-based
economy into a knowledge-based economy, for which human resource development
is of vital importance. The government emphasizes gender equity in all segments of
society and the economy, meaning that boys and girls should equally enrol in
education.
Source: EICV 1, 2 and 3
72,6%
86,6%
96,5%
0%
20%
40%
60%
80%
100%
Baseline 2000 2005/6 2012
Percentage Net enrolment rate in primary school
Net primary school enrolment rate
49. 39
Key implementation bottlenecks
Educational research44
on the remaining 8,3% of the children that were not enrolled in
primary school according to the 2010/11 figures, describe a variety factors behind
their non-enrolment. First of all, some parents do not enrol their children in school,
because they rely on them for labour – at home or as paid labour outside the home.
Parents in subsistence-oriented rural communities often think that it is more important
to involve children in economic activities and equip them with the basic life skills for
future survival than send them to school for formal education. Besides poverty, labour
market conditions, gender roles, and cultural practices can also be barriers to
enrolment and attendance. Finally, school attendance is also linked to other factors,
such as place of residence, availability and accessibility of schools, and quality of
education.
New challenges
With Rwanda’s success of achieving near universal access to primary education, a
stronger focus has been placed in recent years on improving the quality of education
and in building capacities to plan, implement and monitor programs and interventions
aimed at ensuring equitable access to quality education, including early childhood
education services. To further improve the completion rate, the Government needs to
secure greater balance between interventions that focus on improving educational
access and gender parity in enrolment, on the one hand, and those that address
retention and completion rates, on the other. In addition, the country is faced with the
issue of equal access for girls and boys at secondary and tertiary levels of education.
44
See: Nkurunziza et al 2012 ”Free Education in Rwanda: Just One Step towards Reducing Gender and
Sibling Inequalities” in Education Research International, Volume 2012, Article ID 396019.
http://www.hindawi.com/journals/edri/2012/396019/