Determination of Mixed Melting Points of Cholesterol in Binary and Tertiary Mixtures
1. Determination of Mixed Melting Points of Cholesterol in Binary and Tertiary Mixtures
John Caruso III and Dr. Amy M. Balija
Fordham University, Department of Chemistry, 441 E. Fordham Road, Bronx, NY 10458
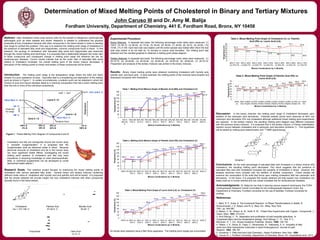
Results: Binary mixed melting points were obtained combining cholesterol with myristic acid,
palmitic acid, and lauric acid. In each example, the melting points of the mixtures were broaden and
depressed compared with cholesterol.
Abstract: High cholesterol levels pose serious risks for the spread of dangerous cardiovascular
pathologies such as heart disease and stroke. Research is needed to understand the physical
properties of how cholesterol interacts with other compounds in the blood stream in order to develop
new drugs to combat this problem. One way is to examine the melting point range of cholesterol in
the presence of saturated fatty acids and triglycerides, common compounds found in blood. In this
research, the synergy of cholesterol with saturated fatty acids and triglycerides was examined
through the mixed melting point technique. It is proposed that a relationship between the molar ratio
of these compounds and consequent change in melting point range will influence the risk for
cardiovascular diseases. Current results indicate that as the molar ratio of saturated fatty acids
relative to cholesterol increases, the overall melting point of the binary mixture decreases. A
discussion of the melting points on binary and tertiary of these compounds will be shown.
Conclusions: As the mole percentage of saturated fatty acid increased in a binary mixture with
cholesterol, the resulting melting point decreased. This result suggests that the presence of
saturated fatty acid with cholesterol increases the solubility of cholesterol in blood. However, this
analysis becomes more complex with the addition of another component. Future studies will
examine the composition of the solid that forms upon melting cholesterol with two carboxylic acid
derivatives. In the future, it is proposed the results obtained will help explain how cholesterol can
easily build up in human arteries and can cause increases risk for cardiovascular diseases.
Acknowledgments: Dr. Balija for her help in learning various research techinques, the FCRH
Undergraduate Research Grants Committee for the Undergraduate Research Grant, the
Department of Chemistry; Fordham University for the use of facilities, Fordham University for
printing.
References:
1. Mehl, R. F.; Dube, A. The Euctectoid Reaction. In Phase Transformations in Solids; R.
Smoluchowski, J. E. Mayer, and W. A. Weyl, Ed.; Wiley: New York,
1951, pp. 545-587.
2. Mason, C. M.; Rosen, B. W.; Swift, R. M.; Phase Rule Experiments with Organic Compounds. J.
Chem. Educ. 1941, 473-474.
3. Smit Sibinga, C. Th. Separation and purification of cold insoluble globulines. In
Cryopreservation and low temperature biology; Smit Sibinga, C. Th., Das, P. C.,
Meryman, H. T., Ed.; Kluwer Academic Publisher: Boston, 1990; 129-144.
4. Patton, J. S.; Stone, B.; Papa, C.; Abramowitz, R.; Yalkowsky, S. H.; Solubility of fatty
acids and other hydrophobic molecules in liquid trioleoyglycerol. Journal of Lipid
Resarch. 1984, 189-197.
5. Gunstone, F. Fatty Acid and Lipid Chemistry.; Aspen Publishers: New York, 1996.
6. Caruso III, J. Fordham University, Department of Chemistry, Bronx, NY. Unpublished work, 2013.
Binary Mixtures: In separate test tubes, the following percentage molar ratios were measured: (1)
100:0, (2) 90:10, (3) 80:20, (4) 70:30, (5) 60:40, (6) 50:50, (7) 40:60, (8) 30:70, (9) 20:80, (10)
10:90, (11) 0:100. Each test tube was heated until the entire sample was melted after which the test
tube was cooled in an ice bath for 10 minutes to induce solid formation. The melting point was
obtained and the resulted graphed to obtained a melting point phase diagram.
Tertiary Mixtures: In separate test tubes, the following percentage molar ratios were measured: (1)
20:10:70, (2) 20:20:60, (3) 20:30:50, (4) 20:40:40, (5) 20:50:30, (6) 20:60:20, (7) 20:70:10.
Preparation and analysis of the tertiary mixtures was similar to the binary mixtures.
Introduction: The melting point range is the temperature range where the solid and liquid
phases of a pure substance co-exist. Impurities lead to a broadening and depression of the melting
point as shown in Figure 1. In certain circumstances, a eutectic point can be obtained in which the
mixture of pure and impure samples leads to a chemical composition that has a lower melting point
than the one or more of the individual components.
Research Goals: This research project focuses on examining the mixed melting points of
cholesterol with various saturated fatty acids. Several binary and tertiary mixtures containing
different molar ratios of cholesterol with myristic acid and palmitic acid will be tested. It is proposed
that the results obtained will provide insight into how cholesterol interacts with other compounds
typically found in the blood stream.
Experimental Procedure:
52.8 50.4 49.7 49.8 52.6
83.2
102.1
111.3
123.9
135.6
147.9
53.9 52.6 51.3
110.5 109.1
123.6
135.1
128.5
135.1
141.1
149.4
0
20
40
60
80
100
120
140
160
100 %
MA 0%
C
90% MA
10% C
80% MA
20 % C
70% MA
30% C
60% MA
40% C
50% MA
50% C
40% MA
60% C
30% MA
70% C
20% MA
80% C
10% MA
90% C
0% MA
100% C
Tempeerature(C)
Mixture Combinations by % Molarity
Table 1. Melting Point Mixture Graph of Myristic Acid (MA) and Cholesterol (C)
61.7 59.4 58.1 57.4
76.6
96.2 107.6
109.5
127.5 135 147.1
63.3 61.4 60.5
94.5
110.5 114.8
122.4 127.8 132.2
138.4
149.2
0
20
40
60
80
100
120
140
160
100% PA 90% PA
10% C
80% PA
20% C
70% PA
30% C
60% PA
40% C
50% PA
50% C
40% PA
60% C
30% PA
70% C
20% PA
80% C
10% PA
90% C
100% C
Temperature(C)
Mixture Combinations by % Molarity
Table 2. Melting Point Mixture Graph of Palmitic Acid (PA) and Cholesterol (C)
40.8 38.2 38.7
60.7
70.8
86.9
111.8 116.2 125
136.5
147.1
43.5 41.6
55.5
90.2
112.2
118.3 119
130
137.9 140.1
149.2
0
20
40
60
80
100
120
140
160
100% LA 90% LA
10% C
80% LA
20% C
70% LA
30% C
60% LA
40% C
50% LA
50% C
40% LA
60% C
30% LA
70% C
20% LA
80% C
10% LA
90% C
100% C
Temperature(C)
Mixture Combinations by % Molarity
Table 3. Mixed Melting Point Graph of Lauric Acid (LA) vs. Cholesterol (C)
Cholesterol and fats are transported around the human body
in insoluble conglomerates.5 It is proposed that the
conglomerates exist as dissolved solids in blood. Because
abnormal amounts of cholesterol and fat in the human body
can have significant health effects, investigating the mixed
melting point systems of cholesterol and fats may have
importance in acquiring knowledge on what pharmaceuticals,
diets, or nutritional supplements can be developed to curtail
detrimental health effects.5:
Liquid A + B
Solid A + B
mp A
mp B
100% A
0% B
0% A
100% B
Temperature
Eutectic Point
mpB > mpA
Observed
mp range
48% A
52% B
60% A
40% B
180.0-180.2 ˚C
210.1-210.3 ˚C
Solid A + B150 ˚C
157 ˚C
142.0-142.2 ˚C
Figure 1. Phase Melting Point Diagram of Compounds A and B
HO
H
H
H
OH
O
OH
O
Cholesterol
mp = 147-149 ˚C
Palmitic Acid
61-62.5 ˚C
Myristic Acid
52-54 ˚C
O
O
O
O
O
O
OH
O
Oleic Acid
13-14 ˚C
Triclyceride All results were obtained using a Mel-Temp apparatus. The melting point ranges are uncorrected.
Discussion: In the binary mixtures, the melting point range of cholesterol decreased upon
addition of the carboxylic acid derivatives. Potential eutectic points were observed at 90% mol
carboxylic acid derivative:10% mol cholesterol although additional mixed melting point experiments
are required. In the tertiary mixture, the resulting melting point diagram was different compared
with the previous binary mixtures. It is proposed that in the tertiary mixture, a Fischer esterification
reaction occurs between cholesterol and a carboxylic acid derivative (Scheme 1). This hypothesis
will be tested by melting point determination and 1H NMR spectroscopy.
HO
H
H
H
OH
O
O
H
H
H
+ O
Scheme 1
55.9 51.5 47.6
41.9 36.1
35.6 34.9
57.3 58.2
64.5 61.1 58.9
72.1
67.6
0
10
20
30
40
50
60
70
80
20% C 10%
LA 70% PA
20% C 20%
LA 60% PA
20% C 30%
LA 50% PA
20% C 40%
LA 40% PA
20% C 50%
LA 30% PA
20% C 60%
LA 20% PA
20% C 70%
LA 10% PA
Temperature(C)
Mixture Combinations by % Molarity
Table 4. Mixed Melting Point Graph of Cholesterol (C) vs. Palmitic
Acid (PA) vs. Lauric Acid (LA)
42.8 38.2 35.3 36.9 37.1 41.1
48.4 51.4
55.3 58.2 61.744.8
40.9 38 38.1 39.6
46.8
52 55.3 58.8 60.9 63.3
0
10
20
30
40
50
60
70
100%
LA
90% LA
10% PA
80% LA
20% PA
70% LA
30% PA
60% LA
40% PA
50% LA
50% PA
40% LA
60% PA
30% LA
70% PA
20% LA
80% PA
10% LA
90% PA
100%
PA
Temperature(C)
Mixture Combinations by % Molarity
Table 5. Mixed Melting Point Graph of Palmitic Acid (PA) vs.
Lauric Acid (LA)