
Recommended
More Related Content
What's hot
What's hot (19)
Similar to A new world wildfires -2021111 for posting
Similar to A new world wildfires -2021111 for posting (20)
More from Jim Dodenhoff
More from Jim Dodenhoff (15)
Recently uploaded
Recently uploaded (20)
A new world wildfires -2021111 for posting
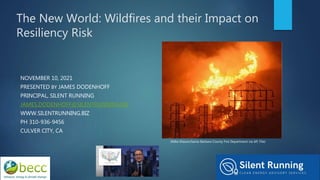
- 1. The New World: Wildfires and their Impact on Resiliency Risk NOVEMBER 10, 2021 PRESENTED BY JAMES DODENHOFF PRINCIPAL, SILENT RUNNING JAMES.DODENHOFF@SILENTRUNNING.BIZ WWW.SILENTRUNNING.BIZ PH 310-936-9456 CULVER CITY, CA (Mike Eliason/Santa Barbara County Fire Department via AP, File)
- 2. Abstract From 2018 through 2021, Wildfires have emerged as one of the most destructive and deadly forces impacting energy resiliency around the globe. Dramatic new policy measures have been implemented in different jurisdictions with decidedly mixed results. Even less clear is whether these policy measures will truly ensure safe, reliable, and affordable energy------ along with a modicum of reliability. This presentation will provide a detailed overview of the costs of wildfires within a resiliency framework, focusing upon California, Australia and other highly impacted geographic areas. Existing policy responses such as the Public Safety Power Shutoff (PSPS) program in California will be evaluated for efficacy. Evolving policies will also be reviewed----especially those that hold material potential to mitigate risk. Finally, for those areas with high wildfire risk, electricity market responses in the commercial and industrial (C&I) sector will be explored in detail. To what degree has wildfire risk expedited the shift from centralized utility electricity generation to distributed and/or third-party C&I electricity generation? Has this shift focused upon specific technologies (i.e. storage vs renewables vs fossil fuel generators). The presentation will assess whether these market shifts are mitigating wildfire risks or simply creating greater complexity and variability.
- 3. Largest Wildfires in 21st Century (as measured by Area burned) Name Country Year Area Burned (km2) Equivalence in Land Area Fatalities 2021 Russia Wildfires Russia 2014 2021 200,000 Nebraska 0 2019-2020 Australian Bushfire Season (Black Summer) Australia 2019-20 180,000 South Dakota 479 2019 Siberia wildfires Russia 2019 43,000 2 x New Hampshire 0 2014 NW Territories Fires Canada 2014 34,000 2 x Hawaii 0 2009 Black Saturday Fires Australia 2019 21,000 Massachusetts 173 2020 California Wildfires United States 2020 18,000 New Jersey 31 2010 Bolivia Forest Fires Bolivia 2010 15,000 Connecticut 0 2011-12 Australian bushfire season Australia 2011-12 14,000 Connecticut 0 2006-07 Australian bushfire season Australia 2006-07 13,000 Connecticut 5 2017 British Columbia wildfires Canada 2017 12,000 Connecticut 0 2021 California Wildfires United States 2021 11,117 Connecticut 3 2015 Russian Wildfires Russia 2015 11,000 Connecticut 33 https://en.wikipedia.org/wiki/List_of_largest_fires_of_the_21st-century
- 4. Black Saturday Bushfires in Australia -February 2009 Australian Government Bureau of Meteorology Black Saturday Fires-Feb 2009 • 173 Fatalities • 1.1 MM Acres/1700 sq miles • CO2 produced: 10-15 MM tonnes • A$4.4 billion cost • Cause: Extreme Heat, High Winds, Electric Infrastructure Sparking, Arcing, and Breaking, Arson • Legal-Class action suit against SPAusnet settled at A$500M
- 5. Black Summer Wildfires in Australia: 2019-2020 Black Summer Fires: Sept ‘19-March ‘20 • Fatalities: 34 Direct/445 Indirect • 46 MM Acres/72.000 sq miles • CO2 produced: 715 Million tonnes • Cost: A$100 billion cost • Cause: Lightning Strikes, Arson, extreme high temperatures, large fuel loads, drought • Buildings Destroyed: 10,000 Source: Levin, Noam; Yebra, Marta; Phinn, Stuart; “Unveiling the Factors Responsible for Australia’s Black Summer Fires of 2019/2020”, Fire, September 2021
- 6. Largest California Wildfires in 21st Century Source: “Map: 1 0f every 8 acres in California has burned in the last 10 years. Here’s where the biggest fires spread --- and are Burning now”, fSan Jose Mercury News, Paul Rogers, September 29,2021 Dixie Fire July-Oct 2021 • Fatalities: 1 Fatality • Footprint:1 MM Acres/1600 sq miles • CO2 produced: TBD • Cost: $1.25 billion • Likely Cause: Vegetation falling on live Power Line • Buildings Destroyed: 1.329 August Complex Fire August-Nov 2020 • Fatalities: 1 Fatality • Footprint: 1 MM Acres/1600 sq miles • CO2 produced: TBD • Cost: $320 MM • Likely Cause: Lightning Strikes • Buildings Destroyed: 935 Camp Fire November 2018 • Fatalities: 85 People • Footprint: 153,000 Acres/240 sq miles • CO2 produced: TBD • Cost: $16.6 billion • Cause: Faulty Electrical Transmission Line • Buildings Destroyed: 1.329
- 7. The Stages of a Wildfire
- 8. Wildfire Causes and Wildfire Stages Fire Lifecycle Stage Ignition Growth Fully Developed Decay Lightning Extreme Heat, Wind, and Drought Fuel Loading Manmade- Arson Manmade- Accidental Electrical Infrastructur e Significant Moderate Minor Insignificant
- 9. Climate Change Impact on Wildfires started by Electrical Infrastructure Climate Change Extreme Weather Events • Extreme Heat • High Winds • Drought Greater Ignition Risk • Downed Power Lines • Vegetation contact with Power Lines Greater Fire Growth Risk • Sustained Sparking • Large Geographic Footprint HOT OFF THE PRESS “Quantifying contributions of natural variability and anthropogenic forcings on increased fire weather risk over the western United States,” Yizhou Zhuang, Rong Fu, Benjamin D. Santer, Robert E. Dickinson, and Alex of the National Academy of Sciences of the United 2021
- 10. Tools for Mitigating Wildfire Risk Caused by Electrical Infrastructure Public Safety Power Shutoffs (PSPS) Vegetation Management & Prescribed Burning Update & Upgrade Risky T&D Components Underground T&D infrastructure Field-Based Regulatory Intervention Microgrids & Distributed Generation Climate Change Mitigation
- 11. Closing Thoughts UTOPIA DYSTOPIA November 10, 2021 The Challenge? Minimizing Wildfire Risk from/to Electrical Infrastructure
- 12. Thank You! James Dodenhoff, Principal, Silent Running LLC James.Dodenhoff@silentrunning.biz www.silentrunning.biz Please email me if you’d like a copy of the presentation and accompanying references.
Editor's Notes
- It took John Oliver 20 minutes to cover the Power Grid & Resiliency last Saturday. I’m going to try and address the the Challenge of Minimizing Wildfire Risk from/to Electrical Infrastructure in 7-8 minutes. Somewhat like hopping on a rollercoaster while it is moving.
- This slide provides a Global overview of the Largest Wildfires in the 21st Century, sorted by footprint of area burned. In this chart, I’ve highlighted in yellow, those fire events which I’ve taken a deep dive into and for which the greatest amount of accurate data is available. As you look down the table, I want you to consider the parameters along which wildfires and bush fires are analyzed: Size: How big is a wildfire? Amount of area burned? How lethal is a fire? How many people die from a given fire (direct/indirect) How destructive is a fire? Property loss (electrical infrastructure), Animal Loss, Wild/Pristine Areas lost How costly is a fire? What amounts of moneys are spent or economic opportunities lost when we have a wildfire (Business Interruption Electricity Customers without power) How much Environmental damage? GHG Emissions, watershed loss, air quality, biodiversity What caused the Fire? Cause maps to both initial ignition and subsequent growth, full development, and decay. Other dimensions? Roughly the Size of Kenya or France in Total
- Black Saturday Black Saturday Fires in 2009 comprised Bandigo & Redesdale, Kinglake Complex, Bunyip, Churchill Complex, Dargo, and Beechworth Cause of Fire: High Temperature Records. Melbourne had three days over 109 degrees. 1.1 Million Acres is = 1700 square miles- Larger than the state of Rhode Island. Carbon production from Black Saturday fires produced equivalent of 5% of Australia’s overall CO2 production Electricity Failures behind most Black Saturday deaths. When they happened Black Friday Fires 9th deadliest bushfire/wildfire event in recorded history.
- Black Summer Wildfires Australia 2019-2020 Acreage covered = 72,000 sq miles or equivalent of South Dakota Fatalities: 34 Direct/445 Indirect (Smoke Inhalation) Lightning the major cause of ignition, however the historically high and dry conditions greatly exacerpated the destruction from the fire. Small percentage from human causes (including powerlines, machinery and amateur back-burns on rural property. Arson was a relatively small impact) CO2 emissions for this event alone were 715 MM tonnes exceeding the “normal” total annual CO2 emissions from Australia of 535 MM tonnes.
- Nine of California’s 10 largest wildfires have occurred in the last decade. and the 8 largest have burned since 2017. Over the past 10 years, 1 of every 8 acres in the state has burned in a wildfire, double that of the previous decade. Natasha Stavros is an applied science system engineer at NASA’s Jet Propulsion Laboratory in Southern California who studies wildfires. She says that wildfires in the U.S. West are bigger, more severe, and faster than ever before, and more destructive, with 15 of the 20 most destructive wildfires in California history occurring within the past decade. Finally, I’ve included detail on the 2018 Camp Fire which actually was NOT one of the Largest California Wildfires in this century. The Camp Fire was, however the deadliest and most destructive wildfire in California's history,[11] and the most expensive natural disaster in the world in 2018 in terms of insured losses.[12][13][3]. It is the sixth deadliest U.S. wildfire overall. The fire was started by a failed transmission line. All of this to say that the largest wildfires or bushfires are not necessarily the most lethal or destructive, and smaller wildfires and bushfires can reap enormous destruction.
- Stage 1-Ignition has occurred but there has been no spread Stage 2-FireGrowth-Fire is self sustaining and there is a rapid increase in Heat Release Stage 3-Fully Developed-Fire is at its hottest point. Burning all of its available fuel Stage 4- Decay-Fire is running out of fuel but is still very dangerous. This is the longest stage
- On the left hand column under “Fire Lifecycle Stage” are the primary stages or phases of a 0-30%. The remaining columns are the major causes of wildfires and the degree to which these causes or origins impact each phase of a Wildfire., What causes wildfires? What is a seemingly simple question is, in fact, quite complicated. Less than 10% of CA Wildfires are started by electric infrastructure. Lightning is roughly 15-25%, Manmade arson and accidental causes comprise another 15-25%, but, the largest direct cause of wildfires is either unknown or undetermined. Let’s dig a little deeper. A significant driver for fire ignition may not necessarily be a key driver for the fire’s growth and fully developed burn (I would put a single lightning strike into this category). Fuel loading may not be a particularly significant ignition driver, but can be the main driver behind the fire’s growth, spread, and destructiveness. Extreme heat, Wind, and drought have an important impact on all phases of a wildfire. Electrical infrastructure failure, arcing, or sparking is certainly a driver for ignition and growth, but is not particularly significant to a fire’s full development.
- Electrical Infrastructure is not a major root cause of wildfires. However it has shown the capability to create destructive and deadly wildfires like the Camp Fire in 2018 which was ignited by a faulty electric transmission line. Even so, the severity and destructiveness of this fire was also driven by severe drought, high fuel loading, and close proximity of people and structures to high wildfire risk areas. The point I’m making is that-Climate Change creates an environment (namely Extreme Weather events and conditions) which magnify the burn potential for ignition events and which can amplify the intensity of fire growth and heat release for a given wildfire. Finally, as you can see, I’ve provided a reference to a VERY RECENT article by CA researchers who have found that regular weather patterns explain a relatively small portion of CA’s extreme weather events and that climate change is a much larger explanatory factor ranging from 60-80%. They argue that climate change is primarily responsible for extreme weather events and conditions. These, are in turn, a large and important driver of the rash of destructive wildfires.
- This slide presents an array of the most widely used tools for trying to reduce wildfires started by electrical infrastructure. The color schemes I use are evaluative and directional. A green shaded tool is at least somewhat effective in taking on the challenge. A red shaded tool indicates a lack of efficacy, feasibility, or provability. I am a large supporter of microgrids and distributed energy and see a decentralized generation system as a remedy for many of the grid’s deficiencies, however, my research indicates that this is not the end-all/be-all solution for mitigating wildfire risk---especially since so many microgrids will remain grid-connected. Conversely, my research could find little evidence that PSPS’s provided material wildfire mitigation and a significant evidence that in a context of extreme weather events (high wind, extreme heat, drought), cutting off access to electricity introduces additional hazards to end-use customers. Pacific Gas & Electric has proposed Undergrounding some of its T&D infrastructure in high fire risk areas. The costs of this infrastructure is roughly 5-10 times that of overhead lines. Undergrounding is generally implemented in urbanized (rather than remote) areas and bundled with other infrastructure (e.g. broadband cable). Undergrounding may reduce risk from wildfires but it in no way protects against a host of other risks and challenges (underground flooding, human digging, and high maintenance costs). PG&E’s proposal to underground a portion of its T&D infrastructure is neither feasible, nor credible in my view. Ultimately, Climate Change Mitigation is the best long term tool and the umbrella under which wildfire risk can be reduced. xxxxxxxxxxxxxxxxxxxxxxxxxxxxxxxxxxxxxxxxxxxxxxxxxxxxxxxxxx
- Circling back to the Challenge we are trying to address-----Minimizing Wildfire Risk from/to Electrical Infrastructure, I would offer some closing thoughts There is considerable ambiguity around Wildfire Risk Mitigation Measures and their Efficacy w respect to Electrical Infrastructure: How do we know our measures are working? Public Safety Power Shut-offs are primarily a Liability Mitigation measure for utilities and their regulators. In CA, the C&I Distributed Generation Market is being driven by PSPS risk and energy independence as much or more than by Wildfire risk. End Use Customers are more afraid of PSPS’s than wildfires and are seeking certainty of service and cost. Last, but certainly not least Climate Change plays a central role in the escalating number, severity, and destructiveness of wildfires around the world. Climate Change creates conditions where electrical infrastructure ignition risk is higher and fire-specific destruction is greater. HERE IS MY UTOPIA: A WORLD WHERE WE CAN PREDICT, MEASURE, AND MITIGATE ELECTRIC INFRASTRUCTURE WILDFIRE RISK WITH THE END-GAME OF ENHANCED GRID RESILIENCY AND RELIABILITY. MY RESEARCH INDICATES WE HAVE A VERY LONG WAY TO GO. In fact, I would argue that the tools we have for climate change measurement and mitigation may be more evolved than the tools we have for reducing wildfire risk. For both wildfires and climate change effective implementation of mitigation measures is in its infancy. This is unsurprising given their interdependence.