Recommended

Recommended
More Related Content
What's hot
What's hot (19)
Viewers also liked
Viewers also liked (10)
Similar to Poster Presentation PPT Jia Cheong draft 1 (1)
Similar to Poster Presentation PPT Jia Cheong draft 1 (1) (20)
Poster Presentation PPT Jia Cheong draft 1 (1)
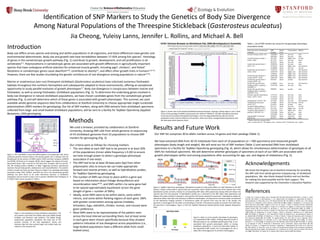
- 1. Identification of SNP Markers to Study the Genetics of Body Size Divergence Among Natural Populations of the Threespine Stickleback (Gasterosteus aculeatus) Jia Cheong, Yuleisy Lanns, Jennifer L. Rollins, and Michael A. Bell We used a browser, provided by collaborators at Stanford University, showing SNP calls from whole genome re-sequencing of 43 stickleback genomes from 23 populations to choose SNP markers for genotyping (Fig. 3). Our criteria were as follows for choosing markers: • The rare allele at each SNP had to be present in at least 20% of the populations (minor allele frequency ≥ 0.20) to ensure we have enough power to detect a genotype-phenotype association if one exists. • The SNP had to be at least 30 base pairs (bp) from other polymorphic sites to ensure we can make appropriate forward and reverse primers, as well as hybridization probes, for TaqMan OpenArray genotyping. • The number of SNPs we chose to place within a gene was based on information about linkage disequilibrium and recombination rates18,19, and SNPs within the same gene had to be spaced approximately equidistant across the gene (length of gene ÷ number of SNPs). • Ideally, some SNPs were to be within exons, some within introns, and some within flanking regions of each gene. SNPs with greater conservation among species (medaka, tetraodon, fugu, zebrafish, chicken, human, and mouse) were given preference. • Most SNPs were to be representative of the pattern seen across the local interval surrounding them, but at least some in each gene were chosen specifically because they showed patterns indicative of size divergence across populations (i.e., large-bodied populations have a different allele from small- bodied ones). Methods Introduction Body size differs across species and among and within populations in all organisms, and these differences have genetic and environmental determinants. Body size and growth rate have heritabilities between 17-42% among fish species1. Homologs of genes in the somatrotropic growth pathway (Fig. 1) contribute to growth, development, and cell proliferation in all vertebrates2-5. Polymorphisms in somatotropic genes are associated with growth differences in agriculturally important species that have undergone artificial selection for enhanced muscle growth, including pigs6, chickens7, and fishes8. Mutations in somatotropic genes cause dwarfism9,10, contribute to obesity11, and affect other growth traits in humans5,12-14. However, there are few studies elucidating the genetic architecture of size divergence among populations in nature15,16. Marine or anadromous (sea-run) threespine stickleback (Gasterosteus aculeatus) have colonized numerous freshwater habitats throughout the northern hemisphere and subsequently adapted to those environments, offering an exceptional opportunity to study parallel evolution of growth phenotypes17. Body size divergence is conspicuous between marine and freshwater, as well as among freshwater, stickleback populations (Fig. 2). To determine the underlying genes involved in body size divergence in natural stickleback populations, we have chosen candidate genes from the somatotropic growth pathway (Fig. 1) and will determine which of these genes is associated with growth phenotypes. This summer, we used available whole-genome sequence data from collaborators at Stanford University to choose appropriate single nucleotide polymorphism (SNP) markers for genotyping. Our list of SNP markers, along with DNA extracts from stickleback specimens collected from large- and small-bodied stickleback populations, will be sent to a facility for TaqMan OpenArray (Applied Biosytems, USA) genotyping. Figure 5. Mean (± error) growth phenotype for genotypes at a hypothetical SNP marker, showing expected results if SNP genotypes at our candidate growth genes (Fig. 1) are associated with growth phenotypes within or among stickleback populations. A and B are alternative alleles at the hypothetical SNP marker. AA is homozygous for the A allele, BB is homozygous for B, and AB is heterozygous. Figure 4. TaqMan OpenArray genotyping. Hybridization probes for alternative alleles at a SNP hybridize to the SNP location. Probes contain both a reporter dye and a quencher, which inhibits fluorescence of the reporter dye. If the hybridization probe correctly matches its corresponding SNP allele, DNA polymerase (during PCR) will release the reporter dye from the quencher. If hybridization probes are a mismatch to the SNP allele, DNA polymerase will displace the probe instead of cleaving it, and reporters will remain attached to quenchers. Hybridization probes for alternative alleles have dyes that fluoresce at different wavelengths, and fluorescent emissions peaks are detected on the OpenArray imaging machine. If fluorescence peaks are present from only one dye in the sample, the specimen is homozygous for the allele corresponding to that dye. If fluorescence peaks are present from both dyes, the specimen is heterozygous. Figure is from the TaqMan OpenArray Getting Started Guide (Applied Biosystems, USA). Figure 2. Size divergence among stickleback populations. Fish are putative 2-year-olds from Barley Lake (top), Rabbit Slough (middle), and Herkimer Lake (bottom). The Rabbit Slough anadromous population represents the body size of the putative ancestor of the lake populations. Barley and Herkimer lake fish have evolved larger and smaller body size relative to the ancestral size. Figure 1. PIT1 and PROP1 control the differentiation of somatotroph cells, which synthesize growth hormone (GH) in the pituitary gland. GH is released into the bloodstream by the actions of GHRH and/or GHRL and their receptors (GHRHR and GHSR). GH binds to its receptor (GHR), which triggers the release of insulin- like growth factors (IGF-I and IGF-II). IGFs bind their receptors (IGF-1R and IGF- IIR), IGF binding proteins (IGFBPs), or INSR, triggering numerous downstream reactions that promote growth, development, and cell proliferation. The proteins circled in purple are those we have chosen to target in our genotype-phenotype association study. FGF2, MYOD1, and NPYP are not in the somatotropic growth pathway, but were found to be under directional selection in stickleback populations and are known to play a role in growth. Modified from Rodriguez et al. (2007). Gene names are given in Table 1. Table 1. List of SNP markers we chose for the genotype-phenotype association study. Gene (acronym; chromosome location) SNP location Intron/ Exon Conservation Pattern Growth hormone (GH2; XI) 16069693 intron not cons none 16070261 intron not cons none Growth hormone receptor 1 (GHr1; XIII) 5675328 intron highly cons size div 5677516 exon not cons none* 5678701 intron not cons none Insulin-like growth factor 1 (IGF1; IV) 22098554 intron not cons none 32103581 intron highly cons mar-fresh div 32108005 intron not cons size div Insulin-like growth factor 2 (IGF2; XIX) 13287332 intron not cons mar-fresh div 13289778 intron highly cons mar-fresh div 13290781 intron highly cons mar-fresh div Insulin-like growth factor 1 receptor (IGF1r; XIX) 16907938 exon highly cons mar-fresh div 16962799 intron highly cons mar-fresh div Insulin-like growth factor 1 receptor (IGF1r; II) 4581834 intron no data mar-fresh div Insulin-like growth factor binding protein 2, paralog 1 (IGFBP2; I) 21589495 exon not cons mar-fresh div 21593750 intron not cons none Insulin-like growth factor binding protein 2, paralog 2 (IGFBP2; XVI) 5908893 intron no data none Pituitary specific transcription factor 1 (PIT1; XVI) 13151323 intron not cons none 13152653 intron not cons none 13154316 intron not cons none Somatostatin 5 (STAT; XI) 5772720 intron not cons mar-fresh div Fibroblast growth factor (FGF2; IV) 3332048 intron near cons reg size div 3333874 intron no data none myogenic differentiation 1, paralog 1 (MYOD1; XIX) 9371313 intron not cons size div 9371918 exon highly cons size div myogenic differentiation 1, paralog 2 (MYOD1; II) 21931109 exon highly cons none 21931600 intron not cons none 21932462 exon highly cons none neuropeptide Y precursor (NPYP; X) 9526657 intron semi-cons none 9527397 exon highly cons none * Barley Lake has a unique allele cons = conserved; div = divergence, mar = marine, fresh = freshwater, reg = region Figure 3. Screen shot of the Stanford Stickleback Genome Browser, showing a 100 bp region in the 5’ flank of one of the paralogs of IGFBP2 (chromosome XVI: 5901577-5901677). The SNP indicated by the black arrow may be associated with growth phenotypes, since the large-bodied Barley Lake and marine populations have a thymine (black) at this position, while most other, average-bodied populations have the alternative allele (adenine; blue). Results and Future Work Our SNP list comprises 30 bi-allelic markers across 14 genes and their paralogs (Table 1). We have extracted DNA from 30-35 individuals from each of 16 populations (n = 500 specimens) and measured growth phenotypes (body length and weight). We will send our list of SNP markers (Table 1) and extracted DNA from stickleback specimens to a facility for TaqMan OpenArray genotyping (Fig. 4), which allows for simultaneous determination of genotypes at all SNPs for individual specimens. We will determine whether genotypes of specimens at each of our SNPs are associated with growth phenotypes within and among populations after accounting for age, sex, and degree of relatedness (Fig. 5). References Acknowledgements 1. Ulloa, P.E., P. Iturra, R. Neira, and C. Araneda, Rev Fish Biol Fisheries 21, 649 (2011). 2. Duan, C., Amer Zool 37, 491 (1997). 3. Perez-Sanchez, J., J.A. Calduch-Giner, M. Mingarro, S. Vega-Rubin de Ceelis, P. Gomez-Requeni, A. Saera-Vila, et al., Fish Physiol Biochem 27, 243 (2002). 4. Waters, M.J., H.N. Hoang, D.P. Fairlie, R.A. Pelekanos, and R.J. Brown, J Mol Endocrinol 36, 1 (2006). 5. Rodriguez, S., T.R. Gaunt, and I.N.M. Day, Hum Genet 122, 1 (2007). 6. Kim, D.S., N. Larsen, T. Short, G. Plastow, and M.F. Rothschild, Mammalian Genome 11, 131 (2000). 7. Feng, X.P., U. Kuhnlein, S.E. Aggrey, J.S. Gavora, and D. Zadworny. Poultry Science 76, 1770 (1997). 8. De-Santis, C., and D.R. Jerry, Aquaculture 272, 22 (2007). 9. Duquesnoy, P., M. Sobrier, B. Duriez, F. Dastot, C.R. Buchanan, M.O. Savage, et al., The EMBO Journal 13, 1386 (1994). 10. Duquesnoy, P., A. Roy, F. Dastot, I. Ghali, C. Teinturier, I. Netchine, et al., FEBS Letters 437, 216 (1998). 11. Baessler, A., M.J. Hasinoff, M. Fischer, W. Reinhard, G.E. Sonnenberg, M. Olivier, et al., Diabetes 54, 259 (2005). 12. Netchine, I., P. Talon, F. Dastot, F. Vitaux, M. Goossens, and S. Amselem, J Clin Endocrinol Metab 83, 432 (1998). 13. Aguiar-Oliveira, M., M.S. Gill, E.S. de A. Barretto, M.R.S. Alcantara, F. Miraki-Moud, C.A. Menezes, et al., J Clin Endocrinol Metab 84, 4118 (1999). 14. Flores- Morales, A., C.J. Greenhalgh, G. Norstedt, and E. Rico-Bautista, Mol Endocrinol 20, 241 (2006). 15. Quere, N., B. Guinand, H. Kuhl, R. Reinhardt, F. Bonhomme, and E. Desmarais, Aquat Living Resour 23, 285 (2010). 16. Chaoui, L., P. Gagnaire, B. Guinand, J. Quignard, C. Tsigenopoulos, M.H. Kara, et al., Mol Ecol 21, 5497 (2012). 17. Bell, M.A., and S.A. Foster, The evolutionary biology of the threespine stickleback, Oxford University Press (1994). 18. Hohenlohe, P.A., S. Bassham, M. Currey, and W.A. Cresko, Phil Trans R Soc B 367, 395 (2012). 19. Roesti, M., D. Moser, and D. Berner, Mol Ecol 22, 3014 (2013). We thank the Kingsley Lab at Stanford University for providing the SNP calls from whole-genome resequencing of stickleback populations. We also thank Howard Sirotkin and our families for making this work possible and for their support. This research was supported by the Chancellor’s Education Pipeline.