1. FACTORS ASSOCIATED WITH HPV VACCINATION RECEIPT AND INTEREST IN HPV VACCINE IN U.S. ADULTS
J. Lin BS, T.C. Clarke MS MPH, L.A. McClure MSPH, M.A. Ocasio BA, S.L. Tannenbaum PhD RD LD/N, W.G. LeBlanc PhD, C.A. Fernandez
MSEd, J. Kornfeld PhD, K.L. Arheart EdD, L.E. Fleming MD PhD, T. Asfar MD, D.J. Lee PhD
INTRODUCTIONINTRODUCTION RESULTSRESULTS
CONCLUSIONCONCLUSION
METHODSMETHODS
Funding for this study was fully provided by the Bankhead Coley Cancer Research Program Grant #1BG06-341963
11
Department of Epidemiology and Public Health; University of Miami Leonard M. Miller School of Medicine. Miami, Florida, USADepartment of Epidemiology and Public Health; University of Miami Leonard M. Miller School of Medicine. Miami, Florida, USA
Study Contact: JLin@med.miami.edu
HPV vaccination can protect against HPV infection-
associated cervical, vulvar, vaginal, penile, anal, and
oropharyngeal cancers.
Current recommendations for HPV vaccination are a
total of three doses given at 1 month, 3 months, and 6
months for males and females aged 11-26 years.
Examination of current literature reveals a general lack
of knowledge regarding HPV vaccination among the
U.S. population.
We measure lifetime HPV vaccination prevalence and
interest in getting the HPV vaccine among a national
sample of U.S. adults.
We used pooled data from the 2007-2010 National
Health Interview Survey (NHIS), which is an annual,
cross-sectional representative household survey of the
US civilian non-institutionalized population.
Analyses took into account sample weights and design
effects. Records from each survey year were weighted
according to person-level weights provided in the
annual NHIS data files.
We assessed demographic factors associated with
interest in getting the HPV vaccine and HPV vaccine
receipt among adults aged 18-69 years using
multivariable logistic regression.
All analyses were conduced at the Research Data
Center of the National Center for Health Statistics.
The study was approved by the University of Miami
Institutional Review Board.
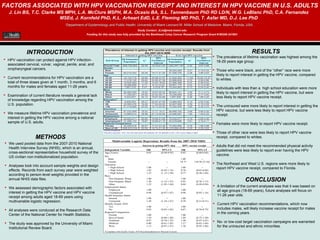
The prevalence of lifetime vaccination was highest among the
18-29 years age group.
Those who were black, and of the “other” race were more
likely to report interest in getting the HPV vaccine, compared
to whites.
Individuals with less than a high school education were more
likely to report interest in getting the HPV vaccine, but were
less likely to report HPV vaccine receipt.
The uninsured were more likely to report interest in getting the
HPV vaccine, but were less likely to report HPV vaccine
receipt.
Females were more likely to report HPV vaccine receipt.
Those of other race were less likely to report HPV vaccine
receipt, compared to whites.
Adults that did not meet the recommended physical activity
guidelines were less likely to report ever having the HPV
vaccine.
The Northeast and West U.S. regions were more likely to
report HPV vaccine receipt, compared to Florida.
A limitation of the current analyses was that it was based on
all age groups (18-69 years), future analyses will focus on
11-26 year olds.
Current HPV vaccination recommendations, which now
includes males, will likely increase vaccine receipt for males
in the coming years.
No- or low-cost target vaccination campaigns are warranted
for the uninsured and ethnic minorities.
Sub-Group
US Estimated
Population
%1
95%
Confidence
Interval
US Estimated
Population
%1
95%
Confidence
Interval
Overall Total 948,726,852 20.49 19.75-21.24 1,393,247,187 3.32 3.07-3.58
Gender
Male - - - 29,024,069 0.31 0.18-0.53
Female 82,210,343 20.45 19.71-21.20 91,526,705 4.28 3.96-4.63
Age
18-29 19,132,716 35.95 34.08-37.87 31,832,300 11.48 10.64-12.37
30-39 17,418,140 25.62 23.94-27.38 24,885,848 0.72 0.55-0.96
40-49 19,525,363 17.24 15.93-18.63 27,586,488 0.37 0.26-0.54
50-59 18,466,806 9.13 8.14-10.22 25,801,175 0.22 0.14-0.36
60-69 7,667,318 5.41 4.33-6.76 10,444,962 0.13 0.04-0.40
Race
White 65,580,455 19.53 18.67-20.42 96,644,141 3.40 3.11-3.73
Black 11,395,051 24.92 23.22-26.71 16,208,696 3.26 2.77-3.83
Other 5,234,837 22.13 19.67-24.80 7,697,936 2.46 1.89-3.20
Education2
<HS 9,935,833 25.21 22.97-27.59 14,984,553 3.14 2.52-3.92
HS 20,565,476 19.28 17.83-20.83 30,807,666 2.59 2.18-3.08
>HS 51,418,868 20.00 19.13-20.90 74,292,408 3.68 3.36-4.03
Insurance
Insured 67,042,569 18.53 17.77-19.31 96,668,705 3.68 3.68-4.00
Uninsured 14,880,014 28.98 27.13-30.90 23,466,287 1.82 1.49-2.22
Employment
Employed 50,922,211 20.80 19.96-21.66 76,532,077 3.16 2.89-3.46
Unemployed 31,288,133 19.87 18.69-21.10 44,018,696 3.61 3.16-4.11
Regional Comparisons
Florida 52,093,618 20.27 17.47-23.38 73,552,696 2.76 1.96-3.88
Rest of US 896,633,234 20.50 19.74-21.28 1,319,694,491 3.35 3.09-3.62
Ever had HPV vaccine
1
Percent (Prevalence)
2
Education responses: <HS= Less than high school (HS) graduate; HS= HS graduate or GED; >HS= Some college or higher
Interest in getting HPV vaccine
Prevalence of Interest in getting HPV vaccine and vaccine receipt: Results from
the 2007-2010 NHIS
Multivariable Logistic Regression: Results from the 2007-2010 NHIS
Interest in getting HPV shot HPV vaccine receipt
Independent Variable OR 95% CI OR 95% CI
Age (Years) 0.95 (0.94-0.95) 0.82 (0.80-0.84)
Sex
Male 1.00 --
Female -- -- 18.77 (10.56-33.34)
Education
> High School 1.00 -- 1.00 --
= High School 1.02 (0.92-1.14) 0.78 (0.63-0.96)
< High School 1.35 (1.15-1.58) 0.77 (0.58-1.04)
Race
Non-Hispanic White 1.00 -- 1.00 --
Non-Hispanic Black 1.30 (1.15-1.47) 0.93 (0.76-1.15)
Other 1.25 (1.05-1.48) 0.68 (0.49-0.94)
Employment Status
Employed 1.00 -- 1.00 --
Unemployed 0.96 (0.87-1.07) 0.98 (0.83-1.16)
Health Insurance Status
Insured 1.00 -- 1.00 --
Uninsured 1.49 (1.34-1.67) 0.39 (0.31-0.51)
Healthy People 2010
Yes 1.00 -- 1.00 --
No 0.92 (0.83-1.03) 0.67 (0.56-0.79)
Regional Comparisons
Florida 1.00 -- 1.00 --
Rest of South 1.10 (0.86-1.40) 1.04 (0.73-1.50)
Northeast 0.97 (0.76-1.25) 1.40 (0.97-2.01)
Midwest 0.80 (0.61-1.03) 1.17 (0.82-1.66)
West 1.13 (0.87-1.47) 1.36 (0.95-1.96)
*Compliant with Healthy People 2010 Recommendations for Physical Exercise