More Related Content
Similar to RA-ILD Poster 4-26 (20)
RA-ILD Poster 4-26
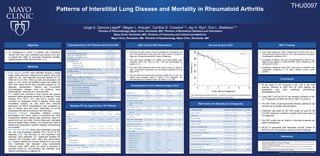
- 1. Patterns of Interstitial Lung Disease and Mortality in Rheumatoid Arthritis
Survival by type of ILD HRCT Findings
GAP and ILD-GAP scores could be calculated for 159 patients who
had PFTs performed at the study site center within 6 months of
diagnosis; 30 patients died within 3 years of diagnosis.
The GAP model predicted 31.0 deaths and demonstrated good
calibration (SIR: 0.97; 95% CI: 0.68, 1.38) and discrimination (c-
statistic: 0.71).
The GAP model performed well in both sexes, across the range of
ages, among both seropositive and seronegative patients and in all
types of ILD.
The ILD-GAP score reduced the predicted mortality risk, so only 18.3
deaths were predicted within 3 years of ILD diagnosis, this
demonstrated poor calibration (SIR 1.64; 95%CI 1.15, 2.35).
GAP and ILD-GAP Performance
References
To characterize a cohort of patients with rheumatoid
arthritis (RA) who have interstitial lung disease (ILD) and
to assess the utility of previously developed mortality
staging systems (GAP and ILD-GAP) (1, 2).
Objective
Methods
Characteristics of 181 Patients by type of ILD
Risk Factors for Mortality at ILD Diagnosis
© 2016 Mayo Foundation for Medical Education and Research
Jorge A. Zamora-Legoff1, Megan L. Krause1, Cynthia S. Crowson1,2, Jay H. Ryu3, Eric L. Matteson1,4
1Division of Rheumatology, Mayo Clinic, Rochester, MN; 2Division of Biomedical Statistics and Informatics
Mayo Clinic, Rochester, MN; 3Division of Pulmonary and Critical Care Medicine
Mayo Clinic, Rochester, MN; 4Division of Epidemiology, Mayo Clinic, Rochester, MN
THU0097
Baseline PFT by Type of ILD in 181 Patients
1. Ley B, Ryerson CJ, Vittinghoff E, Ryu JH, Tomassetti S, Lee JS et al. A multidimensional index and staging system for
idiopathic pulmonary fibrosis. Ann Intern Med. 2012;156:684-91.
2. Ryerson CJ, Vittinghoff E, Ley B, Lee JS, Mooney JJ, Jones KD et al. Predicting survival across chronic interstitial lung
disease: the ILD-GAP model. Chest.2014
3. Crowson CS, Atkinson EJ, Therneau TM. Assessing calibration of prognostic risk scores. Stat Methods Med Res.
2014;145:723-8.
4. Pencina MJ, D'Agostino RB. Overall C as a measure of discrimination in survival analysis: model specific population
value and confidence interval estimation. Stat Med. 2004;23(13):2109-23.
Initial chest imaging by HRCT showed that 54 (30%) had one or
more pulmonary nodules while 25 (14%) had emphysema in addition
to radiographic evidence of ILD.
Percentage of patients with lung nodules detected by HRCT at ILD
diagnosis was highest in those with NSIP (42%) compared to UIP
(20%) and OP (30%).
Qualitatively interpreted chest HRCT were read as consistent with
radiographic progression in 97 (65%) patients (during routine
practice).
Conclusions
Of the types of ILD occurring in RA, UIP is the most
common, followed by NSIP and OP. Most patients are
seropositive and have additional extra-articular
manifestations of RA.
Chest HRCT and low DLCO are sensitive indicators of RA-
ILD. Progression of NSIP and UIP on HRCT is common.
The GAP model could discriminate between patients at high
and low risk of mortality (discrimination).
Calibration was good for the GAP model but poor for the
ILD-GAP model as a predictor of death within three years of
ILD diagnosis.
The GAP model may be helpful in informing prognosis and
patient management.
RA-ILD is associated with decreased survival, similar for
NSIP and UIP, and remains a daunting clinical challenge.
Study subjects (n=181) were identified through a unified
single center electronic medical record system using ICD9
codes for ILD, with diagnosis occurring between 01-01-
1998 and 12-31-2014. Follow-up data was abstracted until
death or 12-31-2015. All identified cases that fulfilled the
1987 ACR criteria for RA were manually reviewed for ILD
diagnosis substantiation. Patients with concomitant
rheumatological disease (such as systemic lupus
erythematosus, vasculitis, etc.) were excluded.
PFT results were recorded in both volume and percent
predicted values abstracted closest to ILD diagnosis. These
included FVC, FEV1, TLC, and DLCO (results were
corrected for hemoglobin level). If baseline values were
unavailable, reasons for this were also manually
abstracted. All HRCT interpretations were completed as
part of clinical care and were interpreted by on-site
radiologists with skill and training in this technique.
Statistical Analysis. Descriptive statistics (means,
percentages, etc.) were used to summarize the data.
Comparisons between groups were performed using Chi-
square and rank sum tests. Survival rates were calculated
using the Kaplan-Meier method. Cox models were used to
examine the associations between baseline characteristics
and mortality.
The GAP and ILD-GAP scores were calculated using age,
sex, and lung physiology variables (FVC, DLCO) at ILD
diagnosis (1,2). The accuracy of risk predictions was
assessed using calibration (i.e., agreement between the
observed and predicted event rates) and discrimination
(i.e., whether patients are correctly ranked from low to high
risk). Calibration was assessed using standardized
incidence ratios (SIR), which are ratios of observed to
expected events (3). Discrimination was assessed using
Harrell’s concordance (c) statistic (4).
P value = 0.42