1. ! At the center of Nordstrom’s success as a high end department store retailer is its
inventory turnover. First, let’s take a look at the equation for calculating inventory turnover:
Inventory Turnover = COGS / Average Inventory
We find that over the course of three years from 2008 to 2010 inventory turnover rate has
improved continuously from 5.66 in 2008, 5.84 in 2009, to 5.93 in 2010. A higher inventory rate
indicates better inventory turnover because it results in fewer days in which goods will stay in
inventory. For Nordstrom we see that in 2010 when the rate is 5.93 inventory turnover is 62 days.
In 2008 when the rate is 5.66 turnover is 65 days.
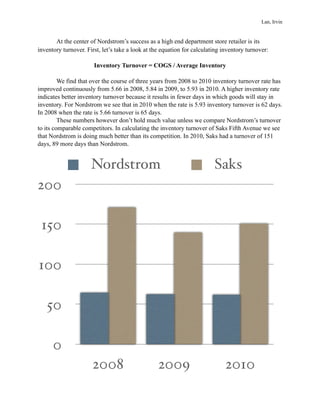
These numbers however don’t hold much value unless we compare Nordstrom’s turnover
to its comparable competitors. In calculating the inventory turnover of Saks Fifth Avenue we see
that Nordstrom is doing much better than its competition. In 2010, Saks had a turnover of 151
days, 89 more days than Nordstrom.
!
Nordstrom Saks
0
50
100
150
200
2008 2009 2010
Lan, Irvin
2. ! As a multibillion dollar retail firm, Nordstrom would fall into disarray without an
efficient and precise way to account for its inventory. To accommodate its needs Nordstrom uses
a perpetual inventory system with the weighted average cost method:
Weighted Average Cost = Cost of Goods Available / Total Units Available for Sale
Also, to record the value of its inventory Nordstrom uses the lower of cost or market
value principle. Using this principle, Nordstrom records the value of its inventory either at the
market value or the cost that it was purchased for from the vendor, whichever value is lower.
With so much movement of its inventory Nordstrom seems to be generating a lot of
profit, but close analysis of its net income and total sales shows that the difference between its
sales revenue and final profit is tremendous. The reason for this difference is that in order to get
from net sales to net income, we must first subtract the cost of goods sold as well as a multitude
of operating expenses from sales revenue. In 2010, total sales was 8,627 million but net income
was only 441 million. To understand what percent of sales Nordstrom really made we calculate
the profit margin:
profit margin = net income / total revenue
We find that that the profit margin of Nordstrom in the 2010 is 5 percent. For a retail
company 5 percent is a pretty good profit margin.
Total Expense
Net Income
0
2,250
4,500
6,750
9,000
2009 2010
Lan, Irvin
3. Now we take a look at Nordstrom’s current assets. In the year 2010, the majority of
Nordstrom’s current assets were from net receivables from sales of merchandise to customers.
Other current assets came from cash and inventory. We include inventory in current assets
because they can be readily transformed to cash within one year. From the past three years we
find that current assets come mostly from receivables, then inventory, then cash and finally other
current assets.
Taking a look at Nordstrom’s current liabilities we see that most of it comes from
accounts payable. Nordstrom keeps payable accounts for the many designer brands that it
purchases its inventory from. Also Nordstrom has a considerable amount of other current
liabilities which can include notes payable, loans used to finance the continual growth of the
company.
Lan, Irvin