Fluorescence Colormap Test Shows Minimal Effect on Resection Accuracy
1. The Fluorescent Colormap Test shows that the colormap
has no significant effect upon the resection. The average
accuracy values for each colormap are very similar.
The accuracy rate was more dependent upon the size and
shape of the tumor. For example, if the fluorescence was
not heavily concentrated upon a single, round area, the
test participant not only took a longer time, but also had a
markedly more difficult time resecting the tumor. Each
user also adapted to the test over time. Every user had a
significantly lower accuracy rate for their first trial and
progressively improved with each trial. Additionally,
although accuracy rates are very similar, most of the users
expressed difficulty when resecting tumors of monocolor
color maps, “cyans” and “greens”.
Creating the Phantom
The creation of a satisfactory phantom model was the
biggest challenge. A majority of the time was spent
altering the method by which the tumor was placed into
the agarose tissue slab. In the first few models, the tumor
easily separated from the healthy tissue, and the phantom
was too fragile. A satisfactory concentration of PBS and
agarose had to be determined, and the tumor could not be
perfectly cylindrical but irregularly shaped. Thus, foil was
used to create an irregularly shaped mold for the tumor.
However, even this irregularly shaped tumor could without
much effort be broken off from the healthy tissue. The
tumor had to be fused into the slab. Thus, a space for the
tumor was carved out of the solidified tissue phantom, the
liquefied tumor mixture was poured into the space, and
they were cooled together.
Bleeding of the Fluorescence
Under the microscope, one could observe the fluorescence
of the tumor to the surrounding area. This problem remains
unresolved.
Creating a Phantom Tumor Model:
1. Phosphate buffer saline (PBS) and agarose were mixed
together in specific concentrations.
2. Protoporphyrin IX (PPIX) of 0.1 µg/mL concentration
was added to the mixture.
3. The compound was microwaved and periodically
stirred to aid the dissolving process.
4. The phantom was then cooled for over two hours.
5. In the center of the solidified “healthy tissue” phantom,
a space for the tumor was cut out.
6. A new mixture of 1 µg/mL PPIX, agarose, PBS was
poured into the carved space. This is the tumor.
7. The slab, tumor model was then cooled for over two
hours.
Collecting Data for Colormaps
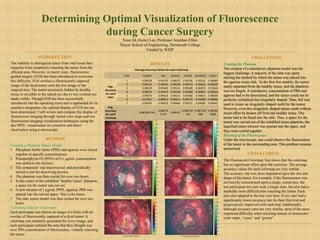
Each participate was shown an image of a brain with an
overlay of fluorescently captured of a dyed tumor. A
colormap was randomly generated for every image, and
each participant outlined the area that they thought was
over 50% concentration of fluorescence, virutally resecting
the tumor.
The inability to distinguish tumor from vital tissue bars
surgeons from completely resecting the tumor from the
affected area. However, in recent years, fluorescence
guided surgery (FGS) has been introduced to overcome
this difficulty. FGS overlays a fluorescently captured
image of the dyed tumor onto the live image of the
surgical area. The tumor previously hidden by healthy
tissue or invisible to the naked eye due to low contrast are
made visible. Though FGS has been successfully
introduced into the operating room and is applauded for its
seamless integration, the optimal display of FGS has not
been determined. I will review and compare the display of
fluorescence imaging through varied color maps and two
fluorescence imaging visualization techniques using the
dye PPIX: visualization on a monitor and direct
observation using a microscope.
Determining Optimal Visualization of Fluorescence
during Cancer Surgery
Yeun Ah (Irene) Lee, Professor Jonathan Elliot
Thayer School of Engineering, Dartmouth College
Funded by WISP
RESULTS
METHOD
INTRODUCTION CHALLENGES
CONCLUSIONS
Average Accuracy Values for each Colormap
User Cubeyf Hot Greens Comet Koufonisi Cyans
Avg.
Accuracy
for each
User
1 0.98238 0.99195 0.98632 0.99136 0.99136 0.96989
2 0.99523 0.99661 0.99539 0.99474 0.99343 0.99509
3 0.98559 0.99449 0.99131 0.99289 0.98378 0.97644
4 0.98972 0.95447 0.95039 0.95990 0.95891 0.99624
5 0.99270 0.99623 0.99617 0.99380 0.99055 0.98606
6 0.97661 0.98413 0.99411 0.98776 0.99598 0.99684
7 0.99242 0.99635 0.98460 0.99371 0.99586 0.99442
Avg.
Accuracy
for each
Colomap
0.987807143
0.98774
7143
0.98547
0.987737
143
0.987124
286
0.98785
4286
Colormap Greens
Colormap Cyans
Colormap Hot
Colormap Cubeyf
Colormap KoufonsiColormap Cubeyf