Methanol to Ethanol by Homologation - Kinetic Study
poster Irene_26_8_14
1. Solvothermal synthesis of some sodium – transition metal
framework compounds for solid – state batteries
Irene Munaò 1 and Philip Lightfoot 2
1, 2 EaStCHEM School of Chemistry, University of St Andrews, Purdie Building, North Haugh, St Andrews, Fife, KY16 9ST, UK
email: 1im49@st-andrews.ac.uk, 2pl@st-andrews.ac.uk
Introduction
In the last few years, two concepts have become key issues in daily life: energy conversion and energy storage. Recently the demand for large scale batteries to store the electricity in a
renewable and cleaner way has become important in the energy problem. Batteries are the best way to store chemical energy and to deliver it as electrical energy. In the last decades
an interest about low-cost, safe and rechargeable batteries with adequate properties (voltage, capacity, rate capability) has increased.
Since they were discovered, the best candidates for this role have been Li-ion batteries, which became the fundamental energy source for all portable electronic devices. However the
increasing cost of lithium, questions over its future availability, together with health and safety problems mean that, in the last few years, research for new materials to substitute lithium
has started. The best candidate is found in sodium. In contrast to lithium, sodium is cheap and unlimited and also, from the chemistry point of view, it is the second lightest and smallest
alkali metal next to lithium. Hence, rechargeable sodium ion batteries could be the promising candidates for a lot of applications. Due to the low cost, the availability and the abundance
of sodium, the interest in the synthesis of electrodes based on sodium has increased, especially using solvothermal methods.
Techniques
The syntheses were carried out in autoclaves (Fig.1) using hydrothermal and solvothermal methods.
The Single Crystal X-ray diffraction was conducted using a Rigaku SCX mini diffractometer (Fig.2).
The crystalline structures were resolved using WinGX and Diamond programs.
The powder patterns were obtained using a Panalytical Powder diffractometer (Fig.3)
Conclusion
According to the structures described above, there may be some possible relationships between the reactant stiochiometries, solvent and temperature used in the reactions and the type of crystalline
structures obtained.
The type of solvent used and the temperature of the reactions influenced the incorporation of sodium and the resultant crystal structure, as shown by Fe2(HPO3)3 and NaFe3(HPO3)2(H2PO3)6.
The same chemicals, temperatures and absence of solvent were used to synthesize NaFe3(HPO3)2(H2PO3)6 and NaFe(H2PO3)4. However, the increasing of the amount of NaF is followed by a change of the
crystalline structures.
Replacement of H3PO3 with H3PO4 at low temperature (100 °C) made it possible to obtain NaFe(H2PO4)3·H2O.
In NaFe(H2PO3)4 and NaFe3(HPO3)2(H2PO3)6 , Fe3+ would need to be oxidized to Fe4+ to permit deintercalation of Na; but Fe4+ is not very stable. Instead, in Fe2(HPO3)3, Fe3+ might be reduced to Fe2+ by
intercalation of Na, and, in NaFe(H2PO4)3 ·H2O, Fe2+ could be oxidized to Fe3+ by deintercalation of Na. For these reasons, Fe2(HPO3)3 and NaFe(H2PO4)3·H2O are potentially the most interesting materials
for sodium batteries. Future work will involve electrochemical studies of these materials.
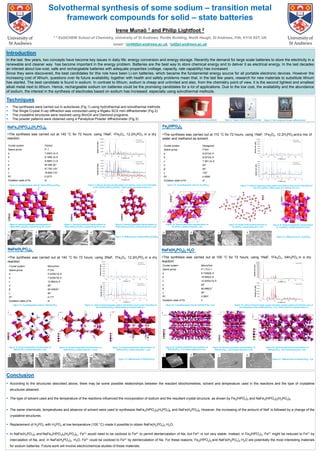
Fe2(HPO3)3
The synthesis was carried out at 110 °C for 72 hours, using 1NaF, 1Fe2O3, 12.2H3PO3 and a mix of
water and methanol as solvent.
Crystal system Hexagonal
Space group P 6/m
a 8.027(4) Å
b 8.027(4) Å
c 7.397 (4) Å
α 90°
β 90°
γ 120°
R1 0.0699
Oxidation state of Fe III
NaFe3(HPO3)2(H2PO3)6
The synthesis was carried out at 140 °C for 72 hours, using 1NaF, 1Fe2O3, 12.2H3PO3 in a dry
reaction.
Crystal system Triclinic
Space group P -1
a 7.5302 (4) Å
b 9.1696 (3) Å
c 9.5965 (1) Å
α 60.586 (8)°
β 67.762 (10)°
γ 78.808 (12)°
R1 0.0272
Oxidation state of Fe III
a b c db c d
Figure 1: Bomb autoclaves used for the synthesis Figure 2: Rigaku SCX mini diffractometer Figure 3: Pan Analytical Powder diffractometer
Figure 16: Crystallographic data for Fe2(HPO3)3 Figure 17: (above) General powder pattern and (below) zoom at low intensities of
the of Fe2(HPO3); Teflon peaks are marked with an x
Figure 18: General polyhedral representation of
Fe2(HPO3)3 viewed along the c axis
Figure 20: General polyhedral representation
of Fe2(HPO3)3 viewed along the b axis
Figure 19: Detail of the packed structure of
Fe2(HPO3)3 viewed along the c axis
Figure 21: SEM pictures of Fe2(HPO3)3
Figure 4: Crystallographic data for NaFe3(HPO3)2(H2PO3)6 Figure 5: (above) General powder pattern and (below) zoom at low intensities
of the of NaFe3(HPO3)2(H2PO3)6; Teflon peaks are marked with an x
Figure 6: General polyhedral representation of
NaFe3(HPO3)2(H2PO3)6 viewed along the a axis
Figure 7: General polyhedral representation of
NaFe3(HPO3)2(H2PO3)6 viewed along the b axis
Figure 8: General polyhedral representation of
NaFe3(HPO3)2(H2PO3)6 viewed along the c axis
Figure 9: SEM pictures of NaFe3(HPO3)2(H2PO3)6
a
NaFe(H2PO3)4
The synthesis was carried out at 140 °C for 72 hours, using 3NaF, 1Fe2O3, 12.2H3PO3 in a dry
reaction
NaFe(H2PO4)3·H2O
The synthesis was carried out at 100 °C for 72 hours, using 1NaF, 1Fe2O3, 34H3PO4 in a dry
reaction
Crystal system Monoclinic
Space group P 1 21/n 1
a 8.7449(8) Å
b 18.959(2) Å
c 12.5253(13) Å
α 90°
β 90.696(2)°
γ 90°
R1 0.0951
Oxidation state of Fe II
Crystal system Monoclinic
Space group P 2/m
a 5.2428(13) Å
b 7.0426(16) Å
c 15.864(4) Å
α 90°
β 93.428(5)°
γ 90°
R1 0.177
Oxidation state of Fe III
Figure 11: (above) General powder pattern and (below) zoom at low intensities of
the of NaFe(H2PO3)4; Teflon peaks are marked with an x
Figure 12: General polyhedral representation of
NaFe(H2PO3)4 viewed along the a axis
Figure 13: General polyhedral representation of
NaFe(H2PO3)4 viewed along the b axis
Figure 14: General polyhedral representation of
NaFe(H2PO3)4 viewed along the c axis
Figure 23: (above) General single crystal simulated powder pattern and (below) zoom at
low intensities of the of NaFe(H2PO4)3 ·H2O; Teflon peaks are marked with an x
Figure 24: General polyhedral representation of
NaFe(H2PO4)3 ·H2O viewed along the a axis
Figure 25: General polyhedral representation of
NaFe(H2PO4)3 ·H2O viewed along the b axis
Figure 26: General polyhedral representation of
NaFe(H2PO4)3 ·H2O viewed along the c axis
a b c d
Figure 27: SEM pictures of NaFe(H2PO4)3 ·H2O
Figure 10: Crystallographic data for NaFe(H2PO3)4 Figure 22: Crystallographic data for NaFe(H2PO4)3 ·H2O
b c da
Figure 15: SEM pictures of NaFe(H2PO3)4