
Recommended
More Related Content
What's hot
What's hot (20)
Similar to Imc niños 5 a 19 años
Similar to Imc niños 5 a 19 años (20)
More from IngridNayen
Recently uploaded
Recently uploaded (20)
Imc niños 5 a 19 años
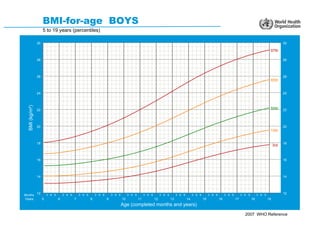
- 1. BMI-for-age BOYS 5 to 19 years (percentiles) 30 30 97th 28 28 26 26 85th 24 24 BMI (kg/m²) 22 50th 22 20 20 15th 18 18 3rd 16 16 14 14 Months 12 3 6 9 3 6 9 3 6 9 3 6 9 3 6 9 3 6 9 3 6 9 3 6 9 3 6 9 3 6 9 3 6 9 3 6 9 3 6 9 3 6 9 12 Years 5 6 7 8 9 10 11 12 13 14 15 16 17 18 19 Age (completed months and years) 2007 WHO Reference