SlideShare a Scribd company logo
1 of 12
Download to read offline
International Journal of Business Marketing and Management (IJBMM)
Volume 7 Issue 4 July-Aug 2022, P.P. 32-43
ISSN: 2456-4559
www.ijbmm.com
International Journal of Business Marketing and Management (IJBMM) Page 32
Financial Leverage and Corporate Investment: Evidence
from Cameroon
Marius Ayou Bene, Henri Daniel BELINGA MESSI
University of Douala - ENSET
Abstract: This paper analyzes the relationship between financial leverage and investment in the
Cameroonian context. To this end, using a sample of 1362 firms observed over the period 2015-2017, a
fixed-effect panel data instrumental variable regression model is estimated using the G2SLS method. The
results show that leverage positively influences investment. However, in the sample as a whole, and in the
individual SMEs, this relationship is not linear. It takes the form of an inverted "U". Specifically, at a low
level of debt, the relationship between financial leverage and corporate investment is positive. It becomes
negative at higher levels of leverage. Moreover, in turn, financial leverage is positively and significantly
determined by investment.
Keywords: leverage, investment.
I. Introduction
Investment decisions are considered one of the main research objects in finance, as they determine the
competitiveness and performance of firms (Sajid et al., 2016; Aivazian et al., 2005; Ahmad et al., 2021). The
link between financial leverage and firm investment is one of the most invested fields of research in this
literature (Modigliani and Miller, 1958; Firth, 2008). Some studies have generally attempted to analyze the
impact of financial leverage on investment (Aivazian et al, 2005; Danso et al, 2019). Others explore the link
between financial leverage and the nature of investment by distinguishing between investment in research and
development, and investment in tangible assets (Visconti, 2015; Moeller et al, 2016; Neil, 2018). A few stylized
facts nevertheless mark this literature on the relationship between these two concepts. Financial leverage is the
extent to which a firm uses debt (Hillier et al, 2010).
It is often viewed as a source of additional financing that allows the firm to acquire certain assets. It also
makes it possible, in a situation of asymmetric information, to discipline managers who tend to invest
unnecessarily (De Jong, 2002). Moreover, financial leverage is more suitable for financing tangible investments
than for investments in R&D, as the former offers more guarantees to lenders (Tjahjapranata, 2006; Neil, 2018).
A significant amount of work has been conducted on the relationship between leverage and firm
investment (Lang et al., 1996; Aivazian et al., 2005; Ahn et al., 2006; Visconti, 2015; Danso et al., 2019).
However, this literature has very little to do with the African context, but makes greater use of data from
developed countries such as the United States, or even Canada. In these countries, debt financing of investments
is provided by banks and bond markets. In both cases, lenders monitor and discipline the firms receiving such
financing (Firth, 2008). However, the results of these studies are not necessarily generalizable to developing
economies where the relationship between lenders and borrowers is driven by more acute informational
asymmetries. The value of such an analysis is, however, evident in many African countries where firms face
difficulties in accessing credit. To our knowledge, no study has yet analyzed this relationship in the
Cameroonian context.
Yet, a few stylized facts1
show that business investment expenditures in this context amounted to
680,432 billion Fcfa in 2017. They thus record an increase of 3.66% compared to 2016. This upward trend
results from the acquisition of tangible assets and the amount allocated to research and development (R&D).
At the same time, the financial leverage in these companies has experienced an increase
3.87% from 14,655 billion in 2016 to about 15,223 billion in 2017. These figures denote a simultaneous growth
in the leverage of companies, as well as in the investments made by them. This suggests a possible relationship
between these two important aspects of business life, the exploration of which would contribute to enlightening
1
Facts from the National Institute of Statistics (NIS) 2016 and 2017 Economic and Fiscal Reviews.
Financial leverage and corporate investment: evidence from Cameroon
International Journal of Business Marketing and Management (IJBMM) Page 33
managers and other stakeholders on the definition of policies to be adopted for the competitiveness of these
major players in the Cameroonian economy.
The objective of this paper is therefore to empirically verify the existence of a relationship between
leverage and firm investment in Cameroon. We use a sample of 1362 Cameroonian firms over the period 2015
to 2017. Using the two-stage generalized least squares (G2SLS) method, which takes into account a possible
endogeneity relationship between the two variables capturing investment and leverage respectively, we estimate
an instrumental variables regression model in panel data to determine the influence of leverage on firm
investment, and vice versa.
In what follows, we first discuss the link between leverage and firm investment through a review of the
existing literature. We then present the methodology adopted and the data used.
Finally, we present and discuss the results of the research.
I. Financial leverage and investment: a review of the literature
The relationship between leverage and investment has been discussed in the literature from multiple
theoretical perspectives. The agency theory (Jensen and Meckling, 1976), the theory of information asymmetries
(Myers and Majluf, 1984) and the theory of trade-offs (Kraus and Litzenberger, 1973) are the most widely used.
Based on these theories and on empirical work, we attempt to highlight this relationship in firms in Cameroon.
The link between leverage and investment has been studied from the perspective of agency theory.
Agency theory refers to the relational problems that exist when there is a defined relationship between the
principal and the agent. Agency problems arise when conflicts of interest arise between the different partners
involved in the operation of the firm, highlighting the fragility of their relationship (Jensen and Meckling, 1976).
These conflicts can lead to two different behaviors: underinvestment and overinvestment. The conflict can be
between shareholders and creditors. In this context, Myers (1977) analyzes the possible externalities generated
by debt on the optimal investment strategy defined by managers, and shows that debt leads to situations of
underinvestment.
Indeed, when a firm has excessive debt, managers tend to reduce investment even in profitable projects,
since a portion of the profits remunerate creditors instead of going entirely to shareholders. Firms with high
growth opportunities are most affected by the risk of underinvestment (Rajan and Zingales, 1995; Titman and
Wessels, 1988).
Furthermore, the literature identifies a possible problem of overinvestment (Jensen, 1986; Stulz, 1990) in
the case of conflict between the manager and the shareholders. The policy of overinvestment is to reinvest
excess cash in investment projects with low or even negative net present value. Executives who do this expand
the size of the firm beyond its optimal level in order to have greater resources and to increase their career
opportunities.
Thus, managers can invest in specific assets that are a form of shield that allows them to become
entrenched in order to make their replacement difficult or impossible (Shleifer and Vishny 1997). Management's
ability to pursue such a policy is constrained by the availability of excess cash flow, and this constraint can be
further reinforced by debt. When a firm takes on debt, it commits itself to servicing the debt. This forces
management to honor these commitments with funds that could have been allocated to poor investment projects.
Thus, leverage is a mechanism for overcoming the problem of overinvestment (De Jong; 2002), suggesting a
negative relationship between debt and investment for firms with poor growth opportunities.
Several empirical studies have examined the relationship between firm leverage and investment. Lang,
Ofek, and Stulz (1996) and Aivazian, Ge, and Qiu (2005) use data from U.S. industrial firms and data from
Canadian firms, respectively. Their results show that leverage is significantly and negatively related to
investment. Using Turkish firm data, Umulte (2010) studies the relationship between leverage and investment
decisions in emerging countries. The results reveal that leverage has a negative and significant effect on
investment only for firms with low growth opportunities. Using the Vietnamese case, Vo (2019) finds a
significant and negative relationship between leverage and investment. Denis and Denis (1993) find that, an
increasing use of financial leverage leads to a decrease in capital expenditure. Other authors (Ahn and Denis,
2006; Lang and Stulz, 1994; Ruland and Zhou; 2005) analyze the impact of financial leverage on investment in
diversified firms. The results show that the use of financial leverage negatively influences investment in these
entities. This link is more significant for firms operating in high value-added business segments.
Firth and Wong (2008) examine the relationship between leverage and investment in the Chinese context of
state-owned banks. Their results show that there is a negative relationship between leverage and investment.
This negative relationship is weaker in firms with low growth opportunities and poor operating performance
compared to firms with high growth opportunities and good operating performance. The negative relationship
between leverage and investment is weaker in firms with high levels of public ownership.
Financial leverage and corporate investment: evidence from Cameroon
International Journal of Business Marketing and Management (IJBMM) Page 34
The relationship between financial leverage and investment is also highlighted through the prism of the
theory of information asymmetries (Stiglitz and Weiss, 1981; Myers and Majluf, 1984). Information
asymmetries refer to the informational disparity between firms resorting to debt, and creditors willing to, or
having, granted such financing.
In an environment of asymmetric information, firms' investment decisions are affected by the behavior of
capital providers (Morellec and SchΓΌrhoff, 2011; Danso et al., 2019). The latter may indeed demand a higher
risk premium, or conversely ration credit. When access to credit becomes difficult and costly, firms abandon
projects, leading to underinvestment (Myers and Majluf, 1984).
Fazzari and Athey, (1987) examine the impact of information asymmetry on the link between cash flow
and investment in U.S. firms and observe that investment becomes more dependent on internal funds under
information asymmetry. Baxamusa, Mohanty, and Rao (2015) show that U.S. firms tend to use internal
resources to finance projects with high information asymmetry, research and development investments in
particular. They also show that debt is used more for investments characterized by less asymmetric information,
such as marketable securities. Ahmad et al (2021), using data from Pakistan, show that the presence of
asymmetric information increases the negative effect of financial leverage on firm investment.
Furthermore, some studies have analyzed the relationship between financial leverage and investment in
R&D and tangible assets. Neil (2018) shows that financial leverage allows US firms to acquire tangible and
intangible assets. Indeed financial leverage helps firms to increase their production capacity and improve their
productivity. GarcΓ­a-Posada et al (2020) analyze the determinants of investment in tangible assets and R&D of
Spanish firms. They find that cash flow is the most important source of financing for R&D, while long-term
debt is used to finance tangible assets.
In Africa, several studies have attempted to analyze the link between financial leverage and investment
decisions. Using data on listed firms in South Africa, Mondosha and Majoni, (2018) find a negative relationship
between leverage and investment. Vengesai and Kwenda, (2018) study the impact of financial leverage on
investment of African listed firms. The results reveal that financial leverage has a negative impact on
investment. Nyale (2010), based on firms in Kenya, validates the hypothesis that leverage negatively influences
investment decisions. Odit and Chittoo, (2008) find a significant negative relationship between leverage and
investment for Mauritian firms. This relationship is stronger in firms with low growth opportunity. From the
above we formulate the following hypothesis:
H1: Financial leverage (debt) negatively influences firm’s investment in Cameroon
Other research works have studied the relationship in the opposite direction (Koksal et al, 2013;
Degryse et al, 2010), analyzing the influence of assets on leverage.
Indeed the asset structure plays an important role in determining the capital structure (Ellili and Farouk,
2011). The tradeoff theory (Stiglitz, 1969; Kraus and Litzenberger, 1973) provides a good perspective for
analysis. This theory consists in setting a level of debt that allows the cost of debt to be equalized with the tax
advantage that debt provides. In fact, excessive debt increases the risk of default by the company, which is
accompanied by financial difficulties. These financial difficulties will worry the investors and may therefore
renounce to grant new credits. However, a firm that has significant tangible assets reduces the costs of
bankruptcy and can use these assets as collateral to issue new debt (Rajan and Zingales, 1995). Compared to
intangible assets, tangible assets suffer less loss of value in distress. Thus, from a trade-off perspective, tangible
assets have a significant effect on the costs of financial distress.
Harris and Raviv (1991) argue that tangible assets are the collateral for debt and increase the net asset
value. Thus, in bankruptcy, tangible assets reduce exposure to default, and enhance the possibility of repaying
creditors. Harc (2015), using Croatian SMEs as a case study, shows that tangible assets positively and
significantly influence financial leverage. He further concludes that said SMEs use tangible assets as collateral
to facilitate access to long-term credit. Butt et al. (2013) based on data from Pakistan find a positive relationship
of tangible assets on debt. De Jong et al. (2008) study the determinants of leverage in 42 countries and find a
positive relationship between leverage and tangible assets.
In addition, the contribution of investments to the acquisition of financial resources through debt
depends on the type of fixed assets that are dominant. In some firms, tangible assets can support the desired
leverage, while intangible assets have no impact on leverage. In contrast, in firms with limited tangible assets,
intangible assets increase, and may influence leverage (Moeller et al, 2016). Indeed although some
characteristics of intangible assets, such as high valuation risk and low ability to provide collateral, may
discourage debt financing, they can also generate large cash flows, thus supporting leverage. Moreover, the
information asymmetry and moral hazard inherent in intangible assets diminish when intangible assets are liquid
and easily tradable (Sheleifer and Vishny, 1992; Loumioti, 2012). Using data from U.S. firms, Morellec (2001)
analyzes the relationship between asset liquidity and capital structure. The results show that asset liquidity
increases debt capacity. Nakamura (2001) estimates that one-third of the value of intangible assets of US firms
is related to the value of its capital. Based on the above, we hypothesize that:
Financial leverage and corporate investment: evidence from Cameroon
International Journal of Business Marketing and Management (IJBMM) Page 35
H2: Firms' investment significantly increases their debt capacity in the Cameroonian context.
However, the hypothesis of the non-linearity of the causal relationship between the financial leverage
of firms and their investments arises with acuity.
Indeed, the agency cost theory (Jensen and Meckling, 1976) suggests that at a lower level, debt has a
disciplining effect on company managers. On the other hand, when debt becomes high, the probability of
bankruptcy increases, and a misallocation of resources becomes more possible.
The conclusions of previous studies are not consensual on the impact of financial leverage on investment.
Indeed, some authors (Modigliani and Miller, 1963) show that the tax advantages provided by debt and the
reduction of agency costs between shareholders and managers (Ross 1977) have positive effects on investment.
On the other hand, excessive debt can lead to underinvestment. Indeed, when the conflict pits shareholders
against creditors, managers tend to reduce investment, even in profitable projects. In this case, part of the profits
remunerate the creditors instead of going entirely to the shareholders (Myers, 1977).
Yarba (2021) provides significant evidence of an inverted "U" relationship between leverage and
investment based on firm data in Turkey. The findings of his investigations indicate that leverage increases
investment up to a certain level. As leverage becomes higher, its impact on investment becomes negative. This
non-monotonic relationship is evident for all groups of firms.
Cleary et al (2007) analyze the effect of equity on investment for US firms. The results reveal a U-
shaped functional relationship. At low levels of equity, the relationship is negative; it becomes positive as equity
becomes more important. Shukla and Shaw (2021) analyze data from Indian firms and find a non-linear
relationship between debt and investment. Hernando and Martinez-Carrascal (2008) find a non-linear
relationship between debt and investment in Spanish firms. According to these authors, this relationship has an
"S" shape. Gebauer et al (2018) validate the hypothesis of the non-linearity of the relationship between debt and
investment in a European context. From the above, we hypothesize that:
H3: The relationship between leverage and investment assumes an inverted U shape. In this case, at a
low level of leverage the relationship is positive; it becomes negative with increasing leverage.
II. Data and model specification
II.1. Data
The data used in this work come from the National Institute of Statistics of Cameroon (INS). They are
based on the year-end balance sheets and income statements of 1,500 firms in several sectors of activity over the
period 2014-2017. They allowed us to assess the financial situation of the companies concerned. After the
necessary cleaning operations of the initial data and other statistical processing, the final working sample
retained 1362 companies.
The variables used in this study were identified to satisfy the objective of testing for a bidirectional
causal relationship between leverage and investment.
Financial leverage refers to the propensity for a firm to resort to debt (Hillier et al. 2010). The literature
indicates several ways to measure it. Aivazian et al (2005) use two alternative measures of leverage. One is the
book value of total liabilities, excluding equity, divided by the book value of total assets. Another way to
measure it is to divide long-term debt by total assets. The first measure does not distinguish between short-term
and long-term debt, while the second emphasizes the dominant role of long-term debt as a source of investment
financing. However, this work considers the former measure because, although the use of short-term debt
exposes the firm to renewal constraints, it is often used to finance investment.
Investment refers to the acquisition of a durable good. Previous work (Onomo et al., 2018) has
measured investment by calculating the change in investment from the previous year. Sall (2002), in studying
the source of investment financing for Senegalese SMEs, captured investment by the investment rate, which is
the ratio of the value of investment to sales. Tioumagneng (2012) measures investment by total capital
expenditures on intangible assets. Other authors (Danso, Lartey, Fosu, Owusu-Agyei, and Uddin, 2019; Firth et
al, 2008) measure investment by taking the change in property, plant, and equipment which is scaled by
beginning of period property, plant, and equipment. The different variables used are summarized in the table 1
below.
Table 1 : variables of the study
Codes Variable titles Calculation method
Tot_leverage Financial leverage Total debt/total assets
Inv_intensity Investment Delta gross assets/total assets(t-1)
Roa Economic profitability ratio Operating income/Total assets
Growth _opp Opportunities for growth (Ξ” sales)/sales (t-1)
Size Company size Log (Total assets)
Financial leverage and corporate investment: evidence from Cameroon
International Journal of Business Marketing and Management (IJBMM) Page 36
Cash-flow Cash-flow Cash-flow/total assets(t-1)
Inv_caf Capacity to finance investment Investment / cash flow
Turnover Asset turnover ratio Sales/Total assets
Chargefi_caf ability to bear financial burdens Financial expenses/Caf
managmt_qlty Management quality Operating expenses/total assets
Liquidity General liquidity Current assets/current liabilities
II.2. Specification of the empirical model
In this work, we use instrumental variable (IV) regression in panel data to test for a link between
leverage and investment. The choice of this model is justified by the fact that linear regression models can suffer
from simultaneous causality problems. If this is the case, the error term is correlated with the exogenous
variables of interest, so the estimated parameters will be biased, and multiple regression cannot solve the
problem.
A general technique for obtaining a consistent estimator of the parameter of interest is the two-stage
generalized least squares (G2SLS) method2
, applied that accounts for a possible endogeneity relationship. This
model is, in general, specified as follows:
𝑦𝑖𝑑 = 𝒀𝑖𝑑𝛾 + 𝑿1𝑖𝑑𝛽 + ¡𝑖 + πœˆπ‘–π‘‘
Where 𝑦𝑖𝑑 is the dependent variable. 𝒀𝑖𝑑 is a vector (1 Γ— π‘˜1) of observations on π‘˜1 endogenous variables,
and these variables can be correlated with the πœˆπ‘–π‘‘ which is the specific error term. 𝑿1𝑖𝑑 is a vector (1 Γ— π‘˜2) of
observations on the exogenous variables. 𝛾 and 𝛽 are vectors (π‘˜1 Γ— 1) and (π‘˜2 Γ— 1) of coefficients respectively.
Finally, πœ‡π‘– can be considered as identically and independently distributed random variables in the panel.
Specifically, given that there is a single endogenous variable such as π‘˜1 = 1but several exogenous variables such
as π‘˜2 > 1, the model is as follows:
𝐼𝑛𝑣_𝑖𝑛𝑑𝑒𝑛𝑠𝑖𝑑𝑦𝑖𝑑 = π›Ύπ‘‘π‘œπ‘‘_π‘™π‘’π‘£π‘’π‘Ÿπ‘Žπ‘”π‘’π‘–π‘‘ + πœ·π‘Ήπ’‚π’•π’Šπ’1𝑖𝑑 + ¡𝑖 + πœˆπ‘–π‘‘ (1)
Where π‘™π‘’π‘£π‘’π‘Ÿπ‘Žπ‘”π‘’π‘–π‘‘ and 𝐼𝑛𝑣_𝑖𝑛𝑑𝑒𝑛𝑠𝑖𝑑𝑦𝑖𝑑 are the firm's leverage and investment, respectively. This work also
explores the possibility of a non-linear relationship between investment and leverage. For Hernando and
Martinez-Carrascal (2008), the method of establishing the nonlinear relationship requires the use of thresholds
that are exogenously set and thus somewhat arbitrary. Therefore, we analyze a quadratic function to test for
nonlinearity. The quadratic function is of the following form:
𝐼𝑛𝑣_𝑖𝑛𝑑𝑒𝑛𝑠𝑖𝑑𝑦𝑖𝑑 = 𝛾1π‘‘π‘œπ‘‘_π‘™π‘’π‘£π‘’π‘Ÿπ‘Žπ‘”π‘’π‘–π‘‘ + 𝛾2π‘‘π‘œπ‘‘_π‘™π‘’π‘£π‘’π‘Ÿπ‘Žπ‘”π‘’π‘–π‘‘
2
+ πœ·π‘Ήπ’‚π’•π’Šπ’π‘–π‘‘ + ¡𝑖 + ɛ𝑖𝑑 (2)
The sample is made up of 89.50% SMEs and 10.50% large enterprises. It includes 85.46%, 11.89% and
2.65% of companies in the tertiary, secondary, and primary sectors respectively. For all companies, the average
annual growth of investments is 4.32%. It is 4.18% in SMEs and 5.55% in large companies. Moreover,
according to the results of the mean-comparison test in table 4a, the difference in terms of the 2014-2017
average investment growth between small and medium-size enterprises and large companies is significant. In
addition, Figure 1 shows that about 60% of the firms in the sample has a 4-years average investment change
comprised in the interval . As for the sectors of activity, the annual investment change is, on average,
4.36%, 3.85% and 5.08% respectively in firms in the tertiary, secondary and primary sectors.
Also, the average leverage is 53.87 percent overall. It is 53.47 percent for SMEs and 57.35 percent for
large firms. Furthermore, the mean-comparison test reported in Table 4b shows that the difference in the 4-year
mean of the average leverage is significant between SMEs and large companies. Firms in the primary sector
have an average leverage of 58.06%, (57.81%) for those in the secondary sector and tertiary sector records a
leverage of 53.20%. The investment self-financing ratio is 2.87% on average. Furthermore, the companies in
2
We suggest that the interested reader explore the work of Balestra and Varadharajan-Krishnakumar (1987)
for further reading.
Financial leverage and corporate investment: evidence from Cameroon
International Journal of Business Marketing and Management (IJBMM) Page 37
the sample achieve an average of 1.27 points of turnover per unit of assets, while their average operating
expenses are 1.43 times higher than their total assets.
The coverage of financial expenses by equity is 1.3%. For most of these variables, the dispersion is
small and ranges from 0.05 to 2.37. The result of this statistical description is listed in Tables 2 and 3 below.
Table 2 : Descriptive statistics
Variables Obs Mean Std. Dev. Min Max
tot_leverage 4,086 0.5387 0.2870 0.0000 0.9994
inv_intensity 4,086 0.0432 0.2318 -0.9906 0.9949
Roa 4,086 0.0213 0.4162 -4.1907 3.1533
growth_opp 4,086 0.1548 0.7445 -1.0000 4.8664
inv_caf 4,086 0.0287 1.0915 -5.8860 5.8589
cash-flow 4,086 -0.2249 0.9421 -4.9456 4.6350
Size 4,086 18.6731 2.3703 10.4929 27.5250
managmt_qlty 4,086 1.4350 1.1303 0.0000 6.7334
charfi_caf 4,086 0.0131 0.0504 0.0000 1.1695
turnover 4,086 1.2771 0.9463 0.0000 4.8745
liquidity 4,086 0.9988 0.9320 0.0000 6.3159
Table 3 : Characteristics of the sample by size and industry
Variable Obs Mean Std. Dev. Min Max
By company size
SME
tot_leverage 3,657 0.5347 0.2931 0.0000 0.9987
inv_intensity 3,657 0.0418 0.2424 -0.9906 0.9949
GE
tot_leverage 429 0.5735 0.2250 0.0000 0.9994
inv_intensity 429 0.0555 0.1031 -0.3948 0.8108
By sector
Primary
tot_leverage 108 0.5806 0.3005 0.0000 0.9951
inv_intensity 108 0.0508 0.2208 -0.9906 0.9698
Secondary
tot_leverage 486 0.5781 0.2387 0.0000 0.9987
inv_intensity 486 0.0385 0.1795 -0.8817 0.9152
Tertiary
tot_leverage 3,492 0.5320 0.2922 0.0000 0.9994
inv_intensity 3,492 0.0436 0.2385 -0.9902 0.9949
Financial leverage and corporate investment: evidence from Cameroon
International Journal of Business Marketing and Management (IJBMM) Page 38
Table 4a : Comparison of firms' investment growth by type of firm
ttest avg_inv_intensity , by ( firm_type_1 ) unequal
Two-sample t test with unequal variances
Group Obs Mean Std. Err Std. Dev [95% Conf. Interval]
SME 1,219 0.0418 0.0036 0.1262 0.0347 0.0489
LC 143 0.0555 0.0050 0.0604 0.0455 0.0655
combined 1,362 0.0432 0.0033 0.1210 0.0368 0.0497
diff -0.0137 0.0033 -0.0259 -0.0015
diff = mean (1) - mean (2) t = -2.2088
Ho : diff = 0 Satterthwaite's degrees of freedom = 315.177
Ha : diff < 0 Ha : diff != 0 Ha : diff > 0
Pr (T < t) = 0.0140 Pr (|T| > |t|) = 0.0279 Pr (T > t) = 0.9860
Table 4b : Comparison of firm leverage by type of firm
ttest avg_tot_leverage , by ( firm_type_1 ) unequal
Two-sample t test with unequal variances
Group Obs Mean Std. Err Std. Dev [95% Conf. Interval]
SME 1,219 0.5347 0.0742 0.2590 0.5201 0.5492
LC 143 0.5735 0.0178 0.2132 0.5383 0.6088
combined 1,362 0.5387 0.0069 0.2548 0.5252 0.5523
diff -0.0389 0.0193 -0.0769 -0.0008
diff = mean (1) - mean (2) t = -2.0134
Ho : diff = 0 Satterthwaite's degrees of freedom = 194.779
Ha : diff < 0 Ha : diff != 0 Ha : diff > 0
Pr (T < t) = 0.0227 Pr (|T| > |t|) = 0.0454 Pr (T > t) = 0.9773
-0.80
-0.60
-0.40
-0.20
0.00
0.20
0.40
0.60
0.80
0 200 400 600 800 1000 1200 1400
variation
of
firm's
investment
enterprises
Figure 1: Average (2014-2017) firms' investment growth
Financial leverage and corporate investment: evidence from Cameroon
International Journal of Business Marketing and Management (IJBMM) Page 39
II. Results
The empirical results reported in Tables 5 and 6 show that leverage and investment have a positive and
significant linear relationship. Indeed, an increase in financial leverage of 1% leads to an increase in investment
of 0.48%. This can be explained by the fact that the debt contracted is effectively allocated to investment, and
Cameroonian firms use it efficiently in investment projects. Thus, financial leverage has a direct and positive
effect on the investment of the firms studied. This result is not consistent with the agency theory (Jensen and
Meckling, 1976), nor with the findings of Aivazian et al. (2005), Mondosha and Majoni, (2018) and Vengesai
and Kwenda, (2018), which show that financial leverage acts negatively on the level of investment.
Indeed, since firms in Cameroon are mostly SMEs, where the figures of the manager and the
shareholder often merge, agency conflicts are less prevalent. The owner-manager then tends to effectively use
debt to finance the investment. Our first hypothesis is not validated.
Moreover, while leverage has a significant and positive influence on investment in SMEs, this
relationship is more important in large firms. Indeed, a 1% increase in financial leverage translates into a 0.46%
and 0.93% increase in investment respectively. Large companies invest twice as much as SMEs. This is justified
by the fact that, unlike SMEs, large companies make better use of the financial resources acquired through debt,
and allocate them to the best investment projects.
Furthermore, the results of the Hausman test (Table 7), which verifies the existence of endogeneity
between two variables, reveal that there is indeed a difference between the instrumental variable estimator and
the OLS estimator, confirming that financial leverage is endogenous in its relationship with investment. Indeed,
the latter in turn significantly and positively influences the financial leverage of firms in Cameroon. Firms that
have invested in both tangible and intangible assets use these assets as collateral to solicit credit. This result is
consistent with the predictions of trade-off theory (Stiglitz, 1969; Kraus and Litzenberger, 1973) and empirical
work (Harc, 2015; Butt et al. 2013). The hypothesis is 2 validated.
Furthermore, the results show that investment is negatively determined by the square of leverage. This
suggests a non-linear relationship between the two variables. This result is consistent with predictions of
underinvestment (Myers, 1977) and overinvestment (Jensen 1986) and the findings of (Ahn and Denis, 2006;
Lang and Stulz, 1994; Ruland and Zhou; 2005). In these firms, debt plays the role of disciplining managers who
tend to waste equity. Specifically, when debt is low for financing purposes, the relationship between leverage
and investment is positive. It becomes negative at high levels of leverage. This suggests a relationship that takes
the form of an inverted U. This result is consistent with the predictions of Hernando and Martinez-Carrascal
(2008) and Gebauer et al. (2018) and Yarba (2021) who find a non-linear relationship between leverage and
investment of European firms. Our third hypothesis is validated. However, this inverted-U relational form is
only valid in the subsample of SMEs. The relationship is linear in large firms.
In terms of control variables, investment is positively determined by the cash flow and cash flow
capacity of firms in Cameroon.
An increase in cash flow of 1 percentage point leads to an increase in investment of 0.02 (0.063). This
result is also valid for the SME subsample. In large companies, only cash flow is positively related to
investment.
Financial leverage is positively influenced by growth opportunities and size, while it is negatively
related to cash flow and liquidity. Indeed, when growth opportunities increase by 1%, financial leverage also
increases by 0.9%. This situation translates into the fact that in order to seize growth opportunities, companies
tend to take on debt to finance investment. Cash flow has a significant influence on leverage and investment.
The larger the size of the company, the easier it is to access debt. This is explained by the fact that larger
companies have less asymmetric information about their economic and financial health. An increase in cash
flow of 1% leads to a reduction in financial leverage of 0.1%. This reflects the fact that a firm requires less
external capital, debt in this case, when it has sufficient cash flow to finance its investments. This result is not
consistent with the predictions of the agency theory of Jensen and Meckling (1976), and the conclusions of
Jensen (1986). In these firms, however, excess cash flow leads managers to choose unprofitable projects in order
to gain a foothold.
Finally, management quality has a positive effect on the use of financial leverage. Thus, a 1% increase
in operating expenses per unit of assets leads to a greater use of debt of about 0.0042 points. Although
negligible, this result suggests that firms that have difficulty controlling their expenses make greater use of debt
to meet their investment needs.
Financial leverage and corporate investment: evidence from Cameroon
International Journal of Business Marketing and Management (IJBMM) Page 40
Table 5 : Relationship between financial leverage and investment
Table 6 : Relationship between financial leverage and investment by type of firm
Financial leverage and corporate investment: evidence from Cameroon
International Journal of Business Marketing and Management (IJBMM) Page 41
Table 7 : Endogeneity test
Coefficients
(b) (B) (b-B) sort(diag(V_b-V_B))
Consistent Efficient Difference H.E.
tot_leverage 0.4764 -0.0003 0.4767 0.1146
growth_opp 0.0069 0.0255 -0.0186 0.0044
inv_caf 0.0187 0.0089 0.0099 0.0028
cashflow 0.0637 0.0062 0.0574 0.0145
Roa 0.0161 0.0128 0.0033 0.0121
chi2(5) = (b-B)'[(V_b-V_B)^(-1)](b-B)
= 36.91
Prob>chi2 = 0.0000
III. Conclusion
Financial leverage in a foreign context has a negative effect on the level of investment. It sometimes
plays the role of disciplining the manager and attenuates overinvestment. This study aimed to empirically
establish the relationship between financial leverage and investment in firms in the Cameroonian context. We
adopted an instrumental variables regression model applied to fixed-effect panel data to mitigate the possibility
of the endogeneity problem of leverage and investment. The analysis was done on a sample of 1362
Cameroonian firms over the period 2015 to 2017.
It appears that financial leverage positively influences investment, and this relationship is endogenous.
Thus, debt facilitates firm’s investments in Cameroon. The higher the debt, the higher the level of investment.
However, this relationship is not linear. It takes the form of an inverted "U". This is due to the fact that, at
higher level of indebtness, the relationship turns negative. It stands for the reason that, when the optimal level of
firm leverage is achieved, the financial expenses due to the excess leverage become higher than the excess
return generated by the investments.
As for the analysis of the relationship by firm type, the results, remain unchanged for both sub-sample.
Indeed, financial leverage positively influences investment in both large firms and SMEs. However, the non-
linearity hypothesis of the relationship does not hold in large companies.
In African economies and particularly in Cameroon, it is advisable for business leaders to take into
account the monetary policy put in place by the authorities. This would allow the company to opt for an
adequate financing policy that balances the benefits and costs of debt, and the realization of investments
necessary for business growth.
While this work has yielded interesting results on the relationship between leverage and investment,
some limitations must be highlighted. The study was based on data from the National Institute of Statistics. The
quality of the results obtained depends on the reliability of the data used. This research also presents problems of
generalization. The results may not be generalizable to other African countries. There are differences in
economic policies from one country to another and in access to capital markets, corporate governance structures.
Lastly, it may be interesting to find out the optimal level of firm leverage in the Cameroonian context.
Bibliography
[1]. Ahmad, M. M., Hunjra, A. I., and Taskin, D. (2021). Do asymmetric information and leverage affect
investment decisions? The Quarterly Review of Economics and Finance.
[2]. Ahn, S., Denis, D. J., and Denis, D. K. (2006). Leverage and investment in diversified firms. Journal of
financial Economics, 79(2), 317-337.
[3]. Aivazian, V. A., Ge, Y., and Qiu, J. (2005). The impact of leverage on firm investment: Canadian
evidence. Journal of corporate finance, 11(1-2), 277-291.
[4]. Balestra, P., and Varadharajan-Krishnakumar, J. (1987). Full information estimations of a system of
simultaneous equations with error component structure. Econometric Theory, 3(2), 223-246.
Financial leverage and corporate investment: evidence from Cameroon
International Journal of Business Marketing and Management (IJBMM) Page 42
[5]. Butt, S., Khan, Z. A., and Nafees, B. (2013). Static Trade-off theory or Pecking order theory which one
suits best to the financial sector. Evidence from Pakistan. European Journal of Business and
Management, 5(23), 131-140.
[6]. Cheng, X., and Degryse, H. (2010). The impact of bank and non-bank financial institutions on local
economic growth in China. Journal of Financial Services Research, 37(2), 179-199.
[7]. Cleary, S., Povel, P., and Raith, M. (2007). The U-shaped investment curve: Theory and
evidence. Journal of financial and quantitative analysis, 42(1), 1-39.
[8]. Danso, A., Lartey, T., Fosu, S., Owusu-Agyei, S., and Uddin, M. (2019). Leverage and firm
investment: the role of information asymmetry and growth. International Journal of Accounting and
Information Management.
[9]. De Jong, A. (2002). The disciplining role of leverage in Dutch firms. Review of Finance, 6(1), 31-62.
[10]. De Jong, A., Kabir, R., and Nguyen, T. T. (2008). Capital structure around the world: The roles of
firm-and country-specific determinants. Journal of banking and Finance, 32(9), 1954-1969.
[11]. Denis, D. J., and Denis, D. K. (1993). Managerial discretion, organizational structure, and corporate
performance: A study of leveraged recapitalizations. Journal of Accounting and Economics, 16(1-3),
209-236.
[12]. Ellili, N., and Farouk, S. (2011). Examining the capital structure determinants: empirical analysis of
companies traded on Abu Dhabi Stock Exchange.
[13]. Fazzari, S. M., and Athey, M. J. (1987). Asymmetric information, financing constraints, and
investment. The Review of Economics and Statistics, 481-487.
[14]. Firth, M., Lin, C., and Wong, S. M. (2008). Leverage and investment under a state-owned bank lending
environment: Evidence from China. Journal of corporate finance, 14(5), 642-653.
[15]. García-Posada, M., Menéndez Pujadas, Á., and Mulino Rios, M. (2020). Determinants of investment in
tangible and intangible fixed assets. Banco de Espana Occasional Paper, (2004).
[16]. Gebauer, S., Setzer, R., and Westphal, A. (2018). Corporate debt and investment: A firm-level analysis
for stressed euro area countries. Journal of International Money and Finance, 86, 112-130.
[17]. Harc, M. (2015). The relationship between tangible assets and capital structure of small and medium-
sized companies in Croatia. Ekonomski Vjesnik/Econviews: Review of Contemporary Business,
Entrepreneurship and Economic Issues, 28(1), 213-224.
[18]. Harris, M., and Raviv, A. (1991). The theory of capital structure. The Journal of Finance, 46(1), 297-
355.
[19]. Hernando, I., and MartΓ­nez-Carrascal, C. (2008). The impact of financial variables on firms’ real
decisions: evidence from Spanish firm-level data. Journal of Macroeconomics, 30(1), 543-561.
[20]. Hillier, D., Jaffe, J., Jordan, B., Ross, S., and Westerfield, R. (2010).Corporate Finance, First European
Edition, McGraw-Hill Education
[21]. Ho, Y. K., Tjahjapranata, M., and Yap, C. M. (2006). Size, leverage, concentration, and R&D
investment in generating growth opportunities. The Journal of Business, 79(2), 851-876.
https://ins-cameroun.cm
[23]. Jensen, M. C. (1986). Agency costs of free cash flow, corporate finance, and
takeovers. The American economic review, 76(2), 323-329.
[24]. Jensen, Michael., Meckling, William C. (1976), Β«Theory of the firm: Managerial behaviour, Agency
costs, and ownership structure Β», Journal of Financial Economics, Vol. 3, p. 305-360.
[25]. KΓΆksal, B., Orman, C., and Oduncu, A. (2013). Determinants of capital structure: evidence from a
major emerging market economy. MPRA Paper, 48415.
[26]. Kraus, A., and Litzenberger, R. H. (1973). A state-preference model of optimal financial leverage. The
journal of finance, 28(4), 911-922.
[27]. Lang, L. H., and Stulz, R. M. (1994). Tobin's q, corporate diversification, and firm
performance. Journal of political economy, 102(6), 1248-1280.
[28]. Lang, L., Ofek, E., and Stulz, R. (1996). Leverage, investment, and firm growth. Journal of financial
Economics, 40(1), 3-29.
[29]. Lim, S. C., Macias, A. J., and Moeller, T. (2020). Intangible assets and capital structure. Journal of
Banking and Finance, 118, 105873.
[30]. Loumioti, M. (2012). The use of intangible assets as loan collateral. Available at SSRN 1748675.
[31]. Mauskar, N. (2018). Accounting for Leverage in Intangible and Tangible Investments across the
Business Cycle. Undergraduate Economic Review, 15(1), 1.)
[32]. Modigliani, F., and Miller, M. H. (1958). The cost of capital, corporation finance and the theory of
investment. The American economic review, 48(3), 261-297.
Financial leverage and corporate investment: evidence from Cameroon
International Journal of Business Marketing and Management (IJBMM) Page 43
[33]. Modigliani, F., and Miller, M. H. (1963). Corporate income taxes and the cost of capital: a
correction. The American economic review, 53(3), 433-443.
[34]. Mondosha, M., and Majoni, A. (2018). The impact of leverage on investment decisions for South
African firms with different growth opportunities. Journal of Economic and Financial Sciences, 11(1),
1-7.
[35]. Morellec, E., and SchΓΌrhoff, N. (2011). Corporate investment and financing under asymmetric
information. Journal of financial Economics, 99(2), 262-288.
[36]. Morellec, E. (2001). Asset liquidity, capital structure, and secured debt. Journal of financial
economics, 61(2), 173-206.
[37]. Moro Visconti, R. (2015). Leveraging value with intangibles: More guarantees with less
collateral? Corporate ownership and control, 13(1).
[38]. Myers, S. C. (1977). Determinants of corporate borrowing. Journal of financial economics, 5(2), 147-
175.
[39]. Myers, S. C., and Majluf, N. S. (1984). Corporate financing and investment decisions when firms have
information that investors do not have. Journal of financial economics, 13(2), 187-221.
[40]. Nakamura, L. I. (2001). Investing in intangibles: is a trillion dollars missing from the GDP? Business
Review, (Q4), 27-36.
[41]. Nyale, Y. (2010). The relationship between leverage and investment decisions for companies quoted at
the Nairobi Stock Exchange (Doctoral dissertation, University of Nairobi, Kenya).
[42]. Odit, M. P., and Chittoo, H. B. (2008). Does financial leverage influence investment decisions? The
case of Mauritian firms. Journal of Business Case Studies (JBCS), 4(9), 49-60.
[43]. Onomo, M. B., Ayou Bene, M., and Fall, F. (2019). Propriété étrangère, investissement et performance
des entreprises en Afrique: cas du Cameroun. Management international, 23, 159-171.
[44]. Rajan, R. G., and Zingales, L. (1995). What do we know about capital structure? Some evidence from
international data. The journal of Finance, 50(5), 1421-1460.
[45]. Ross, S. A. (1977). The determination of financial structure: the incentive-signalling approach. The bell
journal of economics, 23-40.
[46]. Ruland, W., and Zhou, P. (2005). Debt, diversification, and valuation. Review of Quantitative Finance
and Accounting, 25(3), 277-291.
[47]. Sajid, M., Mahmood, A., and Sabir, H. M. (2016). Does financial leverage influence investment
decisions? Empirical evidence from KSE-30 index of Pakistan. Asian Journal of Economic
Modelling, 4(2), 82-89.
[48]. Sall, M. B. (2002). La source de financement des investissements de la PME: Une Γ©tude empirique sur
donnΓ©es sΓ©nΓ©galaises. Africa Development/Afrique et DΓ©veloppement, 84-115.
[49]. Shleifer, A., and Vishny, R. W. (1992). Liquidation values and debt capacity: A market equilibrium
approach. The journal of finance, 47(4), 1343-1366.
[50]. Shleifer, A., and Vishny, R. W. (1997). A survey of corporate governance. The journal of
finance, 52(2), 737-783.
[51]. Shukla, A. K., and Shaw, T. S. (2021). Impact of Leverage on Firms’ Investment. Economic and
Political Weekly, 56(35), 45.
[52]. Stiglitz, J. E. (1969). A re-examination of the Modigliani-Miller theorem. The American Economic
Review, 59(5), 784-793.
[53]. Stiglitz, J. E., and Weiss, A. (1981). Credit rationing in markets with imperfect information. The
American economic review, 71(3), 393-410.
[54]. Stulz, R. (1990). Managerial discretion and optimal financing policies. Journal of financial
Economics, 26(1), 3-27.
[55]. Tioumagneng, A. (2012). BANQUES ET COMPORTEMENT D'ENDETTEMENT DES
ENTREPRISES. Recherches en Sciences de Gestion, (89).
[56]. Titman, S., and Wessels, R. (1988). The determinants of capital structure choice. The Journal of
finance, 43(1), 1-19.
[57]. Umutlu, M. (2010). Firm leverage and investment decisions in an emerging market. Quality and
Quantity, 44(5), 1005-1013.
[58]. Vengesai, E., and Kwenda, F. (2018). The impact of leverage on discretionary investment: African
evidence. African journal of economic and management studies.
[59]. Vo, X. V. (2019). Leverage and corporate investment–Evidence from Vietnam. Finance Research
Letters, 28, 1-5.
[60]. Yarba, I. (2021). Corporate Indebtedness and Investment: Micro Evidence of an Inverted U-Shape (No.
2131).

More Related Content

Similar to Financial Leverage and Corporate Investment: Evidence from Cameroon

Factors that affect financial distress
Factors that affect financial distressFactors that affect financial distress
Factors that affect financial distressYoyo Sudaryo
Β 
Effect of Capital Structure on Financial Sustainability of Deposit-Taking Mic...
Effect of Capital Structure on Financial Sustainability of Deposit-Taking Mic...Effect of Capital Structure on Financial Sustainability of Deposit-Taking Mic...
Effect of Capital Structure on Financial Sustainability of Deposit-Taking Mic...Business, Management and Economics Research
Β 
Corporate governance and firm performance
Corporate governance and firm performanceCorporate governance and firm performance
Corporate governance and firm performanceAlexander Decker
Β 
Factors determining capital structure a case study of listed
Factors determining capital structure a case study of listedFactors determining capital structure a case study of listed
Factors determining capital structure a case study of listedAlexander Decker
Β 
A Comparative Analysis of Capital Structure between Banking and Non-Banking F...
A Comparative Analysis of Capital Structure between Banking and Non-Banking F...A Comparative Analysis of Capital Structure between Banking and Non-Banking F...
A Comparative Analysis of Capital Structure between Banking and Non-Banking F...iosrjce
Β 
Impact of cash flow on investment levels in quoted nigerian manufacturing firms.
Impact of cash flow on investment levels in quoted nigerian manufacturing firms.Impact of cash flow on investment levels in quoted nigerian manufacturing firms.
Impact of cash flow on investment levels in quoted nigerian manufacturing firms.Alexander Decker
Β 
RELATIONSHIP BETWEEN FIRM SIZE AND PROFITABILITY.pdf
RELATIONSHIP BETWEEN FIRM SIZE AND PROFITABILITY.pdfRELATIONSHIP BETWEEN FIRM SIZE AND PROFITABILITY.pdf
RELATIONSHIP BETWEEN FIRM SIZE AND PROFITABILITY.pdfNgcHnTrnTh
Β 
Study of the Static Trade-Off Theory determinants vis-Γ -vis Capital Structure...
Study of the Static Trade-Off Theory determinants vis-Γ -vis Capital Structure...Study of the Static Trade-Off Theory determinants vis-Γ -vis Capital Structure...
Study of the Static Trade-Off Theory determinants vis-Γ -vis Capital Structure...inventionjournals
Β 
Capital structure and eps a study on selected financial institutions listed o...
Capital structure and eps a study on selected financial institutions listed o...Capital structure and eps a study on selected financial institutions listed o...
Capital structure and eps a study on selected financial institutions listed o...Alexander Decker
Β 
Sayidah &amp; assagaf asessing
Sayidah &amp; assagaf asessingSayidah &amp; assagaf asessing
Sayidah &amp; assagaf asessingNur Sayidah
Β 
Analyzing the impact of firm’s specific factors and macroeconomic factors on ...
Analyzing the impact of firm’s specific factors and macroeconomic factors on ...Analyzing the impact of firm’s specific factors and macroeconomic factors on ...
Analyzing the impact of firm’s specific factors and macroeconomic factors on ...Alexander Decker
Β 
The Effect of Capital Structure on Profitability of Energy American Firms:
	The Effect of Capital Structure on Profitability of Energy American Firms:	The Effect of Capital Structure on Profitability of Energy American Firms:
The Effect of Capital Structure on Profitability of Energy American Firms:inventionjournals
Β 
Contoh Penelitian Tentang Pengaruh Profitabilitas Terhadap Nilai Perusahaan
Contoh Penelitian Tentang Pengaruh Profitabilitas Terhadap Nilai PerusahaanContoh Penelitian Tentang Pengaruh Profitabilitas Terhadap Nilai Perusahaan
Contoh Penelitian Tentang Pengaruh Profitabilitas Terhadap Nilai PerusahaanTrisnadi Wijaya
Β 
kilu assy.docx
kilu assy.docxkilu assy.docx
kilu assy.docxAshantilidu
Β 
Post privatization Corporate Governance and the challenges of working capital...
Post privatization Corporate Governance and the challenges of working capital...Post privatization Corporate Governance and the challenges of working capital...
Post privatization Corporate Governance and the challenges of working capital...inventionjournals
Β 

Similar to Financial Leverage and Corporate Investment: Evidence from Cameroon (20)

Factors that affect financial distress
Factors that affect financial distressFactors that affect financial distress
Factors that affect financial distress
Β 
Effect of Capital Structure on Financial Sustainability of Deposit-Taking Mic...
Effect of Capital Structure on Financial Sustainability of Deposit-Taking Mic...Effect of Capital Structure on Financial Sustainability of Deposit-Taking Mic...
Effect of Capital Structure on Financial Sustainability of Deposit-Taking Mic...
Β 
Corporate governance and firm performance
Corporate governance and firm performanceCorporate governance and firm performance
Corporate governance and firm performance
Β 
Liton
LitonLiton
Liton
Β 
Factors determining capital structure a case study of listed
Factors determining capital structure a case study of listedFactors determining capital structure a case study of listed
Factors determining capital structure a case study of listed
Β 
A Comparative Analysis of Capital Structure between Banking and Non-Banking F...
A Comparative Analysis of Capital Structure between Banking and Non-Banking F...A Comparative Analysis of Capital Structure between Banking and Non-Banking F...
A Comparative Analysis of Capital Structure between Banking and Non-Banking F...
Β 
Impact of cash flow on investment levels in quoted nigerian manufacturing firms.
Impact of cash flow on investment levels in quoted nigerian manufacturing firms.Impact of cash flow on investment levels in quoted nigerian manufacturing firms.
Impact of cash flow on investment levels in quoted nigerian manufacturing firms.
Β 
An Empirical Analysis of the Determinants of Corporate Debt Policy of Nigeria...
An Empirical Analysis of the Determinants of Corporate Debt Policy of Nigeria...An Empirical Analysis of the Determinants of Corporate Debt Policy of Nigeria...
An Empirical Analysis of the Determinants of Corporate Debt Policy of Nigeria...
Β 
RELATIONSHIP BETWEEN FIRM SIZE AND PROFITABILITY.pdf
RELATIONSHIP BETWEEN FIRM SIZE AND PROFITABILITY.pdfRELATIONSHIP BETWEEN FIRM SIZE AND PROFITABILITY.pdf
RELATIONSHIP BETWEEN FIRM SIZE AND PROFITABILITY.pdf
Β 
Study of the Static Trade-Off Theory determinants vis-Γ -vis Capital Structure...
Study of the Static Trade-Off Theory determinants vis-Γ -vis Capital Structure...Study of the Static Trade-Off Theory determinants vis-Γ -vis Capital Structure...
Study of the Static Trade-Off Theory determinants vis-Γ -vis Capital Structure...
Β 
Capital structure and eps a study on selected financial institutions listed o...
Capital structure and eps a study on selected financial institutions listed o...Capital structure and eps a study on selected financial institutions listed o...
Capital structure and eps a study on selected financial institutions listed o...
Β 
Sayidah &amp; assagaf asessing
Sayidah &amp; assagaf asessingSayidah &amp; assagaf asessing
Sayidah &amp; assagaf asessing
Β 
Analyzing the impact of firm’s specific factors and macroeconomic factors on ...
Analyzing the impact of firm’s specific factors and macroeconomic factors on ...Analyzing the impact of firm’s specific factors and macroeconomic factors on ...
Analyzing the impact of firm’s specific factors and macroeconomic factors on ...
Β 
The Effect of Capital Structure on Profitability of Energy American Firms:
	The Effect of Capital Structure on Profitability of Energy American Firms:	The Effect of Capital Structure on Profitability of Energy American Firms:
The Effect of Capital Structure on Profitability of Energy American Firms:
Β 
Contoh Penelitian Tentang Pengaruh Profitabilitas Terhadap Nilai Perusahaan
Contoh Penelitian Tentang Pengaruh Profitabilitas Terhadap Nilai PerusahaanContoh Penelitian Tentang Pengaruh Profitabilitas Terhadap Nilai Perusahaan
Contoh Penelitian Tentang Pengaruh Profitabilitas Terhadap Nilai Perusahaan
Β 
10320140503003
1032014050300310320140503003
10320140503003
Β 
10320140503003
1032014050300310320140503003
10320140503003
Β 
kilu assy.docx
kilu assy.docxkilu assy.docx
kilu assy.docx
Β 
Post privatization Corporate Governance and the challenges of working capital...
Post privatization Corporate Governance and the challenges of working capital...Post privatization Corporate Governance and the challenges of working capital...
Post privatization Corporate Governance and the challenges of working capital...
Β 
Analysis of the Influence of Company Size On the Timeliness of Financial Repo...
Analysis of the Influence of Company Size On the Timeliness of Financial Repo...Analysis of the Influence of Company Size On the Timeliness of Financial Repo...
Analysis of the Influence of Company Size On the Timeliness of Financial Repo...
Β 

More from International Journal of Business Marketing and Management (IJBMM)

More from International Journal of Business Marketing and Management (IJBMM) (20)

Financial literacy of students at Thainguyen University of Technology - A lit...
Financial literacy of students at Thainguyen University of Technology - A lit...Financial literacy of students at Thainguyen University of Technology - A lit...
Financial literacy of students at Thainguyen University of Technology - A lit...
Β 
Study on the Nexuses between Supply Chain Information Technology Capabilities...
Study on the Nexuses between Supply Chain Information Technology Capabilities...Study on the Nexuses between Supply Chain Information Technology Capabilities...
Study on the Nexuses between Supply Chain Information Technology Capabilities...
Β 
Qualities required in founding team members for Startups in India
Qualities required in founding team members for Startups in IndiaQualities required in founding team members for Startups in India
Qualities required in founding team members for Startups in India
Β 
The Effect of "Buy Now, Pay Later" Mode on Impulsive Buying Behavior
The Effect of "Buy Now, Pay Later" Mode on Impulsive Buying BehaviorThe Effect of "Buy Now, Pay Later" Mode on Impulsive Buying Behavior
The Effect of "Buy Now, Pay Later" Mode on Impulsive Buying Behavior
Β 
Factors affecting Business Environment of Hai Phong City
Factors affecting Business Environment of Hai Phong CityFactors affecting Business Environment of Hai Phong City
Factors affecting Business Environment of Hai Phong City
Β 
Work Attitude, Innovation Ability and Innovation Performance of Employees in ...
Work Attitude, Innovation Ability and Innovation Performance of Employees in ...Work Attitude, Innovation Ability and Innovation Performance of Employees in ...
Work Attitude, Innovation Ability and Innovation Performance of Employees in ...
Β 
Evaluating Resilience in Commercial Airlines through Supply Chain Flexibility
Evaluating Resilience in Commercial Airlines through Supply Chain FlexibilityEvaluating Resilience in Commercial Airlines through Supply Chain Flexibility
Evaluating Resilience in Commercial Airlines through Supply Chain Flexibility
Β 
Characteristics and simulation analysis of nonlinear correlation coefficient ...
Characteristics and simulation analysis of nonlinear correlation coefficient ...Characteristics and simulation analysis of nonlinear correlation coefficient ...
Characteristics and simulation analysis of nonlinear correlation coefficient ...
Β 
The Influence Of Product Quality And Price On The Purchase Decision Of Kobba ...
The Influence Of Product Quality And Price On The Purchase Decision Of Kobba ...The Influence Of Product Quality And Price On The Purchase Decision Of Kobba ...
The Influence Of Product Quality And Price On The Purchase Decision Of Kobba ...
Β 
Mean-Distortion Risk Measure Portfolio Optimization under the Distribution Un...
Mean-Distortion Risk Measure Portfolio Optimization under the Distribution Un...Mean-Distortion Risk Measure Portfolio Optimization under the Distribution Un...
Mean-Distortion Risk Measure Portfolio Optimization under the Distribution Un...
Β 
A Conceptual Relationship between Microfinance and Poverty Reduction in Nigeria
A Conceptual Relationship between Microfinance and Poverty Reduction in NigeriaA Conceptual Relationship between Microfinance and Poverty Reduction in Nigeria
A Conceptual Relationship between Microfinance and Poverty Reduction in Nigeria
Β 
The Contribution of Entrepreneurship Ecosystem in Inculcating Entrepreneurial...
The Contribution of Entrepreneurship Ecosystem in Inculcating Entrepreneurial...The Contribution of Entrepreneurship Ecosystem in Inculcating Entrepreneurial...
The Contribution of Entrepreneurship Ecosystem in Inculcating Entrepreneurial...
Β 
Robust Optimal Reinsurance and Investment Problem with p-Thinning Dependent a...
Robust Optimal Reinsurance and Investment Problem with p-Thinning Dependent a...Robust Optimal Reinsurance and Investment Problem with p-Thinning Dependent a...
Robust Optimal Reinsurance and Investment Problem with p-Thinning Dependent a...
Β 
Antecedent of Sustainable Consumption Behavior: Purchase, Using and Disposing
Antecedent of Sustainable Consumption Behavior: Purchase, Using and DisposingAntecedent of Sustainable Consumption Behavior: Purchase, Using and Disposing
Antecedent of Sustainable Consumption Behavior: Purchase, Using and Disposing
Β 
Research on Credit Default Swaps Pricing Under Uncertainty in the Distributio...
Research on Credit Default Swaps Pricing Under Uncertainty in the Distributio...Research on Credit Default Swaps Pricing Under Uncertainty in the Distributio...
Research on Credit Default Swaps Pricing Under Uncertainty in the Distributio...
Β 
University Students Learning Styles During Covid-19
University Students Learning Styles During Covid-19University Students Learning Styles During Covid-19
University Students Learning Styles During Covid-19
Β 
Extending the Laundered Funds Destination Theory: Applying the Walker-Unger G...
Extending the Laundered Funds Destination Theory: Applying the Walker-Unger G...Extending the Laundered Funds Destination Theory: Applying the Walker-Unger G...
Extending the Laundered Funds Destination Theory: Applying the Walker-Unger G...
Β 
The current situation of developing human resource in industrial parks of Hai...
The current situation of developing human resource in industrial parks of Hai...The current situation of developing human resource in industrial parks of Hai...
The current situation of developing human resource in industrial parks of Hai...
Β 
Hybrid of Data Envelopment Analysis and Malmquist Productivity Index to evalu...
Hybrid of Data Envelopment Analysis and Malmquist Productivity Index to evalu...Hybrid of Data Envelopment Analysis and Malmquist Productivity Index to evalu...
Hybrid of Data Envelopment Analysis and Malmquist Productivity Index to evalu...
Β 
Social Media Usage Behavior of the Elderly: Case Study in Surat Thani Provinc...
Social Media Usage Behavior of the Elderly: Case Study in Surat Thani Provinc...Social Media Usage Behavior of the Elderly: Case Study in Surat Thani Provinc...
Social Media Usage Behavior of the Elderly: Case Study in Surat Thani Provinc...
Β 

Recently uploaded

/:Call Girls In Indirapuram Ghaziabad βž₯9990211544 Independent Best Escorts In...
/:Call Girls In Indirapuram Ghaziabad βž₯9990211544 Independent Best Escorts In.../:Call Girls In Indirapuram Ghaziabad βž₯9990211544 Independent Best Escorts In...
/:Call Girls In Indirapuram Ghaziabad βž₯9990211544 Independent Best Escorts In...lizamodels9
Β 
Banana Powder Manufacturing Plant Project Report 2024 Edition.pptx
Banana Powder Manufacturing Plant Project Report 2024 Edition.pptxBanana Powder Manufacturing Plant Project Report 2024 Edition.pptx
Banana Powder Manufacturing Plant Project Report 2024 Edition.pptxgeorgebrinton95
Β 
Call Girls In Sikandarpur Gurgaon ❀️8860477959_Russian 100% Genuine Escorts I...
Call Girls In Sikandarpur Gurgaon ❀️8860477959_Russian 100% Genuine Escorts I...Call Girls In Sikandarpur Gurgaon ❀️8860477959_Russian 100% Genuine Escorts I...
Call Girls In Sikandarpur Gurgaon ❀️8860477959_Russian 100% Genuine Escorts I...lizamodels9
Β 
Tech Startup Growth Hacking 101 - Basics on Growth Marketing
Tech Startup Growth Hacking 101  - Basics on Growth MarketingTech Startup Growth Hacking 101  - Basics on Growth Marketing
Tech Startup Growth Hacking 101 - Basics on Growth MarketingShawn Pang
Β 
Investment analysis and portfolio management
Investment analysis and portfolio managementInvestment analysis and portfolio management
Investment analysis and portfolio managementJunaidKhan750825
Β 
Call Girls In Kishangarh Delhi ❀️8860477959 Good Looking Escorts In 24/7 Delh...
Call Girls In Kishangarh Delhi ❀️8860477959 Good Looking Escorts In 24/7 Delh...Call Girls In Kishangarh Delhi ❀️8860477959 Good Looking Escorts In 24/7 Delh...
Call Girls In Kishangarh Delhi ❀️8860477959 Good Looking Escorts In 24/7 Delh...lizamodels9
Β 
Pitch Deck Teardown: NOQX's $200k Pre-seed deck
Pitch Deck Teardown: NOQX's $200k Pre-seed deckPitch Deck Teardown: NOQX's $200k Pre-seed deck
Pitch Deck Teardown: NOQX's $200k Pre-seed deckHajeJanKamps
Β 
BEST Call Girls In Greater Noida ✨ 9773824855 ✨ Escorts Service In Delhi Ncr,
BEST Call Girls In Greater Noida ✨ 9773824855 ✨ Escorts Service In Delhi Ncr,BEST Call Girls In Greater Noida ✨ 9773824855 ✨ Escorts Service In Delhi Ncr,
BEST Call Girls In Greater Noida ✨ 9773824855 ✨ Escorts Service In Delhi Ncr,noida100girls
Β 
Vip Dewas Call Girls #9907093804 Contact Number Escorts Service Dewas
Vip Dewas Call Girls #9907093804 Contact Number Escorts Service DewasVip Dewas Call Girls #9907093804 Contact Number Escorts Service Dewas
Vip Dewas Call Girls #9907093804 Contact Number Escorts Service Dewasmakika9823
Β 
NewBase 22 April 2024 Energy News issue - 1718 by Khaled Al Awadi (AutoRe...
NewBase  22 April  2024  Energy News issue - 1718 by Khaled Al Awadi  (AutoRe...NewBase  22 April  2024  Energy News issue - 1718 by Khaled Al Awadi  (AutoRe...
NewBase 22 April 2024 Energy News issue - 1718 by Khaled Al Awadi (AutoRe...Khaled Al Awadi
Β 
(8264348440) πŸ” Call Girls In Keshav Puram πŸ” Delhi NCR
(8264348440) πŸ” Call Girls In Keshav Puram πŸ” Delhi NCR(8264348440) πŸ” Call Girls In Keshav Puram πŸ” Delhi NCR
(8264348440) πŸ” Call Girls In Keshav Puram πŸ” Delhi NCRsoniya singh
Β 
Call Girls in Mehrauli Delhi πŸ’―Call Us πŸ”8264348440πŸ”
Call Girls in Mehrauli Delhi πŸ’―Call Us πŸ”8264348440πŸ”Call Girls in Mehrauli Delhi πŸ’―Call Us πŸ”8264348440πŸ”
Call Girls in Mehrauli Delhi πŸ’―Call Us πŸ”8264348440πŸ”soniya singh
Β 
Cash Payment 9602870969 Escort Service in Udaipur Call Girls
Cash Payment 9602870969 Escort Service in Udaipur Call GirlsCash Payment 9602870969 Escort Service in Udaipur Call Girls
Cash Payment 9602870969 Escort Service in Udaipur Call GirlsApsara Of India
Β 
CATALOG cΓ‘p Δ‘iện Goldcup (bαΊ£ng giΓ‘) 1.4.2024.PDF
CATALOG cΓ‘p Δ‘iện Goldcup (bαΊ£ng giΓ‘) 1.4.2024.PDFCATALOG cΓ‘p Δ‘iện Goldcup (bαΊ£ng giΓ‘) 1.4.2024.PDF
CATALOG cΓ‘p Δ‘iện Goldcup (bαΊ£ng giΓ‘) 1.4.2024.PDFOrient Homes
Β 
A.I. Bot Summit 3 Opening Keynote - Perry Belcher
A.I. Bot Summit 3 Opening Keynote - Perry BelcherA.I. Bot Summit 3 Opening Keynote - Perry Belcher
A.I. Bot Summit 3 Opening Keynote - Perry BelcherPerry Belcher
Β 
Catalogue ONG NUOC PPR DE NHAT .pdf
Catalogue ONG NUOC PPR DE NHAT      .pdfCatalogue ONG NUOC PPR DE NHAT      .pdf
Catalogue ONG NUOC PPR DE NHAT .pdfOrient Homes
Β 
Lean: From Theory to Practice β€” One City’s (and Library’s) Lean Story… Abridged
Lean: From Theory to Practice β€” One City’s (and Library’s) Lean Story… AbridgedLean: From Theory to Practice β€” One City’s (and Library’s) Lean Story… Abridged
Lean: From Theory to Practice β€” One City’s (and Library’s) Lean Story… AbridgedKaiNexus
Β 
(8264348440) πŸ” Call Girls In Hauz Khas πŸ” Delhi NCR
(8264348440) πŸ” Call Girls In Hauz Khas πŸ” Delhi NCR(8264348440) πŸ” Call Girls In Hauz Khas πŸ” Delhi NCR
(8264348440) πŸ” Call Girls In Hauz Khas πŸ” Delhi NCRsoniya singh
Β 
Keppel Ltd. 1Q 2024 Business Update Presentation Slides
Keppel Ltd. 1Q 2024 Business Update  Presentation SlidesKeppel Ltd. 1Q 2024 Business Update  Presentation Slides
Keppel Ltd. 1Q 2024 Business Update Presentation SlidesKeppelCorporation
Β 

Recently uploaded (20)

/:Call Girls In Indirapuram Ghaziabad βž₯9990211544 Independent Best Escorts In...
/:Call Girls In Indirapuram Ghaziabad βž₯9990211544 Independent Best Escorts In.../:Call Girls In Indirapuram Ghaziabad βž₯9990211544 Independent Best Escorts In...
/:Call Girls In Indirapuram Ghaziabad βž₯9990211544 Independent Best Escorts In...
Β 
Banana Powder Manufacturing Plant Project Report 2024 Edition.pptx
Banana Powder Manufacturing Plant Project Report 2024 Edition.pptxBanana Powder Manufacturing Plant Project Report 2024 Edition.pptx
Banana Powder Manufacturing Plant Project Report 2024 Edition.pptx
Β 
Call Girls In Sikandarpur Gurgaon ❀️8860477959_Russian 100% Genuine Escorts I...
Call Girls In Sikandarpur Gurgaon ❀️8860477959_Russian 100% Genuine Escorts I...Call Girls In Sikandarpur Gurgaon ❀️8860477959_Russian 100% Genuine Escorts I...
Call Girls In Sikandarpur Gurgaon ❀️8860477959_Russian 100% Genuine Escorts I...
Β 
Tech Startup Growth Hacking 101 - Basics on Growth Marketing
Tech Startup Growth Hacking 101  - Basics on Growth MarketingTech Startup Growth Hacking 101  - Basics on Growth Marketing
Tech Startup Growth Hacking 101 - Basics on Growth Marketing
Β 
Investment analysis and portfolio management
Investment analysis and portfolio managementInvestment analysis and portfolio management
Investment analysis and portfolio management
Β 
Call Girls In Kishangarh Delhi ❀️8860477959 Good Looking Escorts In 24/7 Delh...
Call Girls In Kishangarh Delhi ❀️8860477959 Good Looking Escorts In 24/7 Delh...Call Girls In Kishangarh Delhi ❀️8860477959 Good Looking Escorts In 24/7 Delh...
Call Girls In Kishangarh Delhi ❀️8860477959 Good Looking Escorts In 24/7 Delh...
Β 
Pitch Deck Teardown: NOQX's $200k Pre-seed deck
Pitch Deck Teardown: NOQX's $200k Pre-seed deckPitch Deck Teardown: NOQX's $200k Pre-seed deck
Pitch Deck Teardown: NOQX's $200k Pre-seed deck
Β 
BEST Call Girls In Greater Noida ✨ 9773824855 ✨ Escorts Service In Delhi Ncr,
BEST Call Girls In Greater Noida ✨ 9773824855 ✨ Escorts Service In Delhi Ncr,BEST Call Girls In Greater Noida ✨ 9773824855 ✨ Escorts Service In Delhi Ncr,
BEST Call Girls In Greater Noida ✨ 9773824855 ✨ Escorts Service In Delhi Ncr,
Β 
Vip Dewas Call Girls #9907093804 Contact Number Escorts Service Dewas
Vip Dewas Call Girls #9907093804 Contact Number Escorts Service DewasVip Dewas Call Girls #9907093804 Contact Number Escorts Service Dewas
Vip Dewas Call Girls #9907093804 Contact Number Escorts Service Dewas
Β 
NewBase 22 April 2024 Energy News issue - 1718 by Khaled Al Awadi (AutoRe...
NewBase  22 April  2024  Energy News issue - 1718 by Khaled Al Awadi  (AutoRe...NewBase  22 April  2024  Energy News issue - 1718 by Khaled Al Awadi  (AutoRe...
NewBase 22 April 2024 Energy News issue - 1718 by Khaled Al Awadi (AutoRe...
Β 
(8264348440) πŸ” Call Girls In Keshav Puram πŸ” Delhi NCR
(8264348440) πŸ” Call Girls In Keshav Puram πŸ” Delhi NCR(8264348440) πŸ” Call Girls In Keshav Puram πŸ” Delhi NCR
(8264348440) πŸ” Call Girls In Keshav Puram πŸ” Delhi NCR
Β 
Call Girls in Mehrauli Delhi πŸ’―Call Us πŸ”8264348440πŸ”
Call Girls in Mehrauli Delhi πŸ’―Call Us πŸ”8264348440πŸ”Call Girls in Mehrauli Delhi πŸ’―Call Us πŸ”8264348440πŸ”
Call Girls in Mehrauli Delhi πŸ’―Call Us πŸ”8264348440πŸ”
Β 
KestrelPro Flyer Japan IT Week 2024 (English)
KestrelPro Flyer Japan IT Week 2024 (English)KestrelPro Flyer Japan IT Week 2024 (English)
KestrelPro Flyer Japan IT Week 2024 (English)
Β 
Cash Payment 9602870969 Escort Service in Udaipur Call Girls
Cash Payment 9602870969 Escort Service in Udaipur Call GirlsCash Payment 9602870969 Escort Service in Udaipur Call Girls
Cash Payment 9602870969 Escort Service in Udaipur Call Girls
Β 
CATALOG cΓ‘p Δ‘iện Goldcup (bαΊ£ng giΓ‘) 1.4.2024.PDF
CATALOG cΓ‘p Δ‘iện Goldcup (bαΊ£ng giΓ‘) 1.4.2024.PDFCATALOG cΓ‘p Δ‘iện Goldcup (bαΊ£ng giΓ‘) 1.4.2024.PDF
CATALOG cΓ‘p Δ‘iện Goldcup (bαΊ£ng giΓ‘) 1.4.2024.PDF
Β 
A.I. Bot Summit 3 Opening Keynote - Perry Belcher
A.I. Bot Summit 3 Opening Keynote - Perry BelcherA.I. Bot Summit 3 Opening Keynote - Perry Belcher
A.I. Bot Summit 3 Opening Keynote - Perry Belcher
Β 
Catalogue ONG NUOC PPR DE NHAT .pdf
Catalogue ONG NUOC PPR DE NHAT      .pdfCatalogue ONG NUOC PPR DE NHAT      .pdf
Catalogue ONG NUOC PPR DE NHAT .pdf
Β 
Lean: From Theory to Practice β€” One City’s (and Library’s) Lean Story… Abridged
Lean: From Theory to Practice β€” One City’s (and Library’s) Lean Story… AbridgedLean: From Theory to Practice β€” One City’s (and Library’s) Lean Story… Abridged
Lean: From Theory to Practice β€” One City’s (and Library’s) Lean Story… Abridged
Β 
(8264348440) πŸ” Call Girls In Hauz Khas πŸ” Delhi NCR
(8264348440) πŸ” Call Girls In Hauz Khas πŸ” Delhi NCR(8264348440) πŸ” Call Girls In Hauz Khas πŸ” Delhi NCR
(8264348440) πŸ” Call Girls In Hauz Khas πŸ” Delhi NCR
Β 
Keppel Ltd. 1Q 2024 Business Update Presentation Slides
Keppel Ltd. 1Q 2024 Business Update  Presentation SlidesKeppel Ltd. 1Q 2024 Business Update  Presentation Slides
Keppel Ltd. 1Q 2024 Business Update Presentation Slides
Β 

Financial Leverage and Corporate Investment: Evidence from Cameroon

  • 1. International Journal of Business Marketing and Management (IJBMM) Volume 7 Issue 4 July-Aug 2022, P.P. 32-43 ISSN: 2456-4559 www.ijbmm.com International Journal of Business Marketing and Management (IJBMM) Page 32 Financial Leverage and Corporate Investment: Evidence from Cameroon Marius Ayou Bene, Henri Daniel BELINGA MESSI University of Douala - ENSET Abstract: This paper analyzes the relationship between financial leverage and investment in the Cameroonian context. To this end, using a sample of 1362 firms observed over the period 2015-2017, a fixed-effect panel data instrumental variable regression model is estimated using the G2SLS method. The results show that leverage positively influences investment. However, in the sample as a whole, and in the individual SMEs, this relationship is not linear. It takes the form of an inverted "U". Specifically, at a low level of debt, the relationship between financial leverage and corporate investment is positive. It becomes negative at higher levels of leverage. Moreover, in turn, financial leverage is positively and significantly determined by investment. Keywords: leverage, investment. I. Introduction Investment decisions are considered one of the main research objects in finance, as they determine the competitiveness and performance of firms (Sajid et al., 2016; Aivazian et al., 2005; Ahmad et al., 2021). The link between financial leverage and firm investment is one of the most invested fields of research in this literature (Modigliani and Miller, 1958; Firth, 2008). Some studies have generally attempted to analyze the impact of financial leverage on investment (Aivazian et al, 2005; Danso et al, 2019). Others explore the link between financial leverage and the nature of investment by distinguishing between investment in research and development, and investment in tangible assets (Visconti, 2015; Moeller et al, 2016; Neil, 2018). A few stylized facts nevertheless mark this literature on the relationship between these two concepts. Financial leverage is the extent to which a firm uses debt (Hillier et al, 2010). It is often viewed as a source of additional financing that allows the firm to acquire certain assets. It also makes it possible, in a situation of asymmetric information, to discipline managers who tend to invest unnecessarily (De Jong, 2002). Moreover, financial leverage is more suitable for financing tangible investments than for investments in R&D, as the former offers more guarantees to lenders (Tjahjapranata, 2006; Neil, 2018). A significant amount of work has been conducted on the relationship between leverage and firm investment (Lang et al., 1996; Aivazian et al., 2005; Ahn et al., 2006; Visconti, 2015; Danso et al., 2019). However, this literature has very little to do with the African context, but makes greater use of data from developed countries such as the United States, or even Canada. In these countries, debt financing of investments is provided by banks and bond markets. In both cases, lenders monitor and discipline the firms receiving such financing (Firth, 2008). However, the results of these studies are not necessarily generalizable to developing economies where the relationship between lenders and borrowers is driven by more acute informational asymmetries. The value of such an analysis is, however, evident in many African countries where firms face difficulties in accessing credit. To our knowledge, no study has yet analyzed this relationship in the Cameroonian context. Yet, a few stylized facts1 show that business investment expenditures in this context amounted to 680,432 billion Fcfa in 2017. They thus record an increase of 3.66% compared to 2016. This upward trend results from the acquisition of tangible assets and the amount allocated to research and development (R&D). At the same time, the financial leverage in these companies has experienced an increase 3.87% from 14,655 billion in 2016 to about 15,223 billion in 2017. These figures denote a simultaneous growth in the leverage of companies, as well as in the investments made by them. This suggests a possible relationship between these two important aspects of business life, the exploration of which would contribute to enlightening 1 Facts from the National Institute of Statistics (NIS) 2016 and 2017 Economic and Fiscal Reviews.
  • 2. Financial leverage and corporate investment: evidence from Cameroon International Journal of Business Marketing and Management (IJBMM) Page 33 managers and other stakeholders on the definition of policies to be adopted for the competitiveness of these major players in the Cameroonian economy. The objective of this paper is therefore to empirically verify the existence of a relationship between leverage and firm investment in Cameroon. We use a sample of 1362 Cameroonian firms over the period 2015 to 2017. Using the two-stage generalized least squares (G2SLS) method, which takes into account a possible endogeneity relationship between the two variables capturing investment and leverage respectively, we estimate an instrumental variables regression model in panel data to determine the influence of leverage on firm investment, and vice versa. In what follows, we first discuss the link between leverage and firm investment through a review of the existing literature. We then present the methodology adopted and the data used. Finally, we present and discuss the results of the research. I. Financial leverage and investment: a review of the literature The relationship between leverage and investment has been discussed in the literature from multiple theoretical perspectives. The agency theory (Jensen and Meckling, 1976), the theory of information asymmetries (Myers and Majluf, 1984) and the theory of trade-offs (Kraus and Litzenberger, 1973) are the most widely used. Based on these theories and on empirical work, we attempt to highlight this relationship in firms in Cameroon. The link between leverage and investment has been studied from the perspective of agency theory. Agency theory refers to the relational problems that exist when there is a defined relationship between the principal and the agent. Agency problems arise when conflicts of interest arise between the different partners involved in the operation of the firm, highlighting the fragility of their relationship (Jensen and Meckling, 1976). These conflicts can lead to two different behaviors: underinvestment and overinvestment. The conflict can be between shareholders and creditors. In this context, Myers (1977) analyzes the possible externalities generated by debt on the optimal investment strategy defined by managers, and shows that debt leads to situations of underinvestment. Indeed, when a firm has excessive debt, managers tend to reduce investment even in profitable projects, since a portion of the profits remunerate creditors instead of going entirely to shareholders. Firms with high growth opportunities are most affected by the risk of underinvestment (Rajan and Zingales, 1995; Titman and Wessels, 1988). Furthermore, the literature identifies a possible problem of overinvestment (Jensen, 1986; Stulz, 1990) in the case of conflict between the manager and the shareholders. The policy of overinvestment is to reinvest excess cash in investment projects with low or even negative net present value. Executives who do this expand the size of the firm beyond its optimal level in order to have greater resources and to increase their career opportunities. Thus, managers can invest in specific assets that are a form of shield that allows them to become entrenched in order to make their replacement difficult or impossible (Shleifer and Vishny 1997). Management's ability to pursue such a policy is constrained by the availability of excess cash flow, and this constraint can be further reinforced by debt. When a firm takes on debt, it commits itself to servicing the debt. This forces management to honor these commitments with funds that could have been allocated to poor investment projects. Thus, leverage is a mechanism for overcoming the problem of overinvestment (De Jong; 2002), suggesting a negative relationship between debt and investment for firms with poor growth opportunities. Several empirical studies have examined the relationship between firm leverage and investment. Lang, Ofek, and Stulz (1996) and Aivazian, Ge, and Qiu (2005) use data from U.S. industrial firms and data from Canadian firms, respectively. Their results show that leverage is significantly and negatively related to investment. Using Turkish firm data, Umulte (2010) studies the relationship between leverage and investment decisions in emerging countries. The results reveal that leverage has a negative and significant effect on investment only for firms with low growth opportunities. Using the Vietnamese case, Vo (2019) finds a significant and negative relationship between leverage and investment. Denis and Denis (1993) find that, an increasing use of financial leverage leads to a decrease in capital expenditure. Other authors (Ahn and Denis, 2006; Lang and Stulz, 1994; Ruland and Zhou; 2005) analyze the impact of financial leverage on investment in diversified firms. The results show that the use of financial leverage negatively influences investment in these entities. This link is more significant for firms operating in high value-added business segments. Firth and Wong (2008) examine the relationship between leverage and investment in the Chinese context of state-owned banks. Their results show that there is a negative relationship between leverage and investment. This negative relationship is weaker in firms with low growth opportunities and poor operating performance compared to firms with high growth opportunities and good operating performance. The negative relationship between leverage and investment is weaker in firms with high levels of public ownership.
  • 3. Financial leverage and corporate investment: evidence from Cameroon International Journal of Business Marketing and Management (IJBMM) Page 34 The relationship between financial leverage and investment is also highlighted through the prism of the theory of information asymmetries (Stiglitz and Weiss, 1981; Myers and Majluf, 1984). Information asymmetries refer to the informational disparity between firms resorting to debt, and creditors willing to, or having, granted such financing. In an environment of asymmetric information, firms' investment decisions are affected by the behavior of capital providers (Morellec and SchΓΌrhoff, 2011; Danso et al., 2019). The latter may indeed demand a higher risk premium, or conversely ration credit. When access to credit becomes difficult and costly, firms abandon projects, leading to underinvestment (Myers and Majluf, 1984). Fazzari and Athey, (1987) examine the impact of information asymmetry on the link between cash flow and investment in U.S. firms and observe that investment becomes more dependent on internal funds under information asymmetry. Baxamusa, Mohanty, and Rao (2015) show that U.S. firms tend to use internal resources to finance projects with high information asymmetry, research and development investments in particular. They also show that debt is used more for investments characterized by less asymmetric information, such as marketable securities. Ahmad et al (2021), using data from Pakistan, show that the presence of asymmetric information increases the negative effect of financial leverage on firm investment. Furthermore, some studies have analyzed the relationship between financial leverage and investment in R&D and tangible assets. Neil (2018) shows that financial leverage allows US firms to acquire tangible and intangible assets. Indeed financial leverage helps firms to increase their production capacity and improve their productivity. GarcΓ­a-Posada et al (2020) analyze the determinants of investment in tangible assets and R&D of Spanish firms. They find that cash flow is the most important source of financing for R&D, while long-term debt is used to finance tangible assets. In Africa, several studies have attempted to analyze the link between financial leverage and investment decisions. Using data on listed firms in South Africa, Mondosha and Majoni, (2018) find a negative relationship between leverage and investment. Vengesai and Kwenda, (2018) study the impact of financial leverage on investment of African listed firms. The results reveal that financial leverage has a negative impact on investment. Nyale (2010), based on firms in Kenya, validates the hypothesis that leverage negatively influences investment decisions. Odit and Chittoo, (2008) find a significant negative relationship between leverage and investment for Mauritian firms. This relationship is stronger in firms with low growth opportunity. From the above we formulate the following hypothesis: H1: Financial leverage (debt) negatively influences firm’s investment in Cameroon Other research works have studied the relationship in the opposite direction (Koksal et al, 2013; Degryse et al, 2010), analyzing the influence of assets on leverage. Indeed the asset structure plays an important role in determining the capital structure (Ellili and Farouk, 2011). The tradeoff theory (Stiglitz, 1969; Kraus and Litzenberger, 1973) provides a good perspective for analysis. This theory consists in setting a level of debt that allows the cost of debt to be equalized with the tax advantage that debt provides. In fact, excessive debt increases the risk of default by the company, which is accompanied by financial difficulties. These financial difficulties will worry the investors and may therefore renounce to grant new credits. However, a firm that has significant tangible assets reduces the costs of bankruptcy and can use these assets as collateral to issue new debt (Rajan and Zingales, 1995). Compared to intangible assets, tangible assets suffer less loss of value in distress. Thus, from a trade-off perspective, tangible assets have a significant effect on the costs of financial distress. Harris and Raviv (1991) argue that tangible assets are the collateral for debt and increase the net asset value. Thus, in bankruptcy, tangible assets reduce exposure to default, and enhance the possibility of repaying creditors. Harc (2015), using Croatian SMEs as a case study, shows that tangible assets positively and significantly influence financial leverage. He further concludes that said SMEs use tangible assets as collateral to facilitate access to long-term credit. Butt et al. (2013) based on data from Pakistan find a positive relationship of tangible assets on debt. De Jong et al. (2008) study the determinants of leverage in 42 countries and find a positive relationship between leverage and tangible assets. In addition, the contribution of investments to the acquisition of financial resources through debt depends on the type of fixed assets that are dominant. In some firms, tangible assets can support the desired leverage, while intangible assets have no impact on leverage. In contrast, in firms with limited tangible assets, intangible assets increase, and may influence leverage (Moeller et al, 2016). Indeed although some characteristics of intangible assets, such as high valuation risk and low ability to provide collateral, may discourage debt financing, they can also generate large cash flows, thus supporting leverage. Moreover, the information asymmetry and moral hazard inherent in intangible assets diminish when intangible assets are liquid and easily tradable (Sheleifer and Vishny, 1992; Loumioti, 2012). Using data from U.S. firms, Morellec (2001) analyzes the relationship between asset liquidity and capital structure. The results show that asset liquidity increases debt capacity. Nakamura (2001) estimates that one-third of the value of intangible assets of US firms is related to the value of its capital. Based on the above, we hypothesize that:
  • 4. Financial leverage and corporate investment: evidence from Cameroon International Journal of Business Marketing and Management (IJBMM) Page 35 H2: Firms' investment significantly increases their debt capacity in the Cameroonian context. However, the hypothesis of the non-linearity of the causal relationship between the financial leverage of firms and their investments arises with acuity. Indeed, the agency cost theory (Jensen and Meckling, 1976) suggests that at a lower level, debt has a disciplining effect on company managers. On the other hand, when debt becomes high, the probability of bankruptcy increases, and a misallocation of resources becomes more possible. The conclusions of previous studies are not consensual on the impact of financial leverage on investment. Indeed, some authors (Modigliani and Miller, 1963) show that the tax advantages provided by debt and the reduction of agency costs between shareholders and managers (Ross 1977) have positive effects on investment. On the other hand, excessive debt can lead to underinvestment. Indeed, when the conflict pits shareholders against creditors, managers tend to reduce investment, even in profitable projects. In this case, part of the profits remunerate the creditors instead of going entirely to the shareholders (Myers, 1977). Yarba (2021) provides significant evidence of an inverted "U" relationship between leverage and investment based on firm data in Turkey. The findings of his investigations indicate that leverage increases investment up to a certain level. As leverage becomes higher, its impact on investment becomes negative. This non-monotonic relationship is evident for all groups of firms. Cleary et al (2007) analyze the effect of equity on investment for US firms. The results reveal a U- shaped functional relationship. At low levels of equity, the relationship is negative; it becomes positive as equity becomes more important. Shukla and Shaw (2021) analyze data from Indian firms and find a non-linear relationship between debt and investment. Hernando and Martinez-Carrascal (2008) find a non-linear relationship between debt and investment in Spanish firms. According to these authors, this relationship has an "S" shape. Gebauer et al (2018) validate the hypothesis of the non-linearity of the relationship between debt and investment in a European context. From the above, we hypothesize that: H3: The relationship between leverage and investment assumes an inverted U shape. In this case, at a low level of leverage the relationship is positive; it becomes negative with increasing leverage. II. Data and model specification II.1. Data The data used in this work come from the National Institute of Statistics of Cameroon (INS). They are based on the year-end balance sheets and income statements of 1,500 firms in several sectors of activity over the period 2014-2017. They allowed us to assess the financial situation of the companies concerned. After the necessary cleaning operations of the initial data and other statistical processing, the final working sample retained 1362 companies. The variables used in this study were identified to satisfy the objective of testing for a bidirectional causal relationship between leverage and investment. Financial leverage refers to the propensity for a firm to resort to debt (Hillier et al. 2010). The literature indicates several ways to measure it. Aivazian et al (2005) use two alternative measures of leverage. One is the book value of total liabilities, excluding equity, divided by the book value of total assets. Another way to measure it is to divide long-term debt by total assets. The first measure does not distinguish between short-term and long-term debt, while the second emphasizes the dominant role of long-term debt as a source of investment financing. However, this work considers the former measure because, although the use of short-term debt exposes the firm to renewal constraints, it is often used to finance investment. Investment refers to the acquisition of a durable good. Previous work (Onomo et al., 2018) has measured investment by calculating the change in investment from the previous year. Sall (2002), in studying the source of investment financing for Senegalese SMEs, captured investment by the investment rate, which is the ratio of the value of investment to sales. Tioumagneng (2012) measures investment by total capital expenditures on intangible assets. Other authors (Danso, Lartey, Fosu, Owusu-Agyei, and Uddin, 2019; Firth et al, 2008) measure investment by taking the change in property, plant, and equipment which is scaled by beginning of period property, plant, and equipment. The different variables used are summarized in the table 1 below. Table 1 : variables of the study Codes Variable titles Calculation method Tot_leverage Financial leverage Total debt/total assets Inv_intensity Investment Delta gross assets/total assets(t-1) Roa Economic profitability ratio Operating income/Total assets Growth _opp Opportunities for growth (Ξ” sales)/sales (t-1) Size Company size Log (Total assets)
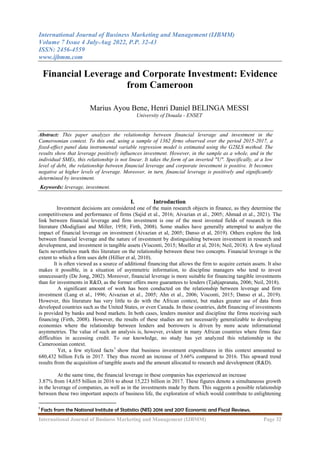
  • 5. Financial leverage and corporate investment: evidence from Cameroon International Journal of Business Marketing and Management (IJBMM) Page 36 Cash-flow Cash-flow Cash-flow/total assets(t-1) Inv_caf Capacity to finance investment Investment / cash flow Turnover Asset turnover ratio Sales/Total assets Chargefi_caf ability to bear financial burdens Financial expenses/Caf managmt_qlty Management quality Operating expenses/total assets Liquidity General liquidity Current assets/current liabilities II.2. Specification of the empirical model In this work, we use instrumental variable (IV) regression in panel data to test for a link between leverage and investment. The choice of this model is justified by the fact that linear regression models can suffer from simultaneous causality problems. If this is the case, the error term is correlated with the exogenous variables of interest, so the estimated parameters will be biased, and multiple regression cannot solve the problem. A general technique for obtaining a consistent estimator of the parameter of interest is the two-stage generalized least squares (G2SLS) method2 , applied that accounts for a possible endogeneity relationship. This model is, in general, specified as follows: 𝑦𝑖𝑑 = 𝒀𝑖𝑑𝛾 + 𝑿1𝑖𝑑𝛽 + ¡𝑖 + πœˆπ‘–π‘‘ Where 𝑦𝑖𝑑 is the dependent variable. 𝒀𝑖𝑑 is a vector (1 Γ— π‘˜1) of observations on π‘˜1 endogenous variables, and these variables can be correlated with the πœˆπ‘–π‘‘ which is the specific error term. 𝑿1𝑖𝑑 is a vector (1 Γ— π‘˜2) of observations on the exogenous variables. 𝛾 and 𝛽 are vectors (π‘˜1 Γ— 1) and (π‘˜2 Γ— 1) of coefficients respectively. Finally, πœ‡π‘– can be considered as identically and independently distributed random variables in the panel. Specifically, given that there is a single endogenous variable such as π‘˜1 = 1but several exogenous variables such as π‘˜2 > 1, the model is as follows: 𝐼𝑛𝑣_𝑖𝑛𝑑𝑒𝑛𝑠𝑖𝑑𝑦𝑖𝑑 = π›Ύπ‘‘π‘œπ‘‘_π‘™π‘’π‘£π‘’π‘Ÿπ‘Žπ‘”π‘’π‘–π‘‘ + πœ·π‘Ήπ’‚π’•π’Šπ’1𝑖𝑑 + ¡𝑖 + πœˆπ‘–π‘‘ (1) Where π‘™π‘’π‘£π‘’π‘Ÿπ‘Žπ‘”π‘’π‘–π‘‘ and 𝐼𝑛𝑣_𝑖𝑛𝑑𝑒𝑛𝑠𝑖𝑑𝑦𝑖𝑑 are the firm's leverage and investment, respectively. This work also explores the possibility of a non-linear relationship between investment and leverage. For Hernando and Martinez-Carrascal (2008), the method of establishing the nonlinear relationship requires the use of thresholds that are exogenously set and thus somewhat arbitrary. Therefore, we analyze a quadratic function to test for nonlinearity. The quadratic function is of the following form: 𝐼𝑛𝑣_𝑖𝑛𝑑𝑒𝑛𝑠𝑖𝑑𝑦𝑖𝑑 = 𝛾1π‘‘π‘œπ‘‘_π‘™π‘’π‘£π‘’π‘Ÿπ‘Žπ‘”π‘’π‘–π‘‘ + 𝛾2π‘‘π‘œπ‘‘_π‘™π‘’π‘£π‘’π‘Ÿπ‘Žπ‘”π‘’π‘–π‘‘ 2 + πœ·π‘Ήπ’‚π’•π’Šπ’π‘–π‘‘ + ¡𝑖 + ɛ𝑖𝑑 (2) The sample is made up of 89.50% SMEs and 10.50% large enterprises. It includes 85.46%, 11.89% and 2.65% of companies in the tertiary, secondary, and primary sectors respectively. For all companies, the average annual growth of investments is 4.32%. It is 4.18% in SMEs and 5.55% in large companies. Moreover, according to the results of the mean-comparison test in table 4a, the difference in terms of the 2014-2017 average investment growth between small and medium-size enterprises and large companies is significant. In addition, Figure 1 shows that about 60% of the firms in the sample has a 4-years average investment change comprised in the interval . As for the sectors of activity, the annual investment change is, on average, 4.36%, 3.85% and 5.08% respectively in firms in the tertiary, secondary and primary sectors. Also, the average leverage is 53.87 percent overall. It is 53.47 percent for SMEs and 57.35 percent for large firms. Furthermore, the mean-comparison test reported in Table 4b shows that the difference in the 4-year mean of the average leverage is significant between SMEs and large companies. Firms in the primary sector have an average leverage of 58.06%, (57.81%) for those in the secondary sector and tertiary sector records a leverage of 53.20%. The investment self-financing ratio is 2.87% on average. Furthermore, the companies in 2 We suggest that the interested reader explore the work of Balestra and Varadharajan-Krishnakumar (1987) for further reading.
  • 6. Financial leverage and corporate investment: evidence from Cameroon International Journal of Business Marketing and Management (IJBMM) Page 37 the sample achieve an average of 1.27 points of turnover per unit of assets, while their average operating expenses are 1.43 times higher than their total assets. The coverage of financial expenses by equity is 1.3%. For most of these variables, the dispersion is small and ranges from 0.05 to 2.37. The result of this statistical description is listed in Tables 2 and 3 below. Table 2 : Descriptive statistics Variables Obs Mean Std. Dev. Min Max tot_leverage 4,086 0.5387 0.2870 0.0000 0.9994 inv_intensity 4,086 0.0432 0.2318 -0.9906 0.9949 Roa 4,086 0.0213 0.4162 -4.1907 3.1533 growth_opp 4,086 0.1548 0.7445 -1.0000 4.8664 inv_caf 4,086 0.0287 1.0915 -5.8860 5.8589 cash-flow 4,086 -0.2249 0.9421 -4.9456 4.6350 Size 4,086 18.6731 2.3703 10.4929 27.5250 managmt_qlty 4,086 1.4350 1.1303 0.0000 6.7334 charfi_caf 4,086 0.0131 0.0504 0.0000 1.1695 turnover 4,086 1.2771 0.9463 0.0000 4.8745 liquidity 4,086 0.9988 0.9320 0.0000 6.3159 Table 3 : Characteristics of the sample by size and industry Variable Obs Mean Std. Dev. Min Max By company size SME tot_leverage 3,657 0.5347 0.2931 0.0000 0.9987 inv_intensity 3,657 0.0418 0.2424 -0.9906 0.9949 GE tot_leverage 429 0.5735 0.2250 0.0000 0.9994 inv_intensity 429 0.0555 0.1031 -0.3948 0.8108 By sector Primary tot_leverage 108 0.5806 0.3005 0.0000 0.9951 inv_intensity 108 0.0508 0.2208 -0.9906 0.9698 Secondary tot_leverage 486 0.5781 0.2387 0.0000 0.9987 inv_intensity 486 0.0385 0.1795 -0.8817 0.9152 Tertiary tot_leverage 3,492 0.5320 0.2922 0.0000 0.9994 inv_intensity 3,492 0.0436 0.2385 -0.9902 0.9949
  • 7. Financial leverage and corporate investment: evidence from Cameroon International Journal of Business Marketing and Management (IJBMM) Page 38 Table 4a : Comparison of firms' investment growth by type of firm ttest avg_inv_intensity , by ( firm_type_1 ) unequal Two-sample t test with unequal variances Group Obs Mean Std. Err Std. Dev [95% Conf. Interval] SME 1,219 0.0418 0.0036 0.1262 0.0347 0.0489 LC 143 0.0555 0.0050 0.0604 0.0455 0.0655 combined 1,362 0.0432 0.0033 0.1210 0.0368 0.0497 diff -0.0137 0.0033 -0.0259 -0.0015 diff = mean (1) - mean (2) t = -2.2088 Ho : diff = 0 Satterthwaite's degrees of freedom = 315.177 Ha : diff < 0 Ha : diff != 0 Ha : diff > 0 Pr (T < t) = 0.0140 Pr (|T| > |t|) = 0.0279 Pr (T > t) = 0.9860 Table 4b : Comparison of firm leverage by type of firm ttest avg_tot_leverage , by ( firm_type_1 ) unequal Two-sample t test with unequal variances Group Obs Mean Std. Err Std. Dev [95% Conf. Interval] SME 1,219 0.5347 0.0742 0.2590 0.5201 0.5492 LC 143 0.5735 0.0178 0.2132 0.5383 0.6088 combined 1,362 0.5387 0.0069 0.2548 0.5252 0.5523 diff -0.0389 0.0193 -0.0769 -0.0008 diff = mean (1) - mean (2) t = -2.0134 Ho : diff = 0 Satterthwaite's degrees of freedom = 194.779 Ha : diff < 0 Ha : diff != 0 Ha : diff > 0 Pr (T < t) = 0.0227 Pr (|T| > |t|) = 0.0454 Pr (T > t) = 0.9773 -0.80 -0.60 -0.40 -0.20 0.00 0.20 0.40 0.60 0.80 0 200 400 600 800 1000 1200 1400 variation of firm's investment enterprises Figure 1: Average (2014-2017) firms' investment growth
  • 8. Financial leverage and corporate investment: evidence from Cameroon International Journal of Business Marketing and Management (IJBMM) Page 39 II. Results The empirical results reported in Tables 5 and 6 show that leverage and investment have a positive and significant linear relationship. Indeed, an increase in financial leverage of 1% leads to an increase in investment of 0.48%. This can be explained by the fact that the debt contracted is effectively allocated to investment, and Cameroonian firms use it efficiently in investment projects. Thus, financial leverage has a direct and positive effect on the investment of the firms studied. This result is not consistent with the agency theory (Jensen and Meckling, 1976), nor with the findings of Aivazian et al. (2005), Mondosha and Majoni, (2018) and Vengesai and Kwenda, (2018), which show that financial leverage acts negatively on the level of investment. Indeed, since firms in Cameroon are mostly SMEs, where the figures of the manager and the shareholder often merge, agency conflicts are less prevalent. The owner-manager then tends to effectively use debt to finance the investment. Our first hypothesis is not validated. Moreover, while leverage has a significant and positive influence on investment in SMEs, this relationship is more important in large firms. Indeed, a 1% increase in financial leverage translates into a 0.46% and 0.93% increase in investment respectively. Large companies invest twice as much as SMEs. This is justified by the fact that, unlike SMEs, large companies make better use of the financial resources acquired through debt, and allocate them to the best investment projects. Furthermore, the results of the Hausman test (Table 7), which verifies the existence of endogeneity between two variables, reveal that there is indeed a difference between the instrumental variable estimator and the OLS estimator, confirming that financial leverage is endogenous in its relationship with investment. Indeed, the latter in turn significantly and positively influences the financial leverage of firms in Cameroon. Firms that have invested in both tangible and intangible assets use these assets as collateral to solicit credit. This result is consistent with the predictions of trade-off theory (Stiglitz, 1969; Kraus and Litzenberger, 1973) and empirical work (Harc, 2015; Butt et al. 2013). The hypothesis is 2 validated. Furthermore, the results show that investment is negatively determined by the square of leverage. This suggests a non-linear relationship between the two variables. This result is consistent with predictions of underinvestment (Myers, 1977) and overinvestment (Jensen 1986) and the findings of (Ahn and Denis, 2006; Lang and Stulz, 1994; Ruland and Zhou; 2005). In these firms, debt plays the role of disciplining managers who tend to waste equity. Specifically, when debt is low for financing purposes, the relationship between leverage and investment is positive. It becomes negative at high levels of leverage. This suggests a relationship that takes the form of an inverted U. This result is consistent with the predictions of Hernando and Martinez-Carrascal (2008) and Gebauer et al. (2018) and Yarba (2021) who find a non-linear relationship between leverage and investment of European firms. Our third hypothesis is validated. However, this inverted-U relational form is only valid in the subsample of SMEs. The relationship is linear in large firms. In terms of control variables, investment is positively determined by the cash flow and cash flow capacity of firms in Cameroon. An increase in cash flow of 1 percentage point leads to an increase in investment of 0.02 (0.063). This result is also valid for the SME subsample. In large companies, only cash flow is positively related to investment. Financial leverage is positively influenced by growth opportunities and size, while it is negatively related to cash flow and liquidity. Indeed, when growth opportunities increase by 1%, financial leverage also increases by 0.9%. This situation translates into the fact that in order to seize growth opportunities, companies tend to take on debt to finance investment. Cash flow has a significant influence on leverage and investment. The larger the size of the company, the easier it is to access debt. This is explained by the fact that larger companies have less asymmetric information about their economic and financial health. An increase in cash flow of 1% leads to a reduction in financial leverage of 0.1%. This reflects the fact that a firm requires less external capital, debt in this case, when it has sufficient cash flow to finance its investments. This result is not consistent with the predictions of the agency theory of Jensen and Meckling (1976), and the conclusions of Jensen (1986). In these firms, however, excess cash flow leads managers to choose unprofitable projects in order to gain a foothold. Finally, management quality has a positive effect on the use of financial leverage. Thus, a 1% increase in operating expenses per unit of assets leads to a greater use of debt of about 0.0042 points. Although negligible, this result suggests that firms that have difficulty controlling their expenses make greater use of debt to meet their investment needs.
  • 9. Financial leverage and corporate investment: evidence from Cameroon International Journal of Business Marketing and Management (IJBMM) Page 40 Table 5 : Relationship between financial leverage and investment Table 6 : Relationship between financial leverage and investment by type of firm
  • 10. Financial leverage and corporate investment: evidence from Cameroon International Journal of Business Marketing and Management (IJBMM) Page 41 Table 7 : Endogeneity test Coefficients (b) (B) (b-B) sort(diag(V_b-V_B)) Consistent Efficient Difference H.E. tot_leverage 0.4764 -0.0003 0.4767 0.1146 growth_opp 0.0069 0.0255 -0.0186 0.0044 inv_caf 0.0187 0.0089 0.0099 0.0028 cashflow 0.0637 0.0062 0.0574 0.0145 Roa 0.0161 0.0128 0.0033 0.0121 chi2(5) = (b-B)'[(V_b-V_B)^(-1)](b-B) = 36.91 Prob>chi2 = 0.0000 III. Conclusion Financial leverage in a foreign context has a negative effect on the level of investment. It sometimes plays the role of disciplining the manager and attenuates overinvestment. This study aimed to empirically establish the relationship between financial leverage and investment in firms in the Cameroonian context. We adopted an instrumental variables regression model applied to fixed-effect panel data to mitigate the possibility of the endogeneity problem of leverage and investment. The analysis was done on a sample of 1362 Cameroonian firms over the period 2015 to 2017. It appears that financial leverage positively influences investment, and this relationship is endogenous. Thus, debt facilitates firm’s investments in Cameroon. The higher the debt, the higher the level of investment. However, this relationship is not linear. It takes the form of an inverted "U". This is due to the fact that, at higher level of indebtness, the relationship turns negative. It stands for the reason that, when the optimal level of firm leverage is achieved, the financial expenses due to the excess leverage become higher than the excess return generated by the investments. As for the analysis of the relationship by firm type, the results, remain unchanged for both sub-sample. Indeed, financial leverage positively influences investment in both large firms and SMEs. However, the non- linearity hypothesis of the relationship does not hold in large companies. In African economies and particularly in Cameroon, it is advisable for business leaders to take into account the monetary policy put in place by the authorities. This would allow the company to opt for an adequate financing policy that balances the benefits and costs of debt, and the realization of investments necessary for business growth. While this work has yielded interesting results on the relationship between leverage and investment, some limitations must be highlighted. The study was based on data from the National Institute of Statistics. The quality of the results obtained depends on the reliability of the data used. This research also presents problems of generalization. The results may not be generalizable to other African countries. There are differences in economic policies from one country to another and in access to capital markets, corporate governance structures. Lastly, it may be interesting to find out the optimal level of firm leverage in the Cameroonian context. Bibliography [1]. Ahmad, M. M., Hunjra, A. I., and Taskin, D. (2021). Do asymmetric information and leverage affect investment decisions? The Quarterly Review of Economics and Finance. [2]. Ahn, S., Denis, D. J., and Denis, D. K. (2006). Leverage and investment in diversified firms. Journal of financial Economics, 79(2), 317-337. [3]. Aivazian, V. A., Ge, Y., and Qiu, J. (2005). The impact of leverage on firm investment: Canadian evidence. Journal of corporate finance, 11(1-2), 277-291. [4]. Balestra, P., and Varadharajan-Krishnakumar, J. (1987). Full information estimations of a system of simultaneous equations with error component structure. Econometric Theory, 3(2), 223-246.
  • 11. Financial leverage and corporate investment: evidence from Cameroon International Journal of Business Marketing and Management (IJBMM) Page 42 [5]. Butt, S., Khan, Z. A., and Nafees, B. (2013). Static Trade-off theory or Pecking order theory which one suits best to the financial sector. Evidence from Pakistan. European Journal of Business and Management, 5(23), 131-140. [6]. Cheng, X., and Degryse, H. (2010). The impact of bank and non-bank financial institutions on local economic growth in China. Journal of Financial Services Research, 37(2), 179-199. [7]. Cleary, S., Povel, P., and Raith, M. (2007). The U-shaped investment curve: Theory and evidence. Journal of financial and quantitative analysis, 42(1), 1-39. [8]. Danso, A., Lartey, T., Fosu, S., Owusu-Agyei, S., and Uddin, M. (2019). Leverage and firm investment: the role of information asymmetry and growth. International Journal of Accounting and Information Management. [9]. De Jong, A. (2002). The disciplining role of leverage in Dutch firms. Review of Finance, 6(1), 31-62. [10]. De Jong, A., Kabir, R., and Nguyen, T. T. (2008). Capital structure around the world: The roles of firm-and country-specific determinants. Journal of banking and Finance, 32(9), 1954-1969. [11]. Denis, D. J., and Denis, D. K. (1993). Managerial discretion, organizational structure, and corporate performance: A study of leveraged recapitalizations. Journal of Accounting and Economics, 16(1-3), 209-236. [12]. Ellili, N., and Farouk, S. (2011). Examining the capital structure determinants: empirical analysis of companies traded on Abu Dhabi Stock Exchange. [13]. Fazzari, S. M., and Athey, M. J. (1987). Asymmetric information, financing constraints, and investment. The Review of Economics and Statistics, 481-487. [14]. Firth, M., Lin, C., and Wong, S. M. (2008). Leverage and investment under a state-owned bank lending environment: Evidence from China. Journal of corporate finance, 14(5), 642-653. [15]. GarcΓ­a-Posada, M., MenΓ©ndez Pujadas, Á., and Mulino Rios, M. (2020). Determinants of investment in tangible and intangible fixed assets. Banco de Espana Occasional Paper, (2004). [16]. Gebauer, S., Setzer, R., and Westphal, A. (2018). Corporate debt and investment: A firm-level analysis for stressed euro area countries. Journal of International Money and Finance, 86, 112-130. [17]. Harc, M. (2015). The relationship between tangible assets and capital structure of small and medium- sized companies in Croatia. Ekonomski Vjesnik/Econviews: Review of Contemporary Business, Entrepreneurship and Economic Issues, 28(1), 213-224. [18]. Harris, M., and Raviv, A. (1991). The theory of capital structure. The Journal of Finance, 46(1), 297- 355. [19]. Hernando, I., and MartΓ­nez-Carrascal, C. (2008). The impact of financial variables on firms’ real decisions: evidence from Spanish firm-level data. Journal of Macroeconomics, 30(1), 543-561. [20]. Hillier, D., Jaffe, J., Jordan, B., Ross, S., and Westerfield, R. (2010).Corporate Finance, First European Edition, McGraw-Hill Education [21]. Ho, Y. K., Tjahjapranata, M., and Yap, C. M. (2006). Size, leverage, concentration, and R&D investment in generating growth opportunities. The Journal of Business, 79(2), 851-876. https://ins-cameroun.cm [23]. Jensen, M. C. (1986). Agency costs of free cash flow, corporate finance, and takeovers. The American economic review, 76(2), 323-329. [24]. Jensen, Michael., Meckling, William C. (1976), Β«Theory of the firm: Managerial behaviour, Agency costs, and ownership structure Β», Journal of Financial Economics, Vol. 3, p. 305-360. [25]. KΓΆksal, B., Orman, C., and Oduncu, A. (2013). Determinants of capital structure: evidence from a major emerging market economy. MPRA Paper, 48415. [26]. Kraus, A., and Litzenberger, R. H. (1973). A state-preference model of optimal financial leverage. The journal of finance, 28(4), 911-922. [27]. Lang, L. H., and Stulz, R. M. (1994). Tobin's q, corporate diversification, and firm performance. Journal of political economy, 102(6), 1248-1280. [28]. Lang, L., Ofek, E., and Stulz, R. (1996). Leverage, investment, and firm growth. Journal of financial Economics, 40(1), 3-29. [29]. Lim, S. C., Macias, A. J., and Moeller, T. (2020). Intangible assets and capital structure. Journal of Banking and Finance, 118, 105873. [30]. Loumioti, M. (2012). The use of intangible assets as loan collateral. Available at SSRN 1748675. [31]. Mauskar, N. (2018). Accounting for Leverage in Intangible and Tangible Investments across the Business Cycle. Undergraduate Economic Review, 15(1), 1.) [32]. Modigliani, F., and Miller, M. H. (1958). The cost of capital, corporation finance and the theory of investment. The American economic review, 48(3), 261-297.
  • 12. Financial leverage and corporate investment: evidence from Cameroon International Journal of Business Marketing and Management (IJBMM) Page 43 [33]. Modigliani, F., and Miller, M. H. (1963). Corporate income taxes and the cost of capital: a correction. The American economic review, 53(3), 433-443. [34]. Mondosha, M., and Majoni, A. (2018). The impact of leverage on investment decisions for South African firms with different growth opportunities. Journal of Economic and Financial Sciences, 11(1), 1-7. [35]. Morellec, E., and SchΓΌrhoff, N. (2011). Corporate investment and financing under asymmetric information. Journal of financial Economics, 99(2), 262-288. [36]. Morellec, E. (2001). Asset liquidity, capital structure, and secured debt. Journal of financial economics, 61(2), 173-206. [37]. Moro Visconti, R. (2015). Leveraging value with intangibles: More guarantees with less collateral? Corporate ownership and control, 13(1). [38]. Myers, S. C. (1977). Determinants of corporate borrowing. Journal of financial economics, 5(2), 147- 175. [39]. Myers, S. C., and Majluf, N. S. (1984). Corporate financing and investment decisions when firms have information that investors do not have. Journal of financial economics, 13(2), 187-221. [40]. Nakamura, L. I. (2001). Investing in intangibles: is a trillion dollars missing from the GDP? Business Review, (Q4), 27-36. [41]. Nyale, Y. (2010). The relationship between leverage and investment decisions for companies quoted at the Nairobi Stock Exchange (Doctoral dissertation, University of Nairobi, Kenya). [42]. Odit, M. P., and Chittoo, H. B. (2008). Does financial leverage influence investment decisions? The case of Mauritian firms. Journal of Business Case Studies (JBCS), 4(9), 49-60. [43]. Onomo, M. B., Ayou Bene, M., and Fall, F. (2019). PropriΓ©tΓ© Γ©trangΓ¨re, investissement et performance des entreprises en Afrique: cas du Cameroun. Management international, 23, 159-171. [44]. Rajan, R. G., and Zingales, L. (1995). What do we know about capital structure? Some evidence from international data. The journal of Finance, 50(5), 1421-1460. [45]. Ross, S. A. (1977). The determination of financial structure: the incentive-signalling approach. The bell journal of economics, 23-40. [46]. Ruland, W., and Zhou, P. (2005). Debt, diversification, and valuation. Review of Quantitative Finance and Accounting, 25(3), 277-291. [47]. Sajid, M., Mahmood, A., and Sabir, H. M. (2016). Does financial leverage influence investment decisions? Empirical evidence from KSE-30 index of Pakistan. Asian Journal of Economic Modelling, 4(2), 82-89. [48]. Sall, M. B. (2002). La source de financement des investissements de la PME: Une Γ©tude empirique sur donnΓ©es sΓ©nΓ©galaises. Africa Development/Afrique et DΓ©veloppement, 84-115. [49]. Shleifer, A., and Vishny, R. W. (1992). Liquidation values and debt capacity: A market equilibrium approach. The journal of finance, 47(4), 1343-1366. [50]. Shleifer, A., and Vishny, R. W. (1997). A survey of corporate governance. The journal of finance, 52(2), 737-783. [51]. Shukla, A. K., and Shaw, T. S. (2021). Impact of Leverage on Firms’ Investment. Economic and Political Weekly, 56(35), 45. [52]. Stiglitz, J. E. (1969). A re-examination of the Modigliani-Miller theorem. The American Economic Review, 59(5), 784-793. [53]. Stiglitz, J. E., and Weiss, A. (1981). Credit rationing in markets with imperfect information. The American economic review, 71(3), 393-410. [54]. Stulz, R. (1990). Managerial discretion and optimal financing policies. Journal of financial Economics, 26(1), 3-27. [55]. Tioumagneng, A. (2012). BANQUES ET COMPORTEMENT D'ENDETTEMENT DES ENTREPRISES. Recherches en Sciences de Gestion, (89). [56]. Titman, S., and Wessels, R. (1988). The determinants of capital structure choice. The Journal of finance, 43(1), 1-19. [57]. Umutlu, M. (2010). Firm leverage and investment decisions in an emerging market. Quality and Quantity, 44(5), 1005-1013. [58]. Vengesai, E., and Kwenda, F. (2018). The impact of leverage on discretionary investment: African evidence. African journal of economic and management studies. [59]. Vo, X. V. (2019). Leverage and corporate investment–Evidence from Vietnam. Finance Research Letters, 28, 1-5. [60]. Yarba, I. (2021). Corporate Indebtedness and Investment: Micro Evidence of an Inverted U-Shape (No. 2131).