POSHAN District Nutrition Profile_Sitamarhi_Bihar
•
0 likes•110 views

POSHAN District Nutrition Profiles (DNPs) draw on diverse sources of data to compile a set of indicators on the state of nutrition and its cross-sectoral determinants. The profiles are intended to be conversation-starters at the district level and to enable discussions about why undernutrition levels are high, and which factors, at multiple levels, might need to be addressed to improve nutrition. PLEASE NOTE that POSHAN is regularly tracking data sources as they are released and updating the profiles accordingly.

Recommended
Recommended
More Related Content
What's hot
What's hot (20)
Viewers also liked
Viewers also liked (18)
More from POSHAN
More from POSHAN (20)
Recently uploaded
Recently uploaded (20)
POSHAN District Nutrition Profile_Sitamarhi_Bihar
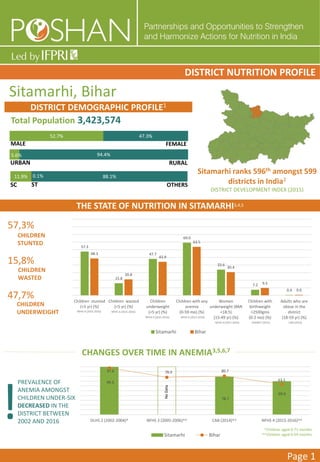
- 1. 52.7% 47.3% 57.3 15.8 47.7 69.0 33.6 7.2 0.4 48.3 20.8 43.9 63.5 30.4 9.5 0.6 Children stunted (<5 yr) (%) Children wasted (<5 yr) (%) Children underweight (<5 yr) (%) Children with any anemia (0-59 mo) (%) Women underweight (BMI <18.5) (15-49 yr) (%) Children with birthweight <2500gms (0-2 mo) (%) Adults who are obese in the district (18-59 yr) (%) Sitamarhi Bihar 11.9% 0.1% 88.1% 5.6% 94.4% Sitamarhi, Bihar DISTRICT NUTRITION PROFILE Page 1 THE STATE OF NUTRITION IN SITAMARHI3,4,5 DISTRICT DEMOGRAPHIC PROFILE1 Total Population 3,423,574 MALE FEMALE RURALURBAN SC ST OTHERS CHANGES OVER TIME IN ANEMIA3,5,6,7 CHILDREN STUNTED CHILDREN WASTED CHILDREN UNDERWEIGHT 57,3% 15,8% 47,7% Sitamarhi ranks 596th amongst 599 districts in India2 DISTRICT DEVELOPMENT INDEX (2015) NFHS 4 (2015-2016) 99.3 78.7 69.0 97.6 78.0 80.7 63.5 DLHS 2 (2002-2004)^ NFHS 3 (2005-2006)^^ CAB (2014)^^ NFHS 4 (2015-2016)^^ Sitamarhi Bihar NoData CHHNS7 (2015) CAB (2014)NFHS 4 (2015-2016) PREVALENCE OF ANEMIA AMONGST CHILDREN UNDER-SIX DECREASED IN THE DISTRICT BETWEEN 2002 AND 2016 ! NFHS 4 (2015-2016) NFHS 4 (2015-2016) NFHS 4 (2015-2016) ^Children aged 0-71 months ^^Children aged 0-59 months
- 2. 32.5 68.0 99.7 34.6 58.3 99.2 Women who received ANC in the first trimester (15-49 yr) (%) Anemia among pregnant women (15-49 yr) (%) Anemia among adolescent girls (10-19 yr) (%) Sitamarhi Bihar 34.4 38.4 38.5 8.6 62.6 56.7 13.5 38.4 1.6 34.9 53.5 30.7 7.3 61.7 62.3 10.4 45.2 2.5 Children breastfed within one hour of birth (<3 yr) (%) Children exclusively breastfed (0-6 mo) (%) Children who received any solid/semi solid food in the last 24 hours (6-8 mo) (%) Children who achieve minimum diet diversity (6-23 mo) (%) Children with full immunization coverage (12-23 mo) (%) Children who got vitamin A supplementation (9-59 mo) (%) Children suffering from diarrhoea in the last 2 weeks (<5 yr) (%) Children with diarrhoea treated with ORS (<5 yr) (%) Children showing symptoms of ARI (<5 yr) (%) DISEASE BURDEN3 Page 2 Child undernutrition is caused by inadequacies in food, health and care for infants and young children, especially in the first two years of life (immediate causes). Inadequate food, health and care arise from food insecurity, unsanitary living conditions, low status of women, and poor health care (underlying causes). These are, in turn, caused by social inequity, economic challenges, poor political will and leadership to address these causes (basic causes). Interventions to address undernutrition must address these multiple causes of undernutrition and do so in an equitable manner. IMMEDIATE CAUSES OF UNDERNUTRITION Areas for action: Data challenges: IMMEDIATE CAUSES Breastfeeding, nutrient rich foods, and eating routine Feeding and caregiving practices, parenting stimulation Low burden of infectious diseases Optimum fetal and child nutrition and development WHAT FACTORS CAUSE UNDERNUTRITION?13 UNDERLYING CAUSES Food security: availability, economic access and use of food Feeding and caregiving resources (maternal, household and community level) Access to and use of health services, a safe and hygienic environment BASIC CAUSES Knowledge and evidence Politics and governance Leadership, capacity and financial resources Social, economic, political, and environmental context (national and global) The most crucial period for child nutrition is from pre-pregnancy to the second year of life2 HOW CAN NUTRITION IMPROVE? ADOLESCENT & MATERNAL HEALTH3,5 INFANT AND YOUNG CHILD FEEDING3 0 10 20 30 40 50 60 70 80 90 100 Age of child (in months) Percentageofchildstunting(%) Window of opportunity Too late IMMUNIZATION & SUPPLEMENTATION3 DLHS 2 (2002-2004) • Poor state of infant and young child feeding: Very few infants are breastfed within on hour of birth, few are exclusively breastfed for six months and diet diversity rates are poor • Low rates of immunization and vitamin A supplementation, which needs urgent attention • Less than half of women in the district, report having received ANC in the first trimester • Alarming levels of anaemia among adolescent girls • Where data are available, indicator definitions are non- standardized and often differ from World Health Organisation recommendations NFHS 4 (2015-2016) NFHS 4 (2015-2016) NFHS 4 (2015-2016) NFHS 4 (2015-2016) NFHS 4 (2015-2016) NFHS 4 (2015-2016) NFHS 4 (2015-2016)NFHS 4 (2015-2016)NFHS 4 (2015-2016) NFHS 4 (2015-2016) NFHS 4 (2015-2016)
- 3. 42.0 93.6 94.6 32.7 50.4 91.7 57.2 44.4 Adult literacy rate (%) Households with access to primary/middle school (%) Households who demanded and received work through NREGA (%) Households availing banking services (%) Sitamarhi Bihar 50.0 41.2 50.3 63.7 30.3 45.7 9.0 49.4 34.8 53.2 34.1 50.9 48.1 16.4 Household share of expenditure on food (%) Household share of food expenditure on cereals (%) Households in the district involved in agriculture (%) Households Below Poverty Line (%) Household ownership of agricultural land (%) Households living in a pucca house (%) Household access to electricity (%) Sitamarhi Bihar 37.6 12.2 49.7 11.1 19.6 100.0 20.2 78.3 15.2 49.6 22.8 39.1 12.2 21.2 98.2 25.2 75.8 73.3 20.8 Women who are literate (15-49 yr) (%) Women who completed 10 or more years of schooling (15-49 yr) (%) Girls married when <18 years old (20-24 yr) (%) 15-19 year old women who are mothers or pregnant (%) Total unmet need for family planning methods among women (15-49 yr) (%) Households with access to improved drinking water sources (%) Households with access to improved sanitation facilities (%) Households practicing open defecation (%) Households disposing of child stool in a sanitary manner (%) Households washing hands with soap before meals (%)^ NFHS 3 (2005-2006) NoData Census (2011) SOCIO ECONOMIC CONDITIONS 1,9,14,15 Page 3 UNDERLYING CAUSES OF UNDERNUTRITION BASIC CAUSES OF UNDERNUTRITION1,8,9 • Per capita gross district domestic product of Sitamarhi ranked 31st amongst 38 districts of Bihar in 2011-1215 • Bihar’s per capita income ranked last amongst 32 major States/UTs in India in 2011-1216 • Action needs to be taken to improve adult literacy which is low • No data available on indicators of governance and political will to address nutrition Areas for immediate action: • Less than half of women in the district are literate • Very high rates of open defecation; critical need to increase awareness about washing hands with soap and ensuring access to improved sanitation facilities • Food insecurity, especially diet quality, is a challenge that can hold back improvements in nutrition • Very few households live in a ‘pucca’ house and have access to electricity Data challenges: • Outdated data on open defecation • No district-level data on child stool disposal WOMEN’S STATUS3 WATER, SANITATION AND HYGIENE1,4,7 FOOD SECURITY 9 CHHNS 7 (2015) Census (2011) Census (2011)NSS 68th round (2011-2012) NSS 68th round (2011-2012) NSS 68th round (2011-2012) Census (2011)Census (2011) DLHS 3 (2007-2008) NSS 68th round (2011-2012) NSS 68th round (2011-2012)NSS 68th round (2011-2012) NFHS 4 (2015-2016) NFHS 4 (2015-2016) NFHS 4 (2015-2016) NFHS 4 (2015-2016) NFHS 4 (2015-2016) NFHS 4 (2015-2016) NFHS 4 (2015-2016)
- 4. 52.7 9.3 81.6 37.3 9.6 11.2 63.8 8.2 9.4 86.8 91.7 32.7 31.0 Institutional deliveries (Women 15-49 yr) (%) Home births attended by skilled health personnel (Women 15-49 yr) (%) New born received check up within 24 hours of birth/discharge (%) Households (with 12-23 mo child) with an immunization/MCP card (%) Households with access to Anganwadi worker (%) Households with access to a Sub-Health Centre (%) Households that received financial assistance for delivery and childcare (%) 28.7 41.540.3 21.7 43.9 Households that receive any take home ration (%) Women who received THR during pregnancy (%) Households with access to PDS (%) Sitamarhi Bihar NoData This District Nutrition Profile was developed by Abhilasha Vaid and Srabashi Ray for POSHAN. This version, dated 06-05-2016 is a draft intended for use in a district-level workshop in Sitamarhi, and will be revised following workshop discussions. EVALUATION OF HEALTH AND NUTRITION SCHEMES3,4,8,9,12 FLW visits4 ^2 recommended visits; *3 recommended visits Last Trimester^ Within 1 week of delivery* Within 24 hours of delivery Less than recommended Equal to recommended More than recommended Less than recommended Equal to recommended More than recommended Bihar 9,4% 9,4% 17,8% 29,1% 4,9% 5,2% 33,4% Sitamarhi 11,0% 3,3% 8,6% 17,9% 3,0% 2,8% 21,9% NSS 68th round (2011-2012) DLHS 3 (2007-2008) DLHS 3 (2007-2008) NFHS 4 (2015-2016) CHHNS 7 (2015) RSOC (2013-2014) NoData CHHNS 7 (2015)CHHNS 7 (2015) NFHS 4 (2015-2016) Areas for immediate action: • Access to skilled health personnel and Sub-Health Centres is very limited • Very few households receive financial assistance for delivery and child care • Less than half of the eligible households receive any take home ration Data challenges: • Lack of data on assessing the implementation of government schemes RSOC (2013-2014) Data sources 1. Census of India. 2011. Primary Census Abstract. Accessed June 6, 2015, www.censusindia.gov.in/pca/default.aspx Census of India. 2011. Houselisting and Housing Census Data. Accessed March 18, 2015, www.censusindia.gov.in/2011census/hlo/HLO_Tables.html 2. Us-India Policy Institute. 2015. District Development and Diversity Index. Accessed July 2, 2015, http://www.usindiapolicy.org/updates/general-news/225-district-development-and-diversity-index- report 3. National Family Health Survey (NFHS-4), 2015-16, India. Mumbai: International Institute for Population Studies. 4. Concurrent Household Health and Nutrition Survey (Round-7), Concurrent Monitoring and Learning Unit, CARE India – Bihar 5. Census of India. 2014. Clinical, Anthropometric & Bio-chemical (CAB) survey. http://www.censusindia.gov.in/2011census/hh-series/HH-2/Bihar%20CAB%20Sample%20Characteristics%202014.pdf 6. Author’s estimates based on District Level Household Survey on Reproductive and Child Health (DLHS-2), 2002-04, India. International Institute for Population Studies. (IIPS). 2006. District Level Household Survey on Reproductive and Child Health (DLHS-2), 2002-04, India: Nutritional Status of Children and Prevalence of Anemia among Children, Adolescent Girls and Pregnant Women. Mumbai: IIPS. March 18, 2015, www.rchiips.org/pdf/rch2/National_Nutrition_Report_RCH-II.pdf 7. Author’s estimates based on National Family Health Survey (NFHS-3), 2005-06, India. Mumbai: International Institute for Population Studies. 8. International Institute for Population Studies (IIPS). 2010. District Level Household Survey and Facility Survey (DLHS-3), 2007-08, India, Bihar. Mumbai: IIPS. Accessed June 28, 2015, http://rchiips.org/pdf/rch3/report/BH.pdf 9. Author’s estimates based on Household Consumption Expenditure, National Sample Survey Office (NSSO) 68th Round, 2011-12. Ministry of Statistics and Program Implementation. Government of India Author’s estimates based on Employment and Unemployment, National Sample Survey Office (NSSO) 68th Round, 2011-12. Ministry of Statistics and Program Implementation. Government of India 10. Finance Department, Government of Bihar. Economic Survey Report 2011-12: Gross District Domestic Product at Constant Prices (2005-06). Accessed March 18, 2015, http://finance.bih.nic.in/Documents/Reports/Economic-Survey-2012-EN.pdf 11. Government of India. 2014. State-wise Per Capita Income and Gross Domestic Product at current prices. Accessed July 2, 2015, http://pib.nic.in/archieve/others/2014/aug/d2014070801.pdf 12. UNICEF. 2013-2014. Rapid Survey on Children (RSoC). http://wcd.nic.in/RSOC/21.RSOC_Bihar.pdf 13. Robert E Black, Cesar G Victora, Susan P Walker, Zulfiqar A Bhutta, Parul Christian, Mercedes de Onis, Majid Ezzati, Sally Grantham-McGregor, Joanne Katz, Reynaldo Martorell, Ricardo Uauy, and the Maternal and Child Nutrition Study Group. 2013. “Maternal and Child Undernutrition and Overweight in Low-Income and Middle-Income Countries”. The Lancet 382 (9890), 427-451. 14. Planning Commission. 2013. Press note on poverty estimates, 2011-12. Government of India. Accessed March 18, 2015. http://planningcommission.nic.in/news/pre_pov2307.pdf 15. Government of Bihar. 2015. Economic Survey 2014-15. Accessed July 2,2015, http://finance.bih.nic.in/Documents/Reports/Economic-Survey-2015-EN.pdf 16. Government of India. 2014. State-wise Per Capita Income and Gross Domestic Product at current prices. Accessed July 2, 2015, http://pib.nic.in/archieve/others/2014/aug/d2014070801.pdf 17. Photo Credit: Stephan Rebernik. 2012. https://www.flickr.com/photos/stephanrebernik/7316902886/in/photolist-c9z3j3-84jAhD-dBqB49-bvwZKN-r9S16m-7hbFtw-ww5wR-k32J4Y-9EU6Yp-aMYGun- qRTqtX-ecqSzg-gqsndt-dgcPVa-rir84x-e7rvKp-4W6FEL-b4cBSB-5Fobvq-gkNLN6-97MFur-52bDg-aE6CHE-5CWZqw-89D8Wg-C2Xyr-5JVCfB-8HyAVb-95jZH-96TGaG-89Daqn-hZXBgK-btaPQj-d4x1D9- kF5uPx-97MTqk-89D9ia-pSsahb-3fr98n-47wCFN-5dVprx-zfuF1-dB9Zrp-ww5c6-sq8LAW-8kUfxq-9ydJB-kqG1vB-aashk1-7a41P1