1. Appendices
Appendix A. Solar Potential in South Bay area
Los Angeles
region
Santa Monica and
long Beach
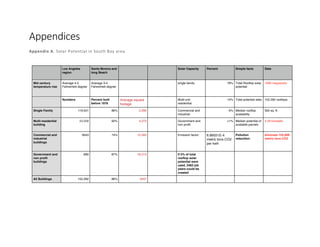
Solar Capacity Percent Simple facts Data
Mid century
temperature rise
Average 4-5
Fahrenheit degree
Average 3-4
Fahrenheit degree
single family 78% Total Rooftop solar
potential
1986 megawatts
Numbers Percent built
before 1978
Average square
footage
Multi-unit
residential
15% Total potential sites 152,292 rooftops
Single Family 119,501 86% 2,290 Commercial and
industrial
6% Median rooftop
availability
550 sq. ft.
Multi-residential
building
23,058 92% 4,273 Government and
non profit
<1% Median potential of
available parcels
5.28 kilowatts
Commercial and
industrial
buildings
9043 74% 15,593 Emission factor: 6.89551E-4
metric tons CO2
per kwh
Pollution
reduction:
eliminate 105,998
metric tons CO2
Government and
non profit
buildings
660 87% 16,213 If 5% of total
rooftop solar
potential were
used, 2483 job
years could be
created
All Buildings 152,262 86% 3347
5. Appendix D: Cost Benefit Analysis – SAM (System Advisory Model)
Energy types
in SAM
SAM inputs Input example Output Value
Solar
(Photovoltaic)
Residential
1. location and resource
2. Module, temperature correction
3. inverter
4. system design: string
configuration, tracking and
orientation( fixed, 1-axis, 2-axis)
5. shading and snow
6. losses
7. life time(degradation rate)
8. battery storage
9. system costs (direct capital cost,
indirect capital cost, operation and
maintenance cost)
10. financial parameters
11. incentives
12. electricity rates
13. electricity load
1, Los Angeles Intl arpt Annual energy 6,217 kWh
2, module: SPR-210-BLK-U Inverter:
SB4000US 240V
Capacity factor 18%
3, Nameplate capacity: 3.875kwdc
Tracking&Orientation: Fixed
First year
kWhAC/kWDC
1,605 kWh/kW
4, Life time( degradation rate): 0.5%per year Performance ratio 0.79
5, Loan term: 25years Loan rate: 5%per
year
Battery efficiency 0.00%
6, Federal income tax rate: 30% state
income tax rate: 7%
Levelized COE
(nominal)
9.08 ¢/kWh
7, Investment tax credit: federal 30% state
25%
Levelized COE (real) 7.18 ¢/kWh
8, Electric load: 6019kwh per year Electricity cost without
system
$973
Electricity cost with
system
$194
Net savings with
system
$779
Net present value $4,348
Payback period 11.7 years
Net capital cost $12,747
Equity $0
Debt $12,747
6. Energy types in
SAM
SAM inputs Input example Output Value
Solar (Photovoltaic)
Commercial
1, location and resource
2, Module, temperature correction
3, inverter
4, system design: string
configuration, tracking and
orientation( fixed, 1-axis, 2-axis)
5, shading and snow
6, losses
7, life time(degradation rate)
8, battery storage
9, system costs (direct capital
cost, indirect capital cost,
operation and maintenance cost)
10, financial parameters
11, incentives
12, electricity rates
13, electricity load
1, Los Angeles Intl arpt Annual energy 324,248 kWh
2, module: SPR-210-BLK-U
Inverter: ST36 (240) 240V
Capacity factor 18,5%
System Size: 200 kWdc
Tracking&Orientation: Fixed
First year
kWhAC/kWDC
1,623 kWh/kW
4, Life time( degradation rate):
0.5%per year
Performance ratio 0.79
5, Loan term: 25years Loan rate:
7.5%per year
Battery efficiency No battery
6, Federal income tax rate: 28%
state income tax rate:7%
Levelized COE
(nominal)
7.56 ¢/kWh
7, Investment tax credit: federal
30% state 0%
Levelized COE (real) 5.98 ¢/kWh
8, Electric load: 7,646,295 kwh/year Electricity cost without
system
$1,188,008.00
Electricity cost with
system
$1,138,912.00
Net savings with
system
$49,097.00
Net present value $162,954
Payback period 8.9 years
Net capital cost $508,966
Equity $0
Debt $508,966
7. Energy types in
SAM
SAM inputs Input example Output Value
Solar (Thermal)
Residential
1, location and resource
2, Module, temperature correction
3, inverter
4, system design: string
configuration, tracking and
orientation( fixed, 1-axis, 2-axis)
5, shading and snow
6, losses
7, life time(degradation rate)
8, battery storage
9, system costs (direct capital cost,
indirect capital cost, operation and
maintenance cost)
10, financial parameters
11, incentives
12, electricity rates
13, electricity load
1. Los Angeles Intl arpt (weather
location)
Annual energy
Saved
2,526 kWh
2. Energy usage (family of 4; 2
stories): 12,910kWh/year
Capacity factor 8,4%
3. Difuse Sky Model:Isotropic
Irradiance:Beam and Difuse
Levelized COE
(nominal)
33.55 ¢/kWh
4. System Capacity (hot water draw):
73,000kg/year
Levelized COE (real) 25.65 ¢/kWh
5. Life time( degradation rate):
0.5%per year
Electricity cost
without system
$3,981
6. Loan term: 20 years Loan rate:
7%/ year
Electricity cost with
system
$3,199
7. Federal income tax rate: 28%
state income tax rate: 7%
Net savings with
system
$782
8. Investment tax credit: federal 30% Net present value $1,671
9. Electric load: 9,352 kwh/year Payback period 10,8
Net capital cost $8,060
Equity $1,612
Debt $6,448
8. Energy types in
SAM
SAM inputs Input example Output Value
Geothermal
(Hydrothermal) for
the Utility
1, Ambient conditions
2, geothermal resource
(reservoir characterization,
reservoir parameters)
3, plant and equipment( plant
configuration, pump
parameters) 4, power block
5, system costs
6, financial parameters
7, time of delivery factors
8, incentives
9, depreciation
1. Weather Location: Los Angeles Intl arpt First Year Energy 135,403,856
kWh
2. Resource: Hydrothermal Capacity Factor 79.40%
3. Total potential: 210MW / Temp 200C PPA price (Year 1) 9.31 ¢/kWh
4. Plant Configuration: 15,000kW / 3 wells PPA price
escalation
1.00%
5, Loan term: 18 years Loan rate: 7%per
year
Levelized PPA price
(nominal)
10.11 ¢/kWh
6, Federal income tax rate: 35% state
income tax rate:7%
Levelized COE
(nominal)
9.54 ¢/kWh
7, Investment tax credit: federal 30%
state 0%
Net present value $7,585,762
Internal rate of
return (IRR)
11%
Year IRR is
achieved
20
Net capital cost $73,048,976
Equity $34,354,316
Size of debt $38,694,664
9. Energy types in
SAM
SAM inputs Input example Output Value
Geothermal
(Enhanced
System) for the
Utility
1, Ambient conditions
2, geothermal resource (reservoir
characterization, reservoir
parameters)
3, plant and equipment( plant
configuration, pump parameters)
4, power block
5, system costs
6, financial parameters
7, time of delivery factors
8, incentives
9, depreciation
1. Weather Location: Los Angeles Intl arpt
t
First Year Energy 151,435,664
kWh
2. Resource: Enhanced Geothermal
System (EGS)
Capacity Factor 101.00%
3. Total potential: 210MW / Temp 200C PPA price (Year 1) 7.42 ¢/kWh
4. Plant Configuration: 15,000kW / 3 wells PPA price escalation 1.00%
5, Loan term: 18 years Loan rate:
7%per year
Levelized PPA price
(nominal)
8.03 ¢/kWh
6, Federal income tax rate: 35% state
income tax rate:7%
Levelized COE
(nominal)
7.68 ¢/kWh
7, Investment tax credit: federal 30%
state 0%
Net present value $5,191,232
Internal rate of return
(IRR)
11%
Year IRR is achieved 20
Net capital cost $60,697,008
Equity $28,286,626
Size of debt $32,410,382
10. Energy types in SAM SAM inputs Input example Output Value
Wind
Residential
1, wind resource
2, wind turbine
3, wind farm (system sizing, layout)
4, system costs
5, life time
6, financial parameters
7, incentives
8, electricity rates
9, electric load
1, Southern CA—Rolling hills Annual energy 6,412 kWh
2, single wind turbine: Skystream 2.4 Capacity factor 30.5%
3, Hub height: 15m Levelized COE
(nominal)
23.97 ¢/kWh
4, system nameplate capacity: 2.4kw Levelized COE (real) 18.96 ¢/kWh
5, system costs: $6940/kw Electricity cost without
system
$1,092
6, lifetime: degradation rate5% per year Electricity cost with
system
$322
7, Loan term: 25years Loan rate: 7.5%per year Net savings with system $769
8, federal income tax rate: 28% state: 7% Net present value -$5,955
9, investment tax credit: Federal 30% Payback period 21.1 years
10, Electricity rate: flat buy 0.12$/kwh Net capital cost $16,656
11, electric load: 9097kwh per year Equity $6,662
Debt $9,994
11. Biomass
Commercial
1, location and ambient conditions
2, feedstock (different kinds of feedstocks and
their percentage
3, plant specs
4, emissions (electricity)
5, system costs
6, feedstock costs
7, life time(degradation rate per year)
8, financial parameters
9, incentives
10, electricity rate
11, electric load
1, Los Angeles Intl arpt Annual energy 69,606,800
kWh
2, Total obtainable biomass resource: 64000dry
tons/year
Annual biomass usage 64,022 dry
tons/yr
3, Average heating value: 7668btu/dry lb Capacity factor 81.9%
4, system costs: 3755$/kw Feedstock costs: 54$
per dry ton
Levelized COE
(nominal)
9.07 ¢/kWh
5, Lifetime: degradation rate 0 Levelized COE (real) 7.13 ¢/kWh
6, Federal income tax rate: 30% state income tax
rate: 7%
Electricity cost without
system
$1,986,188
7, Loan term: 25years Loan rate: 7.5%per year Electricity cost with
system
-$1,239,210
8, investment tax credit: federal 30% Net savings with
system
$3,225,398
Net present value -$39,130,692
Payback period NaN
Net capital cost $36,456,984
Equity $18,228,492
Debt $18,228,492