1) The Philippines experienced slower economic growth and productivity gains compared to its neighbors from 1960-2008. While reforms opened the economy, growth lagged due to low investment and a reliance on consumption fueled by remittances.
2) Weak revenue generation and fiscal deficits have constrained public spending and infrastructure investment. Tax revenues remain low due to loopholes and inefficient collection.
3) Low public spending on education and health have led to insufficient social services and human capital development, hindering inclusive growth.
1. Country Partnership Strategy: Philippines, 2011–2016
ECONOMIC ANALYSIS (SUMMARY)1
A. Recent Development and Long–term Growth Trends
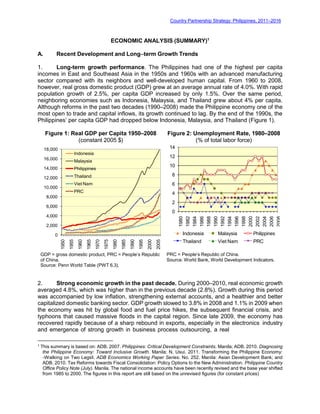
1. Long-term growth performance. The Philippines had one of the highest per capita
incomes in East and Southeast Asia in the 1950s and 1960s with an advanced manufacturing
sector compared with its neighbors and well-developed human capital. From 1960 to 2008,
however, real gross domestic product (GDP) grew at an average annual rate of 4.0%. With rapid
population growth of 2.5%, per capita GDP increased by only 1.5%. Over the same period,
neighboring economies such as Indonesia, Malaysia, and Thailand grew about 4% per capita.
Although reforms in the past two decades (1990–2008) made the Philippine economy one of the
most open to trade and capital inflows, its growth continued to lag. By the end of the 1990s, the
Philippines’ per capita GDP had dropped below Indonesia, Malaysia, and Thailand (Figure 1).
Figure 1: Real GDP per Capita 1950–2008
(constant 2005 $)
18,000
16,000
14,000
12,000
10,000
8,000
6,000
4,000
2,000
0
Figure 2: Unemployment Rate, 1980–2008
(% of total labor force)
14
12
10
8
6
4
2
0
Indonesia Malaysia Philippines
Thailand Viet Nam PRC
GDP = gross domestic product, PRC = People’s Republic
of China.
Source: Penn World Table (PWT 6.3).
PRC = People’s Republic of China.
Source: World Bank, World Development Indicators.
2. Strong economic growth in the past decade. During 2000–2010, real economic growth
averaged 4.8%, which was higher than in the previous decade (2.8%). Growth during this period
was accompanied by low inflation, strengthening external accounts, and a healthier and better
capitalized domestic banking sector. GDP growth slowed to 3.8% in 2008 and 1.1% in 2009 when
the economy was hit by global food and fuel price hikes, the subsequent financial crisis, and
typhoons that caused massive floods in the capital region. Since late 2009, the economy has
recovered rapidly because of a sharp rebound in exports, especially in the electronics industry
and emergence of strong growth in business process outsourcing, a real
1
This summary is based on: ADB. 2007. Philippines: Critical Development Constraints. Manila; ADB. 2010. Diagnosing
the Philippine Economy: Toward Inclusive Growth. Manila; N. Usui. 2011. Transforming the Philippine Economy:
―Walking on Two Legs‖. ADB Economics Working Paper Series. No. 252. Manila: Asian Development Bank; and
ADB. 2010. Tax Reforms towards Fiscal Consolidation: Policy Options to the New Administration. Philippine Country
Office Policy Note (July). Manila. The national income accounts have been recently revised and the base year shifted
from 1985 to 2000. The figures in this report are still based on the unrevised figures (for constant prices)
1950
1955
1960
1965
1970
1975
1980
1985
1990
1995
2000
2005
1980
1982
1984
1986
1988
1990
1992
1994
1996
1998
2000
2002
2004
2006
2008
2.
3. 3
Table 1: Structural Change, 1980–2007
Output (% of GDP) Employment (% of total employment)
( ) = negative, GDP = gross domestic product.
Sources: World Bank, World Development Indicators, and International Labor Organization, LABORSTA.
Figure 3: Labor Productivity, 1980–2007
(constant 2000 $)
Economy-Wide Labor Productivity Labor Productivity by Sector
14,000
12,000
10,000
8,000
6,000
4,000
2,000
0
12,000
10,000
8,000
6,000
4,000
2,000
0
Indonesia Malaysia
Philippines Thailand
Agriculture Industry
Services Manufacturing
Source: ADB. 2010. Transforming the Philippine Economy. Philippine Country Office Policy Note (October). Manila.
3. Slow growth of labor productivity. Compared with ASEAN-4 economies, progress in
economy-wide labor productivity in the Philippines has been weak. During 1980–2007, aggregate
labor productivity increased by only 10% (the annual average growth rate was 0.4%), while labor
productivity in Indonesia, Malaysia, and Thailand more than doubled (Figure 3). In the Philippines,
productivity for all sectors (agriculture, industry, and services) has stagnated over 3 decades.
Industry and agriculture contributed negatively to aggregate productivity growth, and only a minor
contribution was made by services. The country’s overall productivity grew only slightly through a
labor shift from agriculture to services. Workers have continued to move into the services sector,
where self-employment is common and wages are more flexible. As a result,
Sector Indonesia Malaysia
1980 2007 Change 1980 2007 Change
Agriculture 24.0 13.7 (10.3) 22.6 10.2 (12.4)
Industry 41.7 46.8 5.1 41.0 47.7 6.7
Manufacturing 13.0 27.1 14.1 21.6 28.0 6.4
Services 34.3 39.5 5.1 36.3 42.0 5.7
Philippines Thailand
1980 2007 Change 1980 2007 Change
Agriculture 25.1 14.2 (10.9) 23.2 10.7 (12.6)
Industry 38.8 31.6 (7.2) 28.7 44.7 16.0
Manufacturing 25.7 22.0 (3.8) 21.5 35.6 14.1
Services 36.1 54.2 18.1 48.1 44.6 (3.4)
Sector
Indonesia Malaysia
1980 2007 Change 1980 2007 Change
Agriculture 56.4 41.2 (15.2) 37.2 14.8 (22.4)
Industry 13.1 18.8 5.7 24.1 28.5 4.4
Manufacturing 9.0 12.4 3.4 16.1 18.8 2.7
Services 30.5 40.0 9.5 38.7 56.7 18.0
Philippines Thailand
1980 2007 Change 1980 2007 Change
Agriculture 51.8 36.1 (15.7) 70.8 41.7 (29.1)
Industry 15.4 15.1 (0.3) 10.3 20.7 10.4
Manufacturing 10.8 9.1 (1.7) 7.9 15.1 7.1
Services 32.8 48.8 16.0 18.9 37.6 18.7
1980
1983
1986
1989
1992
1995
1998
2001
2004
2007
1980
1983
1986
1989
1992
1995
1998
2001
2004
2007
4. 4
more jobs were created in the low-skill, low-wage category.6
4. Remittance-based consumption and weak investment. Supported by remittance
inflows, consumption has been the main driver of aggregate demand in the Philippines. Private
consumption, accounting for about three-fourths of GDP, has been financed in part by soaring
remittances from Filipino workers abroad (10% of GDP in 2010). Reflecting the structural changes
in favor of services, which are less capital-intensive and more labor-intensive, the country’s share
of fixed investment in GDP decreased from a high of 25% in 1997 to 14%–15% in 2005–2009,
contrasting with the recovery in investments in its neighboring countries after the Asian financial
crisis (Figure 4).
5. Revisiting the growth strategy.
To attain more inclusive economic growth,
the Philippines may have to revisit its
strategies in lagging areas of the
economy.7
The chronic problems of the
economy—high unemployment, slow
poverty reduction, and stagnant
investment— reflect the slow
industrialization process. The economy's
real growth potential remains untapped and
the slow pace of employment generation
despite growth hinders inclusiveness. The
Philippines’ biggest need is to create
domestic jobs for the growing working-age
population.
Figure 4: Gross Fixed Capital Formation,
1980–2008 (% of GDP)
50
40
30
20
10
0
PRC Republic of Korea
Indonesia Malaysia
Philippines Thailand
Viet Nam
GDP = gross domestic product, PRC = People’s Republic of
China.
Source: World Bank, World Development Indicators.
B. Key Constraints to Inclusive Growth
10. Weak revenue generation and public expenditure management. Persistent fiscal
imbalances and a lack of sustainable fiscal management have severely constrained growth for a
long period. Fiscal deficits result from weaknesses in tax revenue mobilization and poor public
expenditure and financial management. After reaching a peak of 17% of GDP in 1997, total tax
revenues declined steadily to below 13% in 2002 and 2003, contributing to a fiscal deficit of 5.3%
of GDP in 2003. Fiscal measures introduced in 2005, supported by development partners,
including ADB, broadened the value-added tax (VAT) base and increased the VAT rate from
6
H. H. Son. 2010. Growth, Inequality, and the Labor Market: The Philippines. In J. Zhuang, ed. Poverty, Inequality,
and Inclusive Growth in Asia: Measurement, Policy Issues, and Country Studies. Manila: Asian Development Bank.
7
N. Usui. 2011. Transforming the Philippine Economy: ―Walking on Two Legs‖. ADB Economics Working Paper
Series. No. 252. Manila: Asian Development Bank; A. M. Bocchi. 2008. Rising Growth, Declining Investment: The
Puzzle of the Philippines. Breaking the "Low-Capital Stock" Equilibrium. Washington, D.C; and World Bank. 2011.
Philippine Discussion Notes: Challenges and Options for 2010 and Beyond. Washington, D.C.
1980
1982
1984
1986
1988
1990
1992
1994
1996
1998
2000
2002
2004
2006
2008
5. 5
10% to 12% and the corporate income tax rate from 32% to 35%.8
As a result, the tax-to-GDP
ratio increased to 14.3% in 2006, with the budget deficit declining to 1.1% of GDP. However, fiscal
pressure has been growing since 2009. While stimulus spending and post-calamity restructuring
costs contributed to the larger deficit, the country's weak revenue mobilization capacity has
exacerbated the problem. The combination of accelerating spending and weak revenue collection
drove the fiscal deficit to 3.9% of GDP and the debt-to-GDP ratio to 57.3% in 2009. Tax revenues
fell to 12.8% of GDP in 2009 (Figure 5), the lowest since the 2005 and 2006 tax reforms. It was
also the lowest among neighboring members of the Association of Southeast Asian Nations.
Figure 5: Tax Revenue Trends, 1997–2009
(% of GDP)
20
15
10
5
0.8
0.7
0.6
0.5
0.4
0.3
0.2
0.1
0.0
Figure 6: Tax Productivities
0
1997 1999 2001 2003 2005 2007 2009
CIT PIT VAT Excise tax Others
CIT = corporate income tax, GDP = gross domestic product, PIT = personal income tax, PRC = People’s Republic of
China, VAT = value-added tax.
Source: ADB. 2010. Tax Reforms towards Fiscal Consolidation. Philippine Country Office Policy Note (July). Manila.
11. Low tax productivity.9
The Philippines’ tax productivities, in particular for VAT and
corporate income tax, are far below the region's averages (Figure 6). The low productivities signal
the presence of significant tax loopholes and weak tax administration. From 1997 to 2008, the tax
collection fell about 2.9 percentage points, with about two-thirds accounted for by the decline in
excise tax revenues (on tobacco, alcoholic products, and gasoline), mainly because of the lack
of inflation adjustments. Personal income tax compliance is low and taxing self-employed
professionals is difficult. Tax incentives for investors distort economic activity by
8
The new tax legislation included a sunset clause whereby the corporate income tax rate would be cut to 30% starting
1 January 2009. The rationalization of fiscal incentives that was meant to compensate for the revenue loss did not
take place. World Bank. 2011. Philippine Discussion Notes: Challenges and Options for 2010 and Beyond.
Washington, D.C.
9
Tax productivity is a conventional index to measure how effectively tax authorities produce revenues from available
tax bases. For each tax, the productivity is measured as the ratio of the tax revenue to GDP divided by the tax rate,
i.e., (tax revenue/GDP)/(tax rate). It can be regarded as a ratio of actual tax revenue to the hypothetical tax revenue
(GDP*tax rate), which reflects the extent to which existing revenue generating capacity has been exploited by tax
collection authorities. ADB. 2010. Tax Reforms towards Fiscal Consolidation: Policy Options to the New
Administration. Philippine Country Office Policy Note (July). Manila.
0.49
0.20
0.18
0.11
VAT CIT PIT
East
Asia
and
the
Pacific
(2006)
PRC
(2006)
Republic
of
Korea
(2007)
Malaysia
(2006)
Philippines
(2009)
Thailand
(2007)
Viet
Nam
(2007)
6. 6
imposing high effective tax rates on companies that are not eligible to receive the incentives.10
The local governments’ lack of revenue generation capacity is also a concern.
12. Shortfall in provision of basic infrastructure and social services. The country’s
lagging outcomes both in physical and human capital accumulation can be explained mainly by
shortfalls in the size of public spending rather than shortfalls in the quality or efficiency of public
spending.11
Because of the tight fiscal position, the scope for increased physical and human
capital accumulation through public spending has been limited. As a result, the provision of these
services has been inadequate. Government capital expenditure was equivalent to 2.7% of GDP
(2002–2008 average), lower than in neighboring countries (Table 2).12
There are also public
spending gaps in key social sectors (Table 3). Public spending on education averaged 2.5% of
GDP compared with 4.0% of GDP in other Asian countries in 2002–2007. In 2006, overall
government spending for health was even lower at 1.3% of GDP. The impact of public investments
can get further reduced because of inefficient spending programs.13
Low and inefficient public
spending on social services results in insufficient and unequal access to opportunities.14
Table 2: Central Government Capital Expenditures and Net Lending
(average annual percent of GDP)
1996–2000 2002–2008
Philippines 3.6 2.7
Malaysia 6.0 7.3
Thailand 5.4 3.5
Viet Nam 6.9 9.2
Sample Mean 6.1 6.6
GDP = gross domestic product.
Source: World Bank. 2011. Philippine Discussion Notes: Challenges and
Options for 2010 and Beyond. Washington, D.C.
Table 3: Government Spending on Education and Health
(% of GDP)
Education Health
Country 1990–1995a
2002–2007a
2000 2006
Philippines 3.0 2.5 1.6 1.3
Indonesia n.a. 3.5 1.7 1.9
Malaysia 4.4 4.6 1.9 2.3
Thailand 3.2 4.3 1.6 2.1
Viet Nam 2.9 n.a. 1.7 1.9
Sample Mean 3.5 4.1 1.7 2.0
GDP = gross domestic product, n.a. = not available.
Source: World Bank. 2011. Philippine Discussion Notes: Challenges and
Options for 2010 and Beyond. Washington, D.C. a
latest year in period
10
An ADB study found that tax incentives are mostly "redundant", which means that firms that were granted the tax
incentives would have invested irrespective of receiving the incentives. ADB. 2010. Philippines: Strengthening
Investment Climate and Competitiveness. TA report prepared under ADB. 2007. Technical Assistance to the
Republic of the Philippines for Strengthening Investment Climate and Competitiveness. Manila.
11
A World Bank study examined the main causes of the country’s underperformance in education, health, and transport.
It found that, while spending efficiency is a problem in transport, shortfalls in the size of public spending is the key
cause of the underperformance in all these sectors. World Bank. 2010. Philippines: Public Expenditure Review:
Strengthening Public Finance for More Inclusive Growth. Unpublished.
12
Footnote 8, p. 5.
13
S. Jha and A. Mehta. 2010. Inclusiveness through Food Security: The Philippines' National Food Program. In J.
Zhuang, ed. Poverty, Inequality, and Inclusive Growth in Asia: Measurement, Policy Issues, and Country Studies.
Manila: Asian Development Bank.
14 Education Sector Assessment Summary, and Health and Social Protection Sector Assessment Summary (accessible
from the list of linked documents in Appendix 2