More Related Content
Similar to Blue Chip Stock Analysis
Similar to Blue Chip Stock Analysis (18)
Blue Chip Stock Analysis
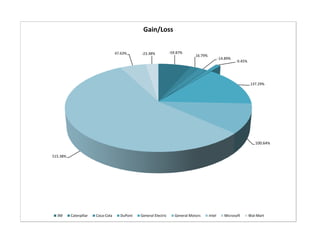
- 1. Gain/Loss
47.63% -23.38% -59.87%
16.79%
-14.89%
-9.45%
137.29%
100.64%
515.38%
3M Caterpillar Coca-Cola DuPont General Electric General Motors Intel Microsoft Wal-Mart
- 2. Blue Chip Stock Club
INVESTMENT
Initial Price Currnet Price
Stock Symbol Date Acquired Shares Per Share Initial Cost Per Share
3M MMM 6/12/2009 394 $ 79.75 $ 31,421.50 $ 32.00
Caterpillar CAT 3/15/2009 750 $ 34.25 $ 25,687.50 $ 40.00
Coca-Cola KO 8/1/2009 975 $ 58.75 $ 57,281.25 $ 50.00
DuPont DD 9/12/2008 850 $ 33.13 $ 28,160.50 $ 30.00
General Electric GE 12/8/2008 525 $ 29.50 $ 15,487.50 $ 70.00
General Motors GM 10/5/2008 810 $ 37.38 $ 30,277.80 $ 75.00
Intel INTC 10/3/2009 875 $ 13.00 $ 11,375.00 $ 80.00
Microsoft MSFT 1/15/2009 250 $ 64.35 $ 16,087.50 $ 95.00
Wal-Mart WMT 7/9/2009 925 $ 32.63 $ 30,182.75 $ 25.00
Total 6,354 $ 382.74 $ 245,961.30 $ 497.00
Average 706 $ 42.53 $ 27,329.03 $ 55.22
Highest 975 $ 79.75 $ 57,281.25 $ 95.00
Lowest 250 $ 13.00 $ 11,375.00 $ 25.00
- 3. ub
Percent
Current Value Gain/Loss Gain/Loss
$ 12,608.00 $ (18,813.50) -59.87%
$ 30,000.00 $ 4,312.50 16.79%
$ 48,750.00 $ (8,531.25) -14.89%
$ 25,500.00 $ (2,660.50) -9.45%
$ 36,750.00 $ 21,262.50 137.29%
$ 60,750.00 $ 30,472.20 100.64%
$ 70,000.00 $ 58,625.00 515.38%
$ 23,750.00 $ 7,662.50 47.63%
$ 23,125.00 $ (7,057.75) -23.38%
$ 331,233.00 $ 85,271.70 710.13%
$ 36,803.67 $ 9,474.63 78.90%
$ 70,000.00 $ 58,625.00 515.38%
$ 12,608.00 $ (18,813.50) -59.87%