Investment Strategies in Presidential Election Years
•Download as PPTX, PDF•
0 likes•205 views

Trying to make investment decisions based upon the outcome of presidential elections is unlikely to result in reliable excess returns for investors. There is a strong case for investors to rely on patience and portfolio structure, rather than trying to outguess the market, in order to pursue investment returns.

Recommended
Recommended
More Related Content
Viewers also liked
Viewers also liked (20)
Recently uploaded
Recently uploaded (20)
Investment Strategies in Presidential Election Years
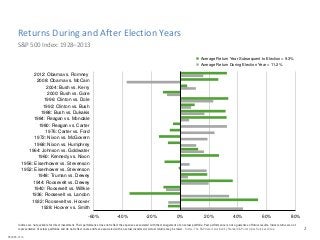
- 1. Returns During and After Election Years 2 S&P 500 Index: 1928–2013 Indices are not available for direct investment. Their performance does not reflect the expenses associated with the management of an actual portfolio. Past performance is not a guarantee of future results. Index returns are not representative of actual portfolios and do not reflect costs and fees associated with an actual investment. Actual returns may be lower. Source: The S&P data is provided by Standard & Poor's Index Services Group. -60% -40% -20% 0% 20% 40% 60% 80% 1928: Hoover vs. Smith 1932: Roosevelt vs. Hoover 1936: Roosevelt vs. Landon 1940: Roosevelt vs. Willkie 1944: Roosevelt vs. Dewey 1948: Truman vs. Dewey 1952: Eisenhower vs. Stevenson 1956: Eisenhower vs. Stevenson 1960: Kennedy vs. Nixon 1964: Johnson vs. Goldwater 1968: Nixon vs. Humphrey 1972: Nixon vs. McGovern 1976: Carter vs. Ford 1980: Reagan vs. Carter 1984: Reagan vs. Mondale 1988: Bush vs. Dukakis 1992: Clinton vs. Bush 1996: Clinton vs. Dole 2000: Bush vs. Gore 2004: Bush vs. Kerry 2008: Obama vs. McCain 2012: Obama vs. Romney Average Return Year Subsequent to Election = 9.3% Average Return During Election Year = 11.2% #50085-0116
- 2. Efficient Markets Hypothesis 2 Eugene F. Fama The Hypothesis States: • Current prices incorporate all available information and expectations. • Current prices are the best approximation of intrinsic value. • Price changes are due to unforeseen events. • “Mispricings” can occur but not in predictable patterns that can lead to consistent outperformance. The Hypothesis Does not State: • All investors are rational. • Prices are always right. • Prices should be stable. • Professional money managers can’t earn higher than market returns. Eugene F. Fama, “Efficient Capital Markets: A Review of Theory and Empirical Work,” Journal of Finance 25, no. 2 (May 1970): 383-417. Eugene F. Fama, “Foundations of Finance,” Journal of Finance 32, no. 3 (June 1977): 961-64.
- 3. Market Returns and Election Years 3 It is difficult to identify systematic return patterns in elections years. On average, market returns have been positive both in election years and the subsequent year. Market expectations associated with election outcomes are embedded in security prices. Past performance is not a guarantee of future results. Sources: The S&P data is provided by Standard & Poor's Index Services Group; MSCI data copyright MSCI 2016, all rights reserved; Bloomberg Barclays Capital data provided by Bloomberg.
- 4. The Capital Markets Have Rewarded Long-Term Investors 4 Monthly growth of wealth ($1), 1926–2015 In US dollars. Indices are not available for direct investment. Their performance does not reflect the expenses associated with the management of an actual portfolio. Past performance is no guarantee of future results. US Small Cap Index is the CRSP 6–10 Index; US Large Cap Index is the S&P 500 Index; Long-Term Government Bonds Index is 20-year US government bonds; Treasury Bills are One-Month US Treasury bills; Inflation is the Consumer Price Index. CRSP data provided by the Center for Research in Security Prices, The S&P data is provided by Standard & Poor’s Index Services Group. Bonds, T-bills, and inflation data provided by Morningstar. $16,743 US Small Cap Index $5,386 US Large Cap Index $132 Long-Term Government Bonds Index $21 Treasury Bills $13 Inflation (CPI) $0 $1 $10 $100 $1,000 $10,000 $100,000 1926 1936 1946 1956 1966 1976 1986 1996 2006 2015
- 5. Markets Have Rewarded Long-Term Investors under a Variety of Presidents 5 Growth of a Dollar Invested in the S&P 500: January 1926–June 2016 Past performance is not a guarantee of future results. Indices are not available for direct investment; therefore, their performance does not reflect the expenses associated with the management of an actual portfolio. The S&P data is provided by Standard & Poor’s Index Services Group.
- 6. Reacting Can Hurt Performance 6 Performance of the S&P 500 Index, 1970-2015 In US dollars. Indices are not available for direct investment. Their performance does not reflect the expenses associated with the management of an actual portfolio. Past performance is not a guarantee of future results. Performance data for January 1970–August 2008 provided by CRSP; performance data for September 2008–December 2015 provided by Bloomberg. S&P data provided by Standard & Poor’s Index Services Group. Bonds, T-bills, and inflation data provided by Morningstar. The information shown here is derived from such indices, bonds, T-bills, and inflation data. Missing only a few days of strong returns can drastically impact overall performance. Total Period Missed 1 Best Day Missed 5 Best Single Days Missed 15 Best Single Days Missed 25 Best Single Days One- Month US T-Bills Annualized Compound Return 10.27% 10.01% 9.24% 7.95% 6.87% 4.94% $89,678 $80,370 $58,214 $33,710 $21,224 $9,195 Growthof$1,000