1. The Global Market Review
Commentary
Greg Meier
Vice President
Investment Strategist
US Capital Markets
Research & Strategy
Allianz Global Investors
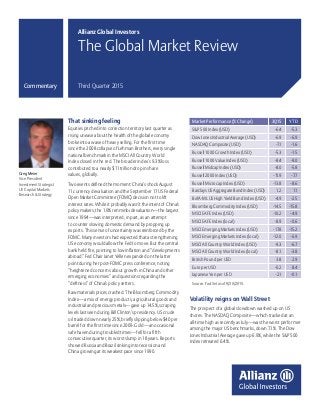
That sinking feeling
Equities pitched into correction territory last quarter as
rising unease about the health of the global economy
broke into a wave of heavy selling. For the first time
since the 2008 collapse of Lehman Brothers, every single
national benchmark in the MSCI All Country World
Index closed in the red. The broader index’s 9.3% loss
contributed to a nearly $11 trillion drop in share
values, globally.
Two events defined the moment: China’s shock August
11 currency devaluation and the September 17 US Federal
Open Market Committee (FOMC) decision not to lift
interest rates. While it probably wasn’t the intent of China’s
policymakers, the 1.9% renminbi devaluation—the largest
since 1994—was interpreted, in part, as an attempt
to counter slowing domestic demand by propping up
exports. This sense of uncertainty was reinforced by the
FOMC. Many investors had expected that a strengthening
US economy would allow the Fed to move. But the central
bank held fire, pointing to low inflation and “developments
abroad.” Fed Chair Janet Yellen expanded on the latter
point during her post-FOMC press conference, noting
“heightened concerns about growth in China and other
emerging economies” and questions regarding the
“deftness” of China’s policy setters.
Raw materials prices crashed. The Bloomberg Commodity
Index—a mix of energy products, agricultural goods and
industrial and precious metals—gave up 14.5%, scraping
levels last seen during Bill Clinton’s presidency. US crude
oil traded down nearly 25%, briefly slipping below $40 per
barrel for the first time since 2009. Gold—an occasional
safe haven during troubled times—fell for a fifth
consecutive quarter, its worst slump in 18 years. Reports
showed Russia and Brazil sinking into recession and
China growing at its weakest pace since 1990.
Market Performance (% Change) 3Q15 YTD
S&P 500 Index (USD) -6.4 -5.3
Dow Jones Industrial Average (USD) -6.9 -6.9
NASDAQ Composite (USD) -7.1 -1.6
Russell 1000 Growth Index (USD) -5.3 -1.5
Russell 1000 Value Index (USD) -8.4 -9.0
Russell Midcap Index (USD) -8.0 -5.8
Russell 2000 Index (USD) -11.9 -7.7
Russell Microcap Index (USD) -13.8 -8.6
Barclays US Aggregate Bond Index (USD) 1.2 1.1
BofA-ML US High Yield Bond Index (USD) -4.9 -2.5
Bloomberg Commodity Index (USD) -14.5 -15.8
MSCI EAFE Index (USD) -10.2 -4.9
MSCI EAFE Index (local) -8.9 -0.6
MSCI Emerging Markets Index (USD) -17.8 -15.2
MSCI Emerging Markets Index (local) -12.0 -6.9
MSCI All Country World Index (USD) -9.3 -6.7
MSCI All Country World Index (local) -8.1 -3.8
British Pound per USD 3.8 2.9
Euro per USD -0.2 8.4
Japanese Yen per USD -2.1 -0.1
Source: FactSet as of 9/30/2015.
Volatility reigns on Wall Street
The prospect of a global slowdown washed up on US
shores. The NASDAQ Composite—which tracked at an
all-time high as recently as July—was the worst performer
among the major US benchmarks, down 7.1%. The Dow
Jones Industrial Average gave up 6.9%, while the S&P 500
Index retreated 6.4%.
Third Quarter 2015
2. The Global Market Review | Third Quarter 2015
Volatility surged. The CBOE VIX Index—Wall Street’s so-called
“fear gauge”—jumped 34%, cresting at levels associated with
previous crises. On August 24, during six harrowing, circuit-smashing
minutes of trading, the Dow plunged 1,089 points, it’s largest-ever
intraday drop.
The yield curve flattened, as safe-haven demand crushed down long
rates, while Fed liftoff angst drove short rates northward. The yield on
2-year Treasury notes—a corner of the market particularly sensitive
to Fed policy—briefly reached 0.81%, a four-year high. The 10-year
Treasury bond closed at 2.04%, down 31 basis points for the quarter.
The din of loud and conflicting public opinions from within the
FOMC made it difficult to cut through the noise and focus on
economic fundamentals. But some improvements were obvious: US
companies added another 663,000 jobs between June and August,
while unemployment fell to 5.1%—well below its 5.8% long-term
average. The housing recovery gathered steam, with construction
starts, resales and builder confidence all reaching multiyear highs.
After a weak start to the year, the broader economy performed
strongly during the second quarter, expanding at a 3.9% annualized
pace, with noted contributions from consumers, businesses,
government and trade.
Yet inflation is low: The Personal Consumption Expenditures Index, the
Fed’s preferred gauge, rose just 0.3% (year-over-year) in August. And
prices might remain tepid—at least in the very near-term—due to the
renewed commodities sell-off and rapid appreciation in the US dollar.
Gains in the greenback—which hit a 12-year high in trade-weighted
terms last quarter—dampen the cost of imported goods, while
creating headwinds for US exporters and manufacturers.
Draghi’s inflation dilemna
The MSCI Europe Index sidestepped some of the damage affecting
other corners of the world, but it still posted an 8.9% quarterly decline,
its worst in four years. While political events continued to grab
headlines—with Spanish secessionists winning a regional vote and
Greece (again) narrowly averting a euro-zone exit—investors turned
their focus to economic news.
On the monetary front, while Fed officials pondered raising interest
rates, European Central Bank (ECB) President Mario Draghi moved
in the opposite direction, hinting at additional easing. Early reports
suggest that the European currency union sank back into deflation in
September, a direct challenge to the ECB mandate of price gains just
below a 2% annual rate. On September 3, while holding interest rates
steady at record low levels, Mr. Draghi announced “readiness”
to extend the ECB’s quantitative easing program beyond September
2016, if necessary.
Inflation has improved only marginally since the ECB launched its 60
billion euros per month easing program in March. Meanwhile, the
euro has strengthened, rising from a 12-year low of 1.05 per US dollar
in the first quarter to 1.12 at the close of the third quarter.
Beyond the disappointing inflation numbers, economic data were,
on balance, healthy. Output in the euro zone expanded at a 1.4%
annualized pace between April and June, the ninth consecutive
quarterly gain. Unemployment in July eased to 11.0%, the lowest level
in more than three years. The combination of falling fuel costs and
brighter job prospects helped lift retail trade confidence, which
neared a 5-year high in September.
Commodity prices fell to the lowest level since August 1999
60
120
180
240
1991 1995 1999 2003 2007 2011 2015
Index
87
Bloomberg Commodity Index
Source: Bloomberg as of 9/30/2015.
Euro-zone inflation remains well below the ECB’s 2% target
Source: Eurostat as of 8/31/2015.
The US jobless rate is approaching levels typically associated
with wage gains
Source: US Bureau of Economic Analysis and Oxford Economics as of 8/31/2015.
Percent
Unemployment Rate
NAIRU (Non-Accelerating Inflation Rate of Unemployment)
5.10
5.00
0
2
1980 1985 1990 1995 2000 2005 2010 2015
4
6
8
10
12
PercentChange(Annual)
Headline CPI
-1.0
0.0
1.0
2.0
3.0
4.0
0.10
201420122010200820062004200220001998
3. The Global Market Review | Third Quarter 2015
AllianzGlobalInvestorsU.S.LLC(“AllianzGIUS”)isanSEC
registered investment adviser that provides investment
management and advisory services primarily to sepa-
rate accounts of institutional clients and registered and
unregistered investment funds. AllianzGI US manages
client portfolios (either directly or through model deliv-
ery and wrap fee programs) applying traditional and
systematic processes across a variety of investment
strategies. AllianzGI US may also provide consulting and
research services in connection with asset allocation
and portfolio structure analytics. NFJ Investment Group
LLC (“NFJ”) is an SEC registered investment adviser and
wholly-owned subsidiary of AllianzGI US.
Past performance is not indicative of future per-
formance. This report is provided for informational
purposes only and should not be construed as a rec-
ommendation for the purchase or sale of any security
nor should it be construed as a recommendation of any
investment strategy. There is no guarantee that any
opinion, forecast, estimate or objective will be achieved.
References to indices, benchmarks or other measures
of relative performance are provided for your informa-
tion only. Unless otherwise noted, equity index perfor-
mance is calculated with gross dividends reinvested
and estimated tax withheld. Index calculations do not
reflect fees, brokerage commissions or other expenses
of investing. Investors may not make direct invest-
ments into any index. Index owners make no express
or implied warranties or representations and shall have
no liability whatsoever with respect to any of their data
contained herein.
MSCI has not approved, reviewed or produced this
report, makes no express or implied warranties or rep-
resentations and is not liable whatsoever for any data
in the report. You may not redistribute the MSCI data or
use it as a basis for other indices or investment products.
The material contains the current opinions of the author,
which are subject to change without notice. Statements
concerning financial market trends are based on current
market conditions, which will fluctuate. Forecasts are
inherently limited and should not be relied upon as an
indicator of future results. If presented, any reference to
a specific security, issuer or market sector is for illustra-
tive purposes only. Nothing contained in this presenta-
tion constitutes an offer to sell, or the solicitation of an
offer to buy or a recommendation to buy or sell any
security; nor shall anything in this presentation be con-
sidered an offer or solicitation to provide services in any
jurisdiction in which such offer or solicitation would be
unlawful.
AGI-2015-10-16-13542 | 01165
Down and out in Shanghai
The epicenter of China-related fears, Asian equities turned in the
world’s worst results. The region’s namesake MSCI index retreated
14.5%, its steepest drop since 2008. The Shanghai Composite Index
—a benchmark of primarily locally owned Chinese shares—posted
a 28.6% quarterly loss, closing on September 30 off more than 40%
from its June 12 record high.
China’s market rout confounded a barrage of questionable—and
ultimately futile—efforts to shore up a bubble that was partly
government-created. In the 12 months leading up to its peak, the
Shanghai Composite Index soared 152%, as China’s state-controlled
media encouraged investors to buy shares, associating gains, in part,
with the triumph of President Xi Jinping’s economic policies. The
bubble’s collapse was so ferocious that for a few days roughly 50% of
the market was halted from trading.
Deciphering what is happening in China’s real economy isn’t easy.
Official China GDP statistics, for instance, come out early, are rarely
revised and smell exaggerated. And there is increasing evidence of
an economic slowdown: According to private estimates, Chinese
manufacturing in September contracted at the fastest pace in more
than six years. In August, industrial profits fell 8.8%, the most on
record starting in 2011.
Thus far, China’s currency devaluation seems too small to significantly
lift exports—which sank more than 8% in July. But it could help
the renminbi qualify as an International Monetary Fund reserve
currency—a key priority for policymakers. However, with the
devaluation gates open, the People’s Republic may find it more
difficult to stem capital outflows, which topped out at almost
$400 billion in real terms in the 12 months to June 30.
The global market outlook
Given that the factors that impacted the third quarter have been
building for some time—particularly China’s situation and Fed liftoff
fears—the recent bout of volatility was not unexpected. And with
the Fed tilting toward tightening while central bankers in Europe and
Japan consider further easing, more volatility is possible. Importantly,
monetary policy should remain accommodative: The day after Fed
liftoff will mark the second-lowest US policy rate in history.
From an investment standpoint, we remain constructive on many
equity markets, companies and sectors, in part because there is little
return available to investors holding cash or bonds. And we believe—
despite evidence global growth is decelerating—cash can now be
deployed at better valuations and entry points.
“Rainbows always appear after rains” according to the People’s
Daily (July 5, 2015)
Index
3,197
2,000
2,500
3,000
3,500
4,000
4,500
5,000
5,500
Oct.2015
Jul.2015
Apr.2015
Jan.2015
Oct.2014
Jul.2015
Apr.2014
Jan.2014
Shanghai A Share Index
Source: FactSet as of 9/30/2015.