SlideShare a Scribd company logo
1 of 5
1q15 Household Net Worth
Householdnetworthhityetanotherall-timehighin1q15 bothfrom a level perspective andis
approachinglongtermtrend:
As a functionof GDP,householdnetworthbroke outtoa new all-time high:
0
10000
20000
30000
40000
50000
60000
70000
80000
90000
Household Net Worth
Household Net Wort h
Wagesalso hitanotherall-time high,fromalevel perspective:
Wages,however,have almostneverbeenlowerasa percentage of GDP:
3.0x
3.2x
3.4x
3.6x
3.8x
4.0x
4.2x
4.4x
4.6x
4.8x
5.0x
Household Net Worth/GDP
HouseholdNetWorth/GDP
0
1,000,000,000,000
2,000,000,000,000
3,000,000,000,000
4,000,000,000,000
5,000,000,000,000
6,000,000,000,000
7,000,000,000,000
8,000,000,000,000
9,000,000,000,000
3/1/1947
8/1/1949
1/1/1952
6/1/1954
11/1/1956
4/1/1959
9/1/1961
2/1/1964
7/1/1966
12/1/1968
5/1/1971
10/1/1973
3/1/1976
8/1/1978
1/1/1981
6/1/1983
11/1/1985
4/1/1988
9/1/1990
2/1/1993
7/1/1995
12/1/1997
5/1/2000
10/1/2002
3/1/2005
8/1/2007
1/1/2010
6/1/2012
11/1/2014
Wages
Wages
Expressedasa functionof households,bothnetworthandwages alsoreachednew all-time highin
1q15:
As we can see below,however, networthcontinuestogrow ata far greaterrate than wagessuch that
the multiple betweennetworthandwageshasneverbeengreaterandhaseclipseditspre-recession
level:
0.4x
0.5x
0.5x
0.6x
0.6x
Wages/GDP
Wages/GDP
0
100,000
200,000
300,000
400,000
500,000
600,000
700,000
800,000
1q65
3q66
1q68
3q69
1q71
3q72
1q74
3q75
1q77
3q78
1q80
3q81
1q83
3q84
1q86
3q87
1q89
3q90
1q92
3q93
1q95
3q96
1q98
3q99
1q01
3q02
1q04
3q05
1q07
3q08
1q10
3q11
1q13
3q14
Net Worth and Wages/Household, Level Data
Net Worth/Household Wages/Household
The Federal Reserve hasneverworkedsohardtogenerate the wealthfoundthroughoutsociety:
The surge inhouseholdwealthhasnotgeneratedthe consumptionone wouldlikelyexpect:
6.0x
7.0x
8.0x
9.0x
10.0x
11.0x
12.0x 1q65
3q66
1q68
3q69
1q71
3q72
1q74
3q75
1q77
3q78
1q80
3q81
1q83
3q84
1q86
3q87
1q89
3q90
1q92
3q93
1q95
3q96
1q98
3q99
1q01
3q02
1q04
3q05
1q07
3q08
1q10
3q11
1q13
3q14
Net Worth/Wages
Net Worth/Wages
10.0x
20.0x
30.0x
40.0x
50.0x
60.0x
70.0x
80.0x
90.0x
Household Net Worth/Monetary Base
HouseholdNet Wort h/Monetary Base
14.0%
15.0%
16.0%
17.0%
18.0%
19.0%
20.0%
PersonalConsumption Expenditures as a Function
of Household Net Worth
Per so nal Con su mpt ion Expen ditu res asa Fu nction of Househo ld Net Wor th

More Related Content

More from Grant Toch

May 2015 Jobs Report Observations (Grant Toch)
May 2015 Jobs Report Observations (Grant Toch)May 2015 Jobs Report Observations (Grant Toch)
May 2015 Jobs Report Observations (Grant Toch)Grant Toch
 
April 2015 Personal Income Data
April 2015 Personal Income DataApril 2015 Personal Income Data
April 2015 Personal Income DataGrant Toch
 
Euro Area Lending Update (Grant Toch 5 30 2015)
Euro Area Lending Update (Grant Toch 5 30 2015)Euro Area Lending Update (Grant Toch 5 30 2015)
Euro Area Lending Update (Grant Toch 5 30 2015)Grant Toch
 
April 2015 Existing Home Sales (Grant Toch)
April 2015 Existing Home Sales (Grant Toch)April 2015 Existing Home Sales (Grant Toch)
April 2015 Existing Home Sales (Grant Toch)Grant Toch
 
April 2015 Single Family Permits and Starts
April 2015 Single Family Permits and StartsApril 2015 Single Family Permits and Starts
April 2015 Single Family Permits and StartsGrant Toch
 
March 2015 Consumer Credit (Grant Toch)
March 2015 Consumer Credit (Grant Toch)March 2015 Consumer Credit (Grant Toch)
March 2015 Consumer Credit (Grant Toch)Grant Toch
 
March 2015 US Trade Balance Data (Grant Toch)
March 2015 US Trade Balance Data (Grant Toch)March 2015 US Trade Balance Data (Grant Toch)
March 2015 US Trade Balance Data (Grant Toch)Grant Toch
 
March 2015 New Home Sales (Grant Toch)
March 2015 New Home Sales (Grant Toch)March 2015 New Home Sales (Grant Toch)
March 2015 New Home Sales (Grant Toch)Grant Toch
 

More from Grant Toch (8)

May 2015 Jobs Report Observations (Grant Toch)
May 2015 Jobs Report Observations (Grant Toch)May 2015 Jobs Report Observations (Grant Toch)
May 2015 Jobs Report Observations (Grant Toch)
 
April 2015 Personal Income Data
April 2015 Personal Income DataApril 2015 Personal Income Data
April 2015 Personal Income Data
 
Euro Area Lending Update (Grant Toch 5 30 2015)
Euro Area Lending Update (Grant Toch 5 30 2015)Euro Area Lending Update (Grant Toch 5 30 2015)
Euro Area Lending Update (Grant Toch 5 30 2015)
 
April 2015 Existing Home Sales (Grant Toch)
April 2015 Existing Home Sales (Grant Toch)April 2015 Existing Home Sales (Grant Toch)
April 2015 Existing Home Sales (Grant Toch)
 
April 2015 Single Family Permits and Starts
April 2015 Single Family Permits and StartsApril 2015 Single Family Permits and Starts
April 2015 Single Family Permits and Starts
 
March 2015 Consumer Credit (Grant Toch)
March 2015 Consumer Credit (Grant Toch)March 2015 Consumer Credit (Grant Toch)
March 2015 Consumer Credit (Grant Toch)
 
March 2015 US Trade Balance Data (Grant Toch)
March 2015 US Trade Balance Data (Grant Toch)March 2015 US Trade Balance Data (Grant Toch)
March 2015 US Trade Balance Data (Grant Toch)
 
March 2015 New Home Sales (Grant Toch)
March 2015 New Home Sales (Grant Toch)March 2015 New Home Sales (Grant Toch)
March 2015 New Home Sales (Grant Toch)
 

1q15 Household Net Worth (GT)

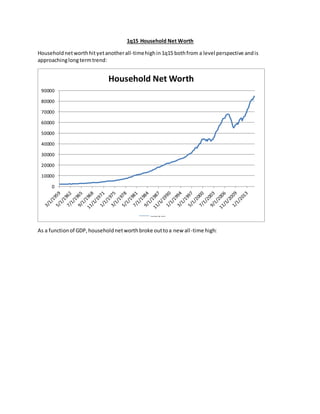
  • 1. 1q15 Household Net Worth Householdnetworthhityetanotherall-timehighin1q15 bothfrom a level perspective andis approachinglongtermtrend: As a functionof GDP,householdnetworthbroke outtoa new all-time high: 0 10000 20000 30000 40000 50000 60000 70000 80000 90000 Household Net Worth Household Net Wort h
  • 2. Wagesalso hitanotherall-time high,fromalevel perspective: Wages,however,have almostneverbeenlowerasa percentage of GDP: 3.0x 3.2x 3.4x 3.6x 3.8x 4.0x 4.2x 4.4x 4.6x 4.8x 5.0x Household Net Worth/GDP HouseholdNetWorth/GDP 0 1,000,000,000,000 2,000,000,000,000 3,000,000,000,000 4,000,000,000,000 5,000,000,000,000 6,000,000,000,000 7,000,000,000,000 8,000,000,000,000 9,000,000,000,000 3/1/1947 8/1/1949 1/1/1952 6/1/1954 11/1/1956 4/1/1959 9/1/1961 2/1/1964 7/1/1966 12/1/1968 5/1/1971 10/1/1973 3/1/1976 8/1/1978 1/1/1981 6/1/1983 11/1/1985 4/1/1988 9/1/1990 2/1/1993 7/1/1995 12/1/1997 5/1/2000 10/1/2002 3/1/2005 8/1/2007 1/1/2010 6/1/2012 11/1/2014 Wages Wages
  • 3. Expressedasa functionof households,bothnetworthandwages alsoreachednew all-time highin 1q15: As we can see below,however, networthcontinuestogrow ata far greaterrate than wagessuch that the multiple betweennetworthandwageshasneverbeengreaterandhaseclipseditspre-recession level: 0.4x 0.5x 0.5x 0.6x 0.6x Wages/GDP Wages/GDP 0 100,000 200,000 300,000 400,000 500,000 600,000 700,000 800,000 1q65 3q66 1q68 3q69 1q71 3q72 1q74 3q75 1q77 3q78 1q80 3q81 1q83 3q84 1q86 3q87 1q89 3q90 1q92 3q93 1q95 3q96 1q98 3q99 1q01 3q02 1q04 3q05 1q07 3q08 1q10 3q11 1q13 3q14 Net Worth and Wages/Household, Level Data Net Worth/Household Wages/Household
  • 4. The Federal Reserve hasneverworkedsohardtogenerate the wealthfoundthroughoutsociety: The surge inhouseholdwealthhasnotgeneratedthe consumptionone wouldlikelyexpect: 6.0x 7.0x 8.0x 9.0x 10.0x 11.0x 12.0x 1q65 3q66 1q68 3q69 1q71 3q72 1q74 3q75 1q77 3q78 1q80 3q81 1q83 3q84 1q86 3q87 1q89 3q90 1q92 3q93 1q95 3q96 1q98 3q99 1q01 3q02 1q04 3q05 1q07 3q08 1q10 3q11 1q13 3q14 Net Worth/Wages Net Worth/Wages 10.0x 20.0x 30.0x 40.0x 50.0x 60.0x 70.0x 80.0x 90.0x Household Net Worth/Monetary Base HouseholdNet Wort h/Monetary Base
  • 5. 14.0% 15.0% 16.0% 17.0% 18.0% 19.0% 20.0% PersonalConsumption Expenditures as a Function of Household Net Worth Per so nal Con su mpt ion Expen ditu res asa Fu nction of Househo ld Net Wor th