Long wave audio-slides-12-12-11-troubling_volume
•Download as PPTX, PDF•
1 like•952 views


Recommended
More Related Content
More from GordonTLong.com
More from GordonTLong.com (20)
Recently uploaded
Recently uploaded (20)
Long wave audio-slides-12-12-11-troubling_volume
- 1. This chart is from the December 2011 Macro Analytics & Technical Analysis Report December 12th, 2011 TROUBLING VOLUME & VOLATILITY Listen to the original podcast for this slide at www.GordonTLong.com/LONGWave The content of this slide should not be considered investment advice of any sort, nor should it be used to make investment decisions. Use of this slide is considered to be your explicit acceptance of the Disclosure Statement and the Terms of Use found on the last page of this document.
- 2. This chart is from the December 2011 Macro Analytics & Technical Analysis Report December 12th, 2011 TROUBLING VOLUME & VOLATILITY Listen to the original podcast for this slide at www.GordonTLong.com/LONGWave The content of this slide should not be considered investment advice of any sort, nor should it be used to make investment decisions. Use of this slide is considered to be your explicit acceptance of the Disclosure Statement and the Terms of Use found on the last page of this document.
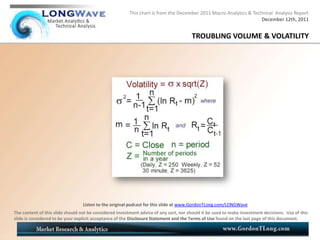
- 3. This chart is from the December 2011 Macro Analytics & Technical Analysis Report December 12th, 2011 TROUBLING VOLATILITY Listen to the original podcast for this slide at www.GordonTLong.com/LONGWave The content of this slide should not be considered investment advice of any sort, nor should it be used to make investment decisions. Use of this slide is considered to be your explicit acceptance of the Disclosure Statement and the Terms of Use found on the last page of this document.
- 4. This chart is from the December 2011 Macro Analytics & Technical Analysis Report December 12th, 2011 TROUBLING VOLATILITY Listen to the original podcast for this slide at www.GordonTLong.com/LONGWave The content of this slide should not be considered investment advice of any sort, nor should it be used to make investment decisions. Use of this slide is considered to be your explicit acceptance of the Disclosure Statement and the Terms of Use found on the last page of this document.
- 5. This chart is from the December 2011 Macro Analytics & Technical Analysis Report December 12th, 2011 TROUBLING VOLUME Listen to the original podcast for this slide at www.GordonTLong.com/LONGWave The content of this slide should not be considered investment advice of any sort, nor should it be used to make investment decisions. Use of this slide is considered to be your explicit acceptance of the Disclosure Statement and the Terms of Use found on the last page of this document.
- 6. This chart is from the December 2011 Macro Analytics & Technical Analysis Report December 12th, 2011 TROUBLING VOLUME, VOLATILITY PRECEDES ‘RISK-OFF’ Listen to the original podcast for this slide at www.GordonTLong.com/LONGWave The content of this slide should not be considered investment advice of any sort, nor should it be used to make investment decisions. Use of this slide is considered to be your explicit acceptance of the Disclosure Statement and the Terms of Use found on the last page of this document.
- 7. This chart is from the December 2011 Macro Analytics & Technical Analysis Report December 12th, 2011 WHAT IS THE SMART MONEY SIGNALLING? Listen to the original podcast for this slide at www.GordonTLong.com/LONGWave The content of this slide should not be considered investment advice of any sort, nor should it be used to make investment decisions. Use of this slide is considered to be your explicit acceptance of the Disclosure Statement and the Terms of Use found on the last page of this document.
- 8. This chart is from the December 2011 Macro Analytics & Technical Analysis Report December 12th, 2011 TROUBLING VOLUME & VOLATILITY Listen to the original podcast for this slide at www.GordonTLong.com/LONGWave The content of this slide should not be considered investment advice of any sort, nor should it be used to make investment decisions. Use of this slide is considered to be your explicit acceptance of the Disclosure Statement and the Terms of Use found on the last page of this document.
- 9. This chart is from the December 2011 Macro Analytics & Technical Analysis Report December 12th, 2011 TROUBLING VOLUME, VOLATILITY PRECEDES ‘RISK-OFF’ Listen to the original podcast for this slide at www.GordonTLong.com/LONGWave The content of this slide should not be considered investment advice of any sort, nor should it be used to make investment decisions. Use of this slide is considered to be your explicit acceptance of the Disclosure Statement and the Terms of Use found on the last page of this document.
- 10. This chart is from the December 2011 Macro Analytics & Technical Analysis Report December 12th, 2011 TROUBLING VOLUME, VOLATILITY PRECEDES ‘RISK-OFF’ Listen to the original podcast for this slide at www.GordonTLong.com/LONGWave The content of this slide should not be considered investment advice of any sort, nor should it be used to make investment decisions. Use of this slide is considered to be your explicit acceptance of the Disclosure Statement and the Terms of Use found on the last page of this document.
- 11. This chart is from the December 2011 Macro Analytics & Technical Analysis Report December 12th, 2011 TROUBLING VOLUME & VOLATILITY Listen to the original podcast for this slide at www.GordonTLong.com/LONGWave The content of this slide should not be considered investment advice of any sort, nor should it be used to make investment decisions. Use of this slide is considered to be your explicit acceptance of the Disclosure Statement and the Terms of Use found on the last page of this document.
- 12. This chart is from the December 2011 Macro Analytics & Technical Analysis Report December 12th, 2011 TROUBLING VOLUME, VOLATILITY PRECEDES ‘RISK-OFF’ Listen to the original podcast for this slide at www.GordonTLong.com/LONGWave The content of this slide should not be considered investment advice of any sort, nor should it be used to make investment decisions. Use of this slide is considered to be your explicit acceptance of the Disclosure Statement and the Terms of Use found on the last page of this document.
- 13. This chart is from the December 2011 Macro Analytics & Technical Analysis Report December 12th, 2011 TROUBLING VOLUME, VOLATILITY PRECEDES ‘RISK-OFF’ Listen to the original podcast for this slide at www.GordonTLong.com/LONGWave The content of this slide should not be considered investment advice of any sort, nor should it be used to make investment decisions. Use of this slide is considered to be your explicit acceptance of the Disclosure Statement and the Terms of Use found on the last page of this document.
- 14. This chart is from the December 2011 Macro Analytics & Technical Analysis Report December 12th, 2011 FIBONACCI TIME COUNTS & SEQUENCING Listen to the original podcast for this slide at www.GordonTLong.com/LONGWave The content of this slide should not be considered investment advice of any sort, nor should it be used to make investment decisions. Use of this slide is considered to be your explicit acceptance of the Disclosure Statement and the Terms of Use found on the last page of this document.
- 15. This chart is from the December 2011 Macro Analytics & Technical Analysis Report December 12th, 2011 SANTA CLAUS RALLY Listen to the original podcast for this slide at www.GordonTLong.com/LONGWave The content of this slide should not be considered investment advice of any sort, nor should it be used to make investment decisions. Use of this slide is considered to be your explicit acceptance of the Disclosure Statement and the Terms of Use found on the last page of this document.
- 16. This chart is from the December 2011 Macro Analytics & Technical Analysis Report December 12th, 2011 TROUBLING VOLUME & VOLATILITY Listen to the original podcast for this slide at www.GordonTLong.com/LONGWave The content of this slide should not be considered investment advice of any sort, nor should it be used to make investment decisions. Use of this slide is considered to be your explicit acceptance of the Disclosure Statement and the Terms of Use found on the last page of this document.
- 17. This chart is from the December 2011 Macro Analytics & Technical Analysis Report December 12th, 2011 FIBONACCI TIME COUNTS & SEQUENCING Listen to the original podcast for this slide at www.GordonTLong.com/LONGWave The content of this slide should not be considered investment advice of any sort, nor should it be used to make investment decisions. Use of this slide is considered to be your explicit acceptance of the Disclosure Statement and the Terms of Use found on the last page of this document.
- 18. This chart is from the December 2011 Macro Analytics & Technical Analysis Report December 12th, 2011 RISK OFF & SECULAR BEAR MARKET RESUMES! Listen to the original podcast for this slide at www.GordonTLong.com/LONGWave The content of this slide should not be considered investment advice of any sort, nor should it be used to make investment decisions. Use of this slide is considered to be your explicit acceptance of the Disclosure Statement and the Terms of Use found on the last page of this document.
- 19. This chart is from the December 2011 Macro Analytics & Technical Analysis Report December 12th, 2011 TROUBLING VOLUME & VOLATILITY DISCLOSURE STATEMENT AND TERMS OF USE THE CONTENT OF THIS SLIDE PRESENTATION AND ITS ACCOMPANYING RECORDED AUDIO DISCUSSION ARE INTENDED FOR EDUCATIONAL PURPOSES ONLY. This slide presentation and its accompanying recorded audio discussion are not a solicitation to trade or invest, and any analysis is the opinion of the author and is not to be used or relied upon as investment advice. Trading and investing can involve substantial risk of loss. Past performance is no guarantee of future returns/results. Commentary is only the opinions of the authors and should not to be used for investment decisions. You must carefully examine the risks associated with investing of any sort and whether investment programs are suitable for you. You should never invest or consider investments without a complete set of disclosure documents, and should consider the risks prior to investing. This slide presentation and its accompanying recorded audio discussion are not in any way a substitution for disclosure. Suitability of investing decisions rests solely with the investor. Your acknowledgement of this Disclosure and Term of Use Statement is a condition of access to it. Furthermore, any investments you may make are your sole responsibility. THERE IS RISK OF LOSS IN TRADING AND INVESTING OF ANY KIND. PAST PERFORMANCE IS NOT INDICATIVE OF FUTURE RESULTS. Listen to the original podcast for this slide at www.GordonTLong.com/LONGWave The content of this slide should not be considered investment advice of any sort, nor should it be used to make investment decisions. Use of this slide is considered to be your explicit acceptance of the Disclosure Statement and the Terms of Use found on the last page of this document.
Editor's Notes
- INCREASING SIZE OF ARROWS
- 1% daily market moves are now common play an almost expected!!!!Correlation > See Sept 28thLONGWave on Correlated Markets Presentation
- WAYS OF CONSIDERING RISK ON – RISK OFFLance Robert’s of StreetTalkLive and his STA Risk Ratio
- The STA Risk Ratio indicator is a weekly composite indicator comprised of the Rate of Change of the S&P 500 Index, two different ratio of bullish and bearish sentiment, new highs versus new lows and volatility.This indicator is weighted and then smoothed using an 8 week average. The purpose of the indicator is not to provide trading signals for speculative stock trading but longer term asset allocation changes to adjust for market trend changes and risk management. As shown in the chart as the indicator rises above 50, and eventually above 100 on the index, the market is becoming overly bullish. Therefore, as a contrarian investment indicator we begin to look for a turn down in the indicator as a sign to begin reducing portfolio risk by raising cash, increasing fixed income exposure, reducing portfolio beta or adding hedges. Conversely, as the indicator falls below 0, and eventually -50 on the index, the market is becoming excessively bearish and we begin to reverse the allocation process.For example, back in April, and early May, of this year Roberts reduced his portfolio equity allocation levels to the market as the index peaked above the 100 level. By raising fixed income and cash we avoided the majority of the summer decline. As the indicator bottomed and turn up in October he began to add exposure back to the markets.Read more: http://www.streettalklive.com/daily-x-change/550.html#ixzz1gQd2euJu
- Besides the fact that longer term "sell" signals are still in play; Robert’s observes that the STA Risk Ratio indicator is behaving very similarly to the 2008 market topping process. First of all the current market top is still significantly below the previous 2008 top. Furthermore, in 2008 pay particular attention to the topping action. In mid-2008 the market peaked and made the initial decline, made a solid rally attempt that had the media alight with comments the worst was behind investors and then "BOOM". During that process the indicator bottomed near -200, turned up signaling an increase to portfolio allocations and then you were promptly pummeled into the actual bottom in early 2009. The difference is that in "bearish markets" turn ups in the indicator tend to denote bear market rallies rather than bull market advances. With most of Robert’s market signals still in bearish territory and the markets remaining in a bearish trend since the peak - market risk remains elevated.
- Today, we see the very same pattern emerging...and it doesn't "feel" right to Roberts. This is particularly concerning as we head into 2012 and potentially a very turbulent political election cycle, earnings compression due to the end of a profit cycle, a domestic economy that is currently in a "struggle to muddle"through phase, a slowing China, a recessionary Europe and plenty of potential for further crisis' from the Eurozone. We have been here before.Back on August 31st Robert’s wrote:"So far, none of this takes away from the larger fact that the economy is slowing down, corporate profits are weakening, and there is a lot of risk contained in Europe that could back-splash very rapidly into the U.S. This is clearly a bounce within a negative market trend at the current time and is not a new bull market to chase. With fundamentals of stocks deteriorating along with the economy, we see NO reason to take on excessive speculative risk at the current time. We are most likely witnessing end of the month portfolio rebalancing as the markets head into a long labor day weekend market. The light volume rally also does not invoke confidence in a continued push higher.It is ALWAYS better to wait for the signal to change rather than trying to anticipate the change...many people have been hit by buses trying to jump the light. Therefore, we don't recommend chasing this rally until signals clearly provide a better opportunity.Our primary buy/sell indicator is still firmly in SELL territory which automatically reduces equity exposure by 50% from normal allocations and increases fixed income holdings and cash. Until this indicator turns back to positive we will remain underweight in our models in equity and simply use the shorter term signals as noted above as trading opportunities to create additional alpha until such time as the risk/reward ratio is clearly aligned back in our favor."Roberts wrote that just before the bloodbath in September. This is why he is apparently currently positioned with higher than normal levels of cash and fixed income until our longer term "buy" signals come online. While "this time may be different" as long as we remain on a longer term market "sell" signal the cushion of cash gives us some flexibility to add beta if the market continues to rally. However, and most importantly, cash provides us a "safety net" to rework portfolios should this rally fail and begin to push back toward market lows.