Session 4.5 Updating the National Climate Change Action Plan: Towards an e...
1-s2.0-S2405880716300103-main
1. Towards implementing climate services in Peru – The project
CLIMANDES
G. Rosas a
, S. Gubler b,⇑
, C. Oria a
, D. Acuña a
, G. Avalos a
, M. Begert b
, E. Castillo a
, M. Croci-Maspoli b
,
F. Cubas a
, M. Dapozzo a
, A. Díaz a
, D. van Geijtenbeek b
, M. Jacques b
, T. Konzelmann b
, W. Lavado a
,
A. Matos a
, F. Mauchle b
, M. Rohrer c
, A. Rossa b
, S.C. Scherrer b
, M. Valdez a
, M. Valverde a
, G. Villar a
,
E. Villegas a
a
SENAMHI, Service Meteorological and Hydrological of Peru, Lima, Peru
b
Federal Office of Meteorology and Climatology MeteoSwiss, Zurich, Switzerland
c
Meteodat GmbH, Zurich, Switzerland
a r t i c l e i n f o
Article history:
Received 7 March 2016
Received in revised form 13 September
2016
Accepted 4 October 2016
Available online xxxx
Keywords:
Climate services
Data quality control
Homogenization
Demand study
Communication channels
Peruvian Andes
a b s t r a c t
CLIMANDES is a pilot twinning project between the National Weather Services of Peru and Switzerland
(SENAMHI and MeteoSwiss), developed within the Global Framework for Climate Services of the World
Meteorological Organization (WMO). Split in two modules, CLIMANDES aims at improving education in
meteorology and climatology in support of the WMO Regional Training Center in Peru, and introducing
user-tailored climate services in two pilot regions in the Peruvian Andes.
Four areas were prioritized in the first phase of CLIMANDES lasting from 2012 to 2015 to introduce cli-
mate services in Peru. A demand study identified the user needs of climate services and showed that cli-
mate information must be reliable, of high-quality, and precise. The information should be accessible and
timely, understandable and applicable for the users’ specific needs. Second, the quality of climate data
was enhanced through the establishment of quality control and homogenization procedures at
SENAMHI. Specific training and application of the implemented methods at stations in the pilot regions
was promoted to ensure the sustainability of the work. Third, the specific work on climate data enabled
the creation of a webpage to disseminate climate indicators among users. The forth priority of the project
enhanced the broad communication strategy of SENAMHI through creation of a specialized network of
journalists, diverse climate forums, and the establishment of a user database.
The efforts accomplished within CLIMANDES improved the quality of the climate services provided by
SENAMHI. The project hence contributed successfully to higher awareness and higher confidence in the
climate information by SENAMHI.
Ó 2016 The Authors. Published by Elsevier B.V. This is an open access article under the CC BY-NC-ND
license (http://creativecommons.org/licenses/by-nc-nd/4.0/).
Practical Implications
Climate variability and change strongly influence the socio-economic development of all countries (IPCC, 2007). Further, a chang-
ing climate may have adverse effects. It can, for example, decrease water availability, and at the same time increase the potential for
natural hazards. Such changes and hazards strongly distress vulnerable communities, such as rural communities in developing
countries (Smit and Pilifosova, 2001; Adger et al., 2003; Bradley et al., 2006; Salzmann et al., 2009). To address the threats due to
climate variability and change in a specific region, it is imperative that users and policy makers have access to adequate and
high-quality climate information.
The Global Framework for Climate Services (GFCS) program, initiated at the World Climate Conference-3 in 2009 (WMO,
2009), aims at strengthening the provision and use of climate products and information worldwide. Climate services translate
http://dx.doi.org/10.1016/j.cliser.2016.10.001
2405-8807/Ó 2016 The Authors. Published by Elsevier B.V.
This is an open access article under the CC BY-NC-ND license (http://creativecommons.org/licenses/by-nc-nd/4.0/).
⇑ Corresponding author.
E-mail address: stefanie.gubler@meteoswiss.ch (S. Gubler).
Climate Services xxx (2016) xxx–xxx
Contents lists available at ScienceDirect
Climate Services
journal homepage: www.elsevier.com/locate/cliser
Please cite this article in press as: Rosas, G., et al. Towards implementing climate services in Peru – The project CLIMANDES. clim. Ser. (2016), http://dx.doi.
org/10.1016/j.cliser.2016.10.001
2. climate data into information and products that are tailored towards the specific needs of the diverse end users. GFCS recom-
mends the establishment of Climate Services on a regional and national scale. It was, for example, implemented on a regional
scale by the Copernicus Climate Change Service (managed by the ECMWF) and on a national scale by the Swiss National Cen-
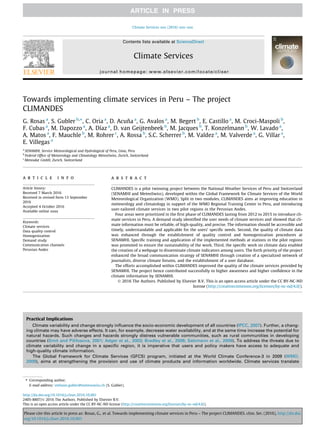
tre for Climate Services NCCS (managed by MeteoSwiss). GFCS is based on five pillars (Fig. 1), namely: Observations and
Monitoring; Research, Modeling and Prediction; Climate Services Information System; User Interface Platform; and Capacity
Building.
The project CLIMANDES, introduced in this study, is a pilot project of GFCS between the Peruvian National Service for Meteorol-
ogy and Hydrology (SENAMHI) and the Swiss weather service MeteoSwiss. Aiming at implementing climate services in the Peruvian
Andes, CLIMANDES integrated much of GFCS through a twinning approach between the two weather services. Therein, the concept
of capacity building was a keystone and one of the all-encompassing activities. Capacity building was achieved through the close
collaboration between the technical personnel of the two weather services (peer-to-peer collaborations) and was supported by class-
room courses and the development of e-learning material. These peer-to-peer collaborations have shown to be very fruitful, and
have overcome language and other cultural differences. Through the building of technical capacities within the institution, it is
ensured that the benefits of such a twinning project remain for the long term.
In its first phase presented here, the project CLIMANDES focused mainly on the first of the five above mentioned GFCS pil-
lars, namely on ‘‘Observations and Monitoring”. Some of the efforts made within CLIMANDES to guarantee high-quality obser-
vations and monitoring at SENAMHI are highlighted in more detail in the following paragraphs. Diverse enabling technologies
are required to ensure the continuous monitoring of the climate, for example an operating data management system. However,
data management systems often do not exist yet in developing countries (WMO, 2011). The ‘‘Observations and Monitoring”-
Pillar hence highlights the need of having basic infrastructure to manage climate data. First of all, an institution (e.g., a national
weather service) has to be functioning at the country level and be responsible for the compilation of climate information. Before
providing climate information to a user, the institution needs to ensure adequate quality of the data for diverse applications,
such as analyses of past climate, monitoring of the current climate, data assimilation in climate models, or model validation,
among others. Regarding these applications, the need for a reliable data storage system in an appropriate database, as well
as the operational implementation of quality control and homogenization methods, becomes apparent. At the institutional level,
it is necessary that the decision makers (for example, managers of the weather service) are aware of the importance of operative
data management systems. If they are, they might grant the necessary human and monetary efforts needed to fulfill these
requirements.
On a more technical level, the implementation of climate services relies on well-structured data stored in high-performance data-
bases. These databases need to be built according to adequate data models fulfilling specific requirements. Such requirements are
given by the data type and the users, and should allow different (internal and external) users and procedures to access the data. For
example, climate analyses require high-quality and homogenized data; it should hence be possible to store different data versions in
a database (e.g., raw, quality controlled, homogenized data). Further, data treatment procedures (such as quality control and homog-
enization procedures) performed directly on the database ensure the sustainability of the work and avoid redundancies in data stor-
age. On earlier occasions at SENAMHI for instance, the results of data quality control efforts realized in individual project were not
integrated into the institutional database, generating duplication of the work efforts.
At SENAMHI, these issues are being improved through the systematic documentation and organization of systems and pro-
cesses. It is worth emphasizing here that the development of the necessary infrastructure is complex and requires sufficient
resources. In order to promote sustainability of such systems, well-trained permanent staff is of fundamental importance for oper-
ation, maintenance, and further developments. For example, quality control is a continuous process, which cannot be permanently
accomplished within a project such as CLIMANDES – in contrast to the construction of quality control software. To improve the capa-
bilities of the staff at SENAMHI in data management and quality, all work done during CLIMANDES was executed in close collabo-
ration between SENAMHI and MeteoSwiss. This peer-to-peer collaboration resulted in an effective way to increase knowledge and
train the technical staff at SENAMHI with respect to the mentioned issues.
During the setup of the GFCS it was very clearly seen that there is a great lack in what is called user-provider dialogue. This means that
there are a large number of potential beneficiaries of climate services, the users, which do not actually know that such services are avail-
able. Activities within user dialogue encompass, for instance, the compilation of the users’ needs and the utilization of appropriate
communication means to disseminate climate information. Within CLIMANDES, several approaches have been implemented, for
example the creation of a webpage providing information through climate change indicators, or the completion of workshops with pol-
icy makers. However, while the newly developed internet platform may be useful for decision makers, farmers in the Peruvian Andes
might be unable to apply this information. Detailed explanations should accompany the information to be understood appropriately,
and these explanations need to be tailored towards the current knowledge and educational standard of the user. Further, farmers usu-
ally do not have access to data provided through a web platform. To reach countryside communities, climate information is commu-
nicated through the use of community radios which is a common communication medium used in the rural Andes. Through these radio
networks, relevant climate information can be broadcast using a user-tailored language. In addition, dealing with the uncertainty inher-
ent to climate information in a proper way is another huge challenge, as users must learn to understand how to extract the right content
of uncertain information.
The end goal of climate information is its usage, and through it, improving the welfare of the user. While it is necessary that infor-
mation reaches the user in an appropriate language and through the proper means, the user will remain in a vulnerable condition if
she/he does not have a response action. In this context, CLIMANDES facilitated the participation of SENAMHI in strategic alliances,
such as for example in the agricultural and educational sector. These alliances seek to create public policies that generate response
actions such that the benefits of climate information can be made tangible for the user.
While all these issues might sound trivial, the implications for an institution providing climate services are large. For instance,
capacity building is needed on two fronts. On one hand, the provider must increase its abilities to socialize useful information.
On the other, users require familiarity with climate information terminology. Further, the direct and continuous contact with the user
is a key aspect to establish trust and understanding.
In conclusion, this manuscript presents a project which aims at implementing climate services according to the guidelines
provided through GFCS. It is an example of a very successful twinning project between Peru and Switzerland, and can be seen
as an example that may be up-scaled to other countries and regions.
2 G. Rosas et al. / Climate Services xxx (2016) xxx–xxx
Please cite this article in press as: Rosas, G., et al. Towards implementing climate services in Peru – The project CLIMANDES. clim. Ser. (2016), http://dx.doi.
org/10.1016/j.cliser.2016.10.001
3. 1. Introduction
Climate variability and change exerts an increasing influence
on the economic and social development of all countries (IPCC,
2007; INEI, 2013a). Decreasing water availability along with
increasing natural hazard potential strongly affect vulnerable rural
communities in developing countries (Smit and Pilifosova, 2001;
Adger et al., 2003), and may have multiple adverse effects at the
local scale (Bradley et al., 2006; Salzmann et al., 2009). High-
quality information on past climate variability is therefore a vital
prerequisite to assess trends and elaborate adaptation and mitiga-
tion strategies.
Climate services translate climate data into tailored information
suited to meet the specific needs of various end user groups. They
encompass a range of activities that deal with generating and pro-
viding information based on past, present, and future climate as
well as on its impacts on natural and human systems. Climate ser-
vices may contribute to the reduction of risks and maximize oppor-
tunities associated with a variable and changing climate, and
provide substantial social and economic benefits for, among others,
the sectors of agriculture, health, energy, tourism, and transport. At
the global scale, currently around 70 countries do not have the
basic capabilities needed to provide sustainable access to climate
services (WMO, 2011). In developing and emerging countries, cli-
mate data are often of insufficient quality and do not meet the pre-
requisites for the provision of climate services for political decision
makers.
To combat these challenges, the World Meteorological Organi-
zation (WMO) launched the program Global Framework for Cli-
mate Services (GFCS) which was introduced at the World Climate
Conference-3 in 2009 (WMO, 2009). The main objective of the ini-
tiative is to build and develop the capacities of National Meteoro-
logical and Hydrological Services (NMHSs) in generating climate
products and services, and to link climate service providers and
users in a way that allows better use of climate information. The
necessity of reliable climate data is seen worldwide through a vari-
ety of projects, such as DECADE in Bolivia (provision of climate
information in the Central Andes, http://www.geography.unibe.
ch/research/climatology_group/research_projects/decade/index_
eng.html), CLARIS (provision of regional climate change impacts on
La Plata basin, http://cordis.europa.eu/project/rcn/89402_en.html),
the WASCAL and SASSCAL projects (aimed at improving the data
availability in western and southern Africa, respectively, for cli-
mate change adaptation measures, http://www.sasscal.org/ and
http://www.wascal.org/), and PRASDES (improvement and stan-
dardization of databases across the boarders for the countries of
the tropical Andes (Bolivia, Peru, Ecuador, and Colombia), http://
www.prasdes-ciifen.org/).
In addition, the project PRAA (Regional Project for Adaptation to
the Impact of Rapid Glacier Retreat in the Tropical Andes) of the
Andean Community and the World Bank sought to strengthen
the resilience of local ecosystems and economies in relation to
the impact caused by rapid glacier retreat in the tropical Andes
(CARE, 2011; SENAMHI, 2007a,b). Integrated, participatory man-
agement of water resources were promoted in the Shullcas River
basin inside the Mantaro River basin and the Santa Teresa, Sac-
sasara and Acobamba districts in the Urubamba River basin
(Avalos et al., 2011a,b). Additionally, the project PACC (Proyecto
de Adaptación al Cambio Climático) has recently contributed to
the improvement of the adaptive capacities of the local population,
through provision of a number of adaptation measures and stimu-
lation of awareness at different social and political levels
(Salzmann et al., 2009). Further, 19 selected time series of the Peru-
vian meteorological network were quality controlled and homoge-
nized using the R-code ‘‘rsnht.r” (Aguilar, 2011) within a series of
workshops of South American NMHSs. This homogenized dataset
has contributed to the analysis of changes in temperature (T) and
precipitation (P) extremes over South America (Skansi et al.,
2013). The experiences from these initiatives highlight the poten-
tial benefit as well as underpin the importance of operationalizing
data quality control and homogenization methodologies at
SENAMHI. The transfer of specific know-how of data quality con-
trol and homogenization to the personnel of SENAMHI is a key ele-
ment that ensures the sustainability of the implemented
procedures and guarantees high-quality observations and monitor-
ing. Also, to enhance the socio-economic benefits of climate infor-
mation, the specific needs of diverse user groups must be collected,
and appropriate communication channels must be provided.
Switzerland and Peru have maintained a longstanding collabo-
ration for over 50 years to fight poverty and promote sustainable
development. The countries share high mountainous topography
and face impacts of climate change such as glacier retreat (e.g.,
Rabatel et al., 2013). The Global Program for Climate Change of
the Swiss Agency for Development and Cooperation (SDC) there-
fore supports innovative projects which contribute to finding solu-
tions to the climate change challenge in Peru and the Andean
region. The GFCS twinning project CLIMANDES (Servicios CLIMáti-
cos con énfasis en los ANdes en apoyo a las DEcisioneS) is a bilat-
eral project between SENAMHI and the Swiss Federal Office of
Meteorology and Climatology MeteoSwiss. Running from 2012 to
2015, the project sought to improve education in meteorology
and climatology in support of the newly established WMO Regio-
nal Training Center in Lima, hosted by the National Agrarian
University La Molina (UNALM) (Module 1). It was also designed
to build and implement sustainable climate services in two Peru-
vian regions (Module 2). The overall coordination of CLIMANDES
is carried out by WMO, while the project is implemented by
SENAMHI and MeteoSwiss in collaboration with the UNALM, the
University of Bern (Switzerland), and Meteodat GmbH (Switzer-
land). More specifically, Module 2 of CLIMANDES (presented in this
manuscript) focuses on the two river basins of Urubamba and
Mantaro (Fig. 2), which are mainly situated in the Cuzco and the
Junín region, respectively. The Mantaro basin has an area of
34,550 km2
and the Urubamba basin has an area of 76,200 km2
.
Both river basins are partly glacierized and their water resources
are important for agriculture, hydro-electricity, and the mining
industry.
In this paper, we present the results of Module 2 of CLIMANDES,
i.e., the approach followed to generate reliable climate data and
Fig. 1. Schematic illustration of the five pillars of the GFCS and their links to various
user communities (GFCS, 2014).
G. Rosas et al. / Climate Services xxx (2016) xxx–xxx 3
Please cite this article in press as: Rosas, G., et al. Towards implementing climate services in Peru – The project CLIMANDES. clim. Ser. (2016), http://dx.doi.
org/10.1016/j.cliser.2016.10.001
4. disseminate information of the past climate. The chosen approach
is as follows:
a) Determination of the user needs and requirements on cli-
mate information through the realization of a demand
study;
b) Implementation of data quality control (DQC) and homoge-
nization techniques for operational use at SENAMHI;
c) Calculation of climate change indicators for the two pilot
regions based on enhanced data (i.e., quality controlled
and homogenized measurements); and
d) Dissemination of the climate information to regional gov-
ernments and decision makers through a web-platform
and user workshops.
Sustainability is a primary goal of CLIMANDES, and hence the
outlined approach is designed to be up-scaled to other regions
and different climatological variables.
2. Study site
Peru is located at the central and occidental coast of South
America, directly below the equatorial line between 0°010
4800
S
and 18°210
0300
S, and 68°390
2700
W and 81°190
34.500
W (Fig. 2). The
Peruvian climate is influenced by many factors such as a broad lat-
itudinal range and a complex orography, which is strongly shaped
by the Andean cordillera, the cold coastal Humboldt stream, the
anticyclone of the southern Pacific, and even by the southern
Atlantic. Peru encompasses up to 27 different climate types
(Thornthwaite, 1948); however, three climatological regimes can
be distinguished: the coastal region, the Andean region, and the
Amazon basin. The coast and the Amazon basin are characterized
by high temperatures (highest observed value is 42 °C), while in
the high Andes minimal temperatures (lowest observed value is
À28.2 °C) are recorded, specifically in the Altiplano. With regard
to precipitation, only few annual amounts (1–50 mm) can be mea-
sured in the central and southern coast of Peru. Precipitation is
moderate in the Andes (50–1000 mm) and abundant in the Ama-
zon basin (1000–3000 mm).
The inter-annual climate variability in Peru is mainly deter-
mined by the presence of the El Niño-Southern Oscillation (ENSO).
This ocean-atmosphere coupled climate mode exhibits warm
(cold) anomalies in the central-eastern equatorial Pacific during
its El Niño (La Niña) phase, which induces climate signals world-
wide with an irregular frequency (2–7 years) (Díaz and Markgraf,
1992; Garreaud, 2009). The anomalous sea surface temperature
and the accompanying atmospheric circulation during El Niño
years, especially at its peak during the December to February per-
iod (e.g. 1982/83 and 1997/98), tend to cause a dramatic tempera-
ture rise throughout the country and torrential rains along the
coast, while dryer conditions are observed on the equatorial Andes
(Vuille et al., 2000; Garreaud, 2009). Almost opposite signatures
are expected during La Niña events. Evidence has shown that cli-
mate variability of similar characteristics might take place at the
decadal timescale (Jacques-Coper and Garreaud, 2014; Vuille
et al., 2015), a phenomenon that has been associated by some
authors with the Pacific Decadal Oscillation (PDO, Mantua and
Fig. 2. The two basins Mantaro (yellow) and Urubamba (purple) of the CLIMANDES project. The green crosses indicate the long-term climatological series that are of principal
concern in the project. The stations outside the basins (red dots) are used as references for homogenization. (For interpretation of the references to color in this figure legend,
the reader is referred to the web version of this article.)
4 G. Rosas et al. / Climate Services xxx (2016) xxx–xxx
Please cite this article in press as: Rosas, G., et al. Towards implementing climate services in Peru – The project CLIMANDES. clim. Ser. (2016), http://dx.doi.
org/10.1016/j.cliser.2016.10.001
5. Hare, 2002). Extreme weather events, climate variability and
climate change affect the land surface and the water cycle in differ-
ent ways.
Temperatures have increased by up to 0.2 °C per decade
between 1968 and 2010 in most of the Peruvian territory
(SENAMHI, 2010). Average rainfall has increased on the coast and
in the northern Andes (around 30–40%), and has significantly
decreased (around 20–30%) in the northern Amazon from 1965
to 2006 (Obregón et al., 2009). During the last three decades, the
tropical Andean glaciers have rapidly decreased (Rabatel et al.,
2013), which has also particularly been seen in the Southern part
of Cuzco (Salzmann et al., 2012). This trend is of serious concern
as a large proportion of the Peruvian population lives in arid
regions and relies on water supply for agriculture, domestic con-
sumption, and hydropower (Vergara et al., 2007).
The two regions Cuzco and Junín, located in the Andean zone of
Peru, were selected as pilot regions for this project due to their
high topographic and climatic variability, and more importantly
due to the vulnerability of the population (around 1.3 million
inhabitants in each region (INEI, 2013a)) to climate change hazards
(e.g. heavy precipitation events, cold waves, landslides (INDECI,
2012)). Agriculture in the region Junín is the main provider of agri-
cultural products for Lima, the capital of Peru with around 10 mil-
lion inhabitants. The regions of Cuzco and Junín are responsible for
a considerable percentage of Peru’s main productive activities,
namely 9% of the gross agricultural product, about 9% of the elec-
tric power production, 47% of the coffee production, and 19% of
the mining product (INEI, 2013b). Cuzco, internationally known
for its archaeological heritage site and touristic attraction of Machu
Picchu, has also a great potential for hydroelectricity due to diverse
glaciers and lakes. Both regions are highly vulnerable to hazards
such as landslides or mudflows due to their steep topographies
(Huggel et al., 2012). The presence of large cities that have a con-
tinuous socio-economic growth in these regions, such as Cuzco
and Huancayo, respectively, underscores the importance of pro-
ducing and disseminating climate information in the region.
3. Approach
With respect to the goals of Module 2, the following four major
steps were adopted in this project: a) realization of a demand study
to identify user needs and requirements on climate services in
Peru, b) implementation of adequate data quality control and
homogenization procedures at SENAMHI, c) application of quality
control and homogenization methods to provide reliable climate
information through climate change indices (CCIs) for the pilot
regions, and d) development of a web-platform and communica-
tion networks that allow dissemination of the climate information
to the local decision makers. These four steps are based upon three
general principles: use of existing infrastructure at SENAMHI
whenever possible, application of international guidelines, and
the possibility to expand the methods to further measurements,
e.g., through up-scaling to the national level and adaptation to
other climatological variables.
3.1. Demand study
A demand study was conducted in the pilot regions Junín and
Cuzco to identify the various types of climate information needed
by the users, and also to determine the different types of users
requesting such information. The results of this study provide
guidance to SENAMHI for the development of climate products
and services. Specifically, the main goal of the institution is to sup-
port the improvement in the climate-related risk management
within multiple economic sectors in the pilot regions. In particular,
the concrete purposes of the study are: 1) to describe the demo-
graphics of current and potential users that require climate ser-
vices, according to age, educational level, and socio-economic
activity, 2) to distinguish specific requirements on climate prod-
ucts and services, 3) to characterize possible improvements in
the current climate products and services, so that they effectively
address the users’ needs, 4) to explore the users’ satisfaction levels
concerning climate products and services, and 5) to assess the
effectivity of the communication channels currently used by
SENAMHI and to formulate ways to improve them. The survey
focused on decision makers, on representatives of selected
climate-dependent economic sectors, and on farmers themselves,
given that agriculture is the most vulnerable sector to climate vari-
ability and change. The methodology consisted of in-depth inter-
views with decision makers (30 in each region) and in a survey
conducted among farmers (150 in Junín and 160 in Cuzco).
3.2. Data quality control and homogenization procedures
Climate data constitute the principle component for the devel-
opment of climate services. At SENAMHI, the main climatological
variables (temperature, precipitation, humidity, wind speed and
direction) have been measured systematically since 1964. The
manual measurements are stored on handwritten papers, which
are digitized and entered on a monthly basis into the central data-
base at the head quarter. However, the data is usually not system-
atically quality controlled or homogenized. Quality control and
homogenization is mostly only done within individual projects
(e.g., Skansi et al., 2013). To provide reliable climate information,
it is imperative to operationalize quality control and homogeniza-
tion at SENAMHI.
CLIMANDES aims at implementing suitable quality control and
homogenization procedures at SENAMHI. The procedures are
selected according to international standards (e.g., Klein Tank
et al., 2009; Venema et al., 2012) and methods successfully imple-
mented in MeteoSwiss (van Geijtenbeek et al., 2009; Scherrer et al.,
2011) and other meteorological offices (e.g., DWD, 2015; ZAMG,
2015). The selected procedures are adapted and implemented
according to the specific needs of SENAMHI as in the treatment
of daily manual measurements. In addition, institutional policies
supporting the regular quality control and homogenization are
improved. To consolidate institutional capacities, several work-
shops providing guidance from external as well as internal experts
were held at SENAMHI.
3.3. Reliable climate information in the pilot regions
With respect to the pillar ‘‘Observations and Monitoring” of the
GFCS, the data quality control and homogenization methods were
applied to the pilot stations in parallel to the development of the
systems introduced in Section 3.2. In a first step, suitable stations
from the pilot regions were selected based on completeness and
visual quality checks (e.g., Hunziker et al. (submitted)). Stations
with severe data problems (e.g., missing data intervals, reduc-
tion/augmentation of the variability, drifting coupled with changes
in the variability, etc.) were marked as not suitable. CLIMANDES
focused on stations measuring both temperature and precipitation
(hereafter referred to as conventional stations).
The data was quality controlled using rule-based quality checks
implemented in the R-program RClimDex (Zhang and Yang, 2004),
and homogenized using HOMER (Mestre et al., 2013). HOMER was
selected for homogenization since it is state-of-the-art (Venema
et al., 2012), it is freely available, and runs on the open source soft-
ware R (R Development Core Team, 2014). The enhanced data was
used to calculate the 27 CCIs (Table 1) using the R-package
‘‘climdex_pcic” (Klein Tank et al., 2009). The 27 CCIs were
G. Rosas et al. / Climate Services xxx (2016) xxx–xxx 5
Please cite this article in press as: Rosas, G., et al. Towards implementing climate services in Peru – The project CLIMANDES. clim. Ser. (2016), http://dx.doi.
org/10.1016/j.cliser.2016.10.001
6. developed to support NHMSs, to identify and describe changes in
extreme values under climate change conditions, and to provide
a software package that implements a basic set of indices for cli-
mate extremes. These indices and corresponding trends are
depicted on a web platform for dissemination (Section 3.4).
3.4. Dissemination of climate information
Dissemination of climate information is an essential component
of successful climate services. Within CLIMANDES, two levels of
dissemination are distinguished: 1) the direct communication
channel established with the trained end users of the climate infor-
mation (from both the public and the private sectors) and 2) the
mass communication channel, which aims at providing general cli-
mate information to the population of Peru.
Direct communication with trained users is done on a technical
basis through an appropriate web platform (http://www.senamhi.-
gob.pe/climandes/?p=indicadores). The platform may be accessed
by decision makers and a broader public, and contains both climate
information itself, in the form of CCIs, and graphical outreach
material, such as news, photo galleries, and videos related to the
development of climate information. Besides, publications pre-
pared during the project, such as studies on the socio-economic
benefits of pilot climate services (e.g., MeteoSwiss/SENAMHI,
2015), are available on the platform. Concerning mass communica-
tion, climate information is presented at diverse workshops in the
pilot regions, as well as through networks of journalists that were
trained in general meteorology and climatology.
4. Results
4.1. Demand study
The demand study shed light on the users’ landscape and their
needs with respect to the climate services currently provided by
SENAMHI, as well as to those that may be potentially developed
in the future. In the following sections, the main results of the
demand study are presented. The current users of climate informa-
tion are members of public and private institutions which maintain
a formal link to SENAMHI. Although they have a technical back-
ground and are aware of the incidence of climate in their activities,
they report not to use the tools that would allow them to incorpo-
rate climatic variables into their decision-making process in an
official way. In fact, results show that although only about 25% of
the interviewed institutions show dissatisfaction regarding the
information provided by SENAMHI, 42% does not extensively uti-
lize this information.
The study detected that the most climate-sensitive economic
sectors are agriculture, tourism, and health in Cuzco, and agricul-
ture and transport in Junín. In this article, we focus on the findings
raised for the agricultural sector. The presented results are struc-
tured according to the purposes of the demand study outlined in
Section 3.1.
4.1.1. Users
Most farmers in the Junín region (67%) are between the ages of
30 and 59 years. These farmers grow a variety of crops, in most of
Table 1
Definition of climate change indicators implemented during CLIMANDES, defined by the Expert Team on Climate Change Detection and Indices (ETCCDI) http://
etccdi.pacificclimate.org/list_27_indices.shtm (Karl et al., 1999; Peterson et al., 2001).
ID Indicator name Definitions Units
FD0 Frost days Annual count when TN(daily minimum) < 0 °C Days
SU25 Summer days Annual count when TX(daily maximum) > 25 °C Days
ID0 Ice days Annual count when TX(daily maximum) < 0 °C Days
TR20 Tropical nights Annual count when TN(daily minimum) > 20 °C Days
GSL Growing season length Annual (1st Jan to 31st Dec in NH, 1st July to 30th June in SH) count between first span of at least 6 days with
TG > 5 °C and first span after July 1 (January 1 in SH) of 6 days with TG < 5 °C
Days
TXx Max Tmax Monthly maximum value of daily maximum temp °C
TNx Max Tmin Monthly maximum value of daily minimum temp °C
TXn Min Tmax Monthly minimum value of daily maximum temp °C
TNn Min Tmin Monthly minimum value of daily minimum temp °C
TN10p Cool nights Percentage of days when TN < 10th percentile Days
TX10p Cool days Percentage of days when TX < 10th percentile Days
TN90p Warm nights Percentage of days when TN > 90th percentile Days
TX90p Warm days Percentage of days when TX > 90th percentile Days
WSDI Warm spell duration
indicator
Annual count of days with at least 6 consecutive days when TX > 90th percentile Days
CSDI Cold spell duration
indicator
Annual count of days with at least 6 consecutive days when TN < 10th percentile Days
DTR Diurnal temperature range Monthly mean difference between TX and TN °C
RX1 day Max 1-day precipitation
amount
Monthly maximum 1-day precipitation Mm
Rx5 day Max 5-day precipitation
amount
Monthly maximum consecutive 5-day precipitation Mm
SDII Simple daily intensity
index
Annual total precipitation divided by the number of wet days (defined as PRCP P 1.0 mm) in the year Mm/day
R10 Number of heavy
precipitation days
Annual count of days when PRCP P 10 mm Days
R20 Number of very heavy
precipitation days
Annual count of days when PRCP P 20 mm Days
Rnn Number of days above nn
mm
Annual count of days when PRCP P nn mm, nn is user defined threshold Days
CDD Consecutive dry days Maximum number of consecutive days with RR < 1 mm Days
CWD Consecutive wet days Maximum number of consecutive days with RR P 1 mm Days
R95p Very wet days Annual total PRCP when RR > 95th percentile Mm
R99p Extremely wet days Annual total PRCP when RR > 99th percentile mm
PRCPTOT Annual total wet-day
precipitation
Annual total PRCP in wet days (RR P 1 mm) mm
6 G. Rosas et al. / Climate Services xxx (2016) xxx–xxx
Please cite this article in press as: Rosas, G., et al. Towards implementing climate services in Peru – The project CLIMANDES. clim. Ser. (2016), http://dx.doi.
org/10.1016/j.cliser.2016.10.001
7. the cases (93.3%) in own plots, from which the majority are smaller
than 5 ha. In the zones of Pucará and the Mantaro Valley, the major
climatic menaces are due to extreme events, such as intense pre-
cipitation, floods, and droughts, as well as frosts and hail storms.
In the Cuzco region, 68% of the farmers belong to the same age
group mentioned above. In this case, however, individual land
plots are mostly (93.1%) smaller than 2 ha. Besides the extreme cli-
mate events identified above for Junín, this region is also suscepti-
ble to strong winds. The survey identified the existence of a
common practice among the farmers, named here ‘‘Ancestral
Visual Indicator”. It consists of a hereditary climate-related knowl-
edge, based on the observation of the sky. This usage is mainly
spread among old farmers (older than 70 years), for whom it has
higher credibility than the information provided by SENAMHI. In
contrast, young farmers tend not to adopt this ancestral knowl-
edge, refusing non-modern and for them unreliable habits. Hence,
without criticizing the ancestral knowledge, this results in a fur-
ther opportunity for SENAMHI concerning the development of
modern climate services.
4.1.2. Users’ requirements
Concerning their specific needs, the users stated that climate-
related information might be useful to determine the beginning
of the agricultural season, as well as for planning measures to
enhance the yield, e.g. the protection of crops against adverse cli-
mate events. Specifically, the climate services requested by the
users were the monthly and seasonal forecasts of precipitation,
droughts, and high floods, as well as of frosts and extreme temper-
atures, since the said events are among the most dangerous crop
threats. Plagues and diseases affecting crops (such as coffee rust),
are also often climate related (MeteoSwiss/SENAMHI, 2015). A very
practical user-tailored climate service would be one that effec-
tively warns about forecasted conditions that trigger the outbreak
of such plagues and diseases.
While it was found that some users demand only information
on the mean future climate conditions (i.e. below, above or close
to the climate mean), it was recognized that other users express
a wish to get forecasts that are precise concerning both the fre-
quency and the duration of the events. Whereas in Junín farmers
manifest their wish to obtain this information 1–3 weeks prior to
the respective events, in order to prevent monetary losses due to
e.g., delayed sales, in Cuzco this time span declared by users grows
up to 1–2 months. Within the public sector, processes undertaken
by specialized institutions (e.g., the Insituto Nacional de Defensa
Civil (INDECI), the Centro Nacional de Estimación, Prevención y
Reducción de Riesgo de Desastres (CENEPRED), Regional Govern-
ments, and other state organisms), aiming at increasing the aware-
ness among the population and at planning prevention measures,
need to be activated enough in advance. This is, for example, the
case of water management strategies implemented by Irrigation
Committees.
In summary, the attributes that climate information should
bear are mainly the following three: 1) reliability, i.e. that it explic-
itly shows the source of the information, such as the station’s loca-
tion and name, and that it has passed a quality control check, 2)
quality, i.e. that it has been tailored to the user’s needs, that it is
accessible at the appropriate time, and easy to understand and to
apply, and 3) precision, i.e. that it is spatially adjusted to the very
location of the final user, and not just issued for a broad region.
4.1.3. Improvements of climate services
Climate information should be reliable, accessible, and precise.
Therefore, the coverage of SENAMHI’s instrumental network
should be improved, especially in high Andean zones. Further,
the quality of the measurements should be enhanced in order to
ensure the quality of the climate services. Then, the information
should be regularly updated and timely.
4.1.4. User satisfaction
In contrast to the public and private institutions (only about
25% of dissatisfaction), 64% of the farmers indicate that their con-
fidence in climate services provided by SENAMHI is low. As men-
tioned above, improved (spatial and temporal) precision of the
climate and weather information could increase the confidence
of the farmers in SENAMHI’s products. An improved communica-
tion strategy to reach the local communities would also point to
this goal.
4.1.5. Communication strategy
The study revealed that SENAMHI needs to improve its corpo-
rate image and its positioning as provider of climate services, fac-
ing both the public and the private sectors. This issue requires a
strong communication strategy. The information should be deliv-
ered on time and guidance should be offered to the users, so that
they can know how to interpret and manage it. Further, the con-
tent of climate information (e.g., Climate Bulletins) transmitted
to the users should be easy to understand, clear and direct. The
users expressed that they prefer specific information at regional
to local level rather than information covering the whole country.
The survey indicated also that rural radio stations, community
assemblies, and communitarian loudspeakers, as well as cell
phones could be used by SENAMHI as effective communication
means. Here, it is noteworthy to mention that while farmers do
not really trust the information issued in a centralized way by
SENAMHI in Lima via e.g. TV, they are more likely to trust it when
it is transmitted by more local channels, such the said rural radio
stations.
4.2. Quality control and homogenization procedures
To enhance the operational quality control at SENAMHI and
ensure the sustainability of the elaborated work, quality control
rules were defined, documented (SENAMHI, 2013), and imple-
mented in the database at SENAMHI. They were defined according
to WMO (2011), suggestions from the literature (e.g., Boulanger
et al. 2010; Brunet et al., 2008; Rusticucci et al., 2001) and from
experience gained at MeteoSwiss, and adapted according to the
current needs of SENAMHI to correct data from conventional cli-
mate stations. Along with the automatic detection of errors an
interactive interface is being developed at SENAMHI that allows
for correction of the errors. This system will include digitized ver-
sions of the original datasheets and the thermo-hydrographs to
simplify the correction procedure. For homogenization, the pro-
gram HOMER was introduced and applied at SENAMHI (see Sec-
tion 4.3). Diverse workshops held internally fostered the
institutional knowledge on homogenization. Further, a study on
the use of HOMER in low density networks showed that the root
mean squared error of estimated trends is reduced by around
50% after homogenization in low-density networks (Gubler et al.
(under review)).
We conclude that additional efforts are required to improve
climate analyses in countries of low station densities: quality
enhancement of existing measurements and integration of sta-
tions from partner networks to increase the number of available
measurements, and the collection of meta-information from the
past for quality control. However, it is further worth mentioning
here that ex-post data quality control and homogenization cannot
compensate for all errors made during the measurement process.
Therefore, the establishment of measures that allow immediate
intervention in case of measurement errors is crucial to avoid
data loss that may severely affect or even ruin long-term
G. Rosas et al. / Climate Services xxx (2016) xxx–xxx 7
Please cite this article in press as: Rosas, G., et al. Towards implementing climate services in Peru – The project CLIMANDES. clim. Ser. (2016), http://dx.doi.
org/10.1016/j.cliser.2016.10.001
8. time-series of measured data (e.g., Hunziker et al. (submitted)). At
SENAMHI for example, a system was developed that allows trans-
mitting manually measured data directly by cellphones. Of
course, entering invalid or impossible data – as e.g. negative pre-
cipitation values – is prevented. But, within this system, other
simple quality control measures – such as extreme value or inter-
nal consistency checks – could be integrated, allowing interven-
tion directly in the case of implausible data. Intervention could
be done either through an alarm directly to the observer or
through intervention (telephone, visit) by an expert of the NMHS
at the station. At many Peruvian stations, redundant measure-
ments are obtained through thermo-hygrographs and plu-
viographs. These could be enhanced by targeted observer
training to cross-compare the values of the hand-written mea-
surements of thermometers, pluviometers or hygrometers/psy-
chrometers with the thermo-hygrographs or pluviographs. Large
Fig. 3. Trends of maximum and minimum temperature [°C/decade], and percentage change of precipitation from 1964 to 2013. On the left, trends of the quality controlled
data are shown, while the right hand figures show trends after homogenization. The size of the circle shows the size of the trends. Red circles indicate positive trends while
blue circles show negative trends. The filled circles indicate that the trends are significantly different from zero. Maximum temperatures show a significant trend of 0.21 °C/
decade on average. The trends of minimum temperature range around 0.06 °C/decade and are mostly not statistically significant. Similarly, changes in precipitation (on
average 13%) are mainly not significant. (For interpretation of the references to color in this figure legend, the reader is referred to the web version of this article.)
8 G. Rosas et al. / Climate Services xxx (2016) xxx–xxx
Please cite this article in press as: Rosas, G., et al. Towards implementing climate services in Peru – The project CLIMANDES. clim. Ser. (2016), http://dx.doi.
org/10.1016/j.cliser.2016.10.001
9. disagreements could be due to a single misreading – or even an
indication for systematic measurement errors – that could
thereby be detected and corrected. Introduction of such measures
however is a task that could be accomplished in the future.
4.3. Reliable climate information for the pilot regions
While SENAMHI runs many stations in the two pilot regions, a
conclusion of this work is that only a few of them are useful for cli-
mate studies. A pre-selection of the data was necessary to avoid
erroneous climate analyses in the region. It was based on criteria
such as data length, completeness, and quality (Section 3.3).
Finally, ten conventional stations for the Urubamba and the Man-
taro basin were selected, corresponding to a station density of
roughly one per 10,000 km2
. For homogenization, the station net-
work was complemented with stations from neighboring regions
in the Andes, resulting in a number of 24 climatological stations
(Fig. 2). All stations were quality controlled, corrected, and homog-
enized during CLIMANDES. Suspicious data detected by RClimDex
was controlled and corrected ‘‘by hand” using the original data
sheets. The quality controlled data was homogenized using
HOMER within a workshop given by an external expert. Due to
the lack of metadata (e.g., station histories), homogenization was
based on statistical evidence alone. During the homogenization,
special care was given to the acceptance/rejection of break points
in years of strong El Niño events.
The homogenized data is stored in the database at SENAMHI.
The centralized storage of the enhanced data ensures the sustain-
ability of the work done in CLIMANDES, e.g., it guarantees that
the same data is used for different climate analyses (ensuring the
consistency of different climate analyses) and it prevents re-
duplication of the data treatment effort by providing access to
the enhanced data to different users. To illustrate the climate
change indicators on a webpage, an R-script was developed that
reads the homogenized data from the database, calculates the
ETCCDI climate change indicators (Table 1) and respective trends,
and stores the results in the database. From there, they are auto-
matically read and illustrated on a webpage (Section 4.4).
After homogenization, significant (non-significant) warming
trends of around 0.21 °C/decade for TX (around 0.06 °C/decade
for TN) were estimated (Fig. 3). The trends are in accordance with
trends published by other studies in the region (López-Moreno
et al., 2015). The variance of the estimated trends is reduced by
more than 50% after homogenization. The precipitation sums
increase by 13% on average over the last 50 years, however the
changes in precipitation are mostly not significant (Fig. 3).
4.4. Dissemination of climate information
Decision makers in the pilot regions may access information of
the CCIs on the web platform (http://www.senamhi.gob.pe/cli-
mandes/?p=indicadores, see Fig. 4). The platform, which consti-
tutes the main direct communication means between SENAMHI
and trained end users (e.g. decision makers, broad public, economy
actors), allows a map-, region- and name-based selection of indi-
vidual stations. Relevant CCIs for each station appear in a drop-
down system that can be explored by the user. On the interactive
graphic, the measured values, the trend, as well as a smoothed
curve may be obtained. The apparent advantages of such a web-
based solution are the quasi real-time and fully automatic update
of the analyses. However, experience in Switzerland has shown
that solely providing graphical analyses is only one aspect end
users are interested in. This information aspect is improved via
the elaboration and distribution of documents and brochures
explaining the meaning of the CCIs, as well as information on the
trends and possible implications for the communities. The docu-
ments serve as tools to support decisions in planning, to foster
socio-economic development, as well as to treat risks and manage
adaptation to climate change. Another improvement of the web
platform considers the inclusion of a podcast section. This allows
sharing multimedia files, such as testimonies and comments on
the utilization and application of climate services. Further, users
are able to subscribe to the webpage updates and send their feed-
back to SENAMHI. A survey of the webpage over the last months
has shown that on average 300 persons visit the webpage per
month.
Fig. 4. Screenshot of the interactive web-platform that was built to disseminate information on climate extremes through climate change indices. The interactive web
platform allows a region- and station-based selection to display the 27 ETCCDI climate change indicators (Table 1). This figure for example shows that the percentage of warm
days in Granja Kcayra (Cuzco) has increased since 1964.
G. Rosas et al. / Climate Services xxx (2016) xxx–xxx 9
Please cite this article in press as: Rosas, G., et al. Towards implementing climate services in Peru – The project CLIMANDES. clim. Ser. (2016), http://dx.doi.
org/10.1016/j.cliser.2016.10.001
10. Even in developed countries, users often lack knowledge on the
current climate and its influence on their activities and applica-
tions. To give an example, a study by Zubler et al. (2015) in
Switzerland examined the relation between the amount of salt
needed to prevent the streets from freezing in winter. The study
indicates a strong dependence between the number of fresh snow
and the amount of salt, a very useful relation to plan the required
salt amount under climatic change.
In the Peruvian highlands, planning of infrastructure to prevent
damage during extreme events, or infrastructure for irrigation in
agriculture require information on average and extreme precipita-
tion as well as on droughts. Other sectors, such as the health sector,
benefit from monitoring and predicting extreme cold events and
solar radiation to plan protective actions for the population.
The information on CCIs displayed on the webpage may help
increase the awareness of the interactions between the climate
and particular applications in some sectors, and improve planning
under present climatic conditions. In addition, the information on
trends displayed on the webpage may indicate that actions taken
in the past may not be sufficient for the future, and that ancestral
knowledge on the climate is not sufficient to face climatic change.
Mass communication channels between SENAMHI and a
broader public were built in the two study regions Cuzco and Junín
via telephone, social networks, and climate reports. Today,
SENAMHI counts on a communication database covering more than
3000 users at the national level, including decision makers, stake-
holders, journalists, among others. These communication channels
are maintained by staying in continuous contact with the end users,
an aim that requires keeping institutional directories and e-mail
addresses up-to-date and holding regular work meetings.
Two workshops were held in November 2014 in Cuzco and in
Junín. The aim of these workshops was to present a selection of
results of CLIMANDES to diverse stakeholders such as the regional
governments as well as the sectors of agriculture, risk management,
health, and education. These workshops train professionals to
improve their understanding of climate information and its applica-
tions. Further, they allow direct interaction with the end users and
provide information on the users’ visions and expectations, a basis
needed for the continuous improvement of the climate services
provided by SENAMHI. During these first climate workshops,
SENAMHI obtained a lot of feedback: for example, there is a need
to present climate information in a more ‘‘friendly” way, e.g.,
climate bulletins need to be improved using simple language, ter-
minologies, and self-explaining figures. In addition, the information
provided needs to be tailored towards specific interests of the indi-
vidual sectors or users. For example, decision makers are often
short on time and need quick condensed information that can sim-
ply be integrated in their daily business and decision making.
The improvement of the climate services provided and the inte-
gration of the recommendations of different users is a continuous
process. The first areas of improvement will be acted on in the sec-
ond phase of the CLIMANDES. In addition, the use and the applica-
tions of the provided climate information in the diverse sectors
will be monitored.
Due to the role journalism plays in connecting institutions with
the public, a network of specialized journalists was built. Two
workshops in the pilot regions, taking place in 2014 in Junín and
2015 in Cuzco, were held with a total of 150 journalists. These
journalists were trained with respect to climate information and
the diverse products generated by SENAMHI, and they were famil-
iarized with the meteorological and climatological terminology.
For example, misinterpretations of information such as ‘‘the tem-
perature is decreasing by 5 °C” emitted by SENAMHI, which in
the past have also been translated to ‘‘the temperature is 5 °C”,
may thereby be avoided. Another focus was on how such informa-
tion should be communicated to the public, emphasizing simple
and understandable language. In conclusion, this network of jour-
nalists is better prepared to communicate climate information to
diverse audiences (from local governments to the broad public)
using the appropriate language.
Radio spots have been part of the recent communication strat-
egy of SENAMHI, in particular concerning the emission of warnings
on frosts and extreme cold conditions (locally known as ‘‘friajes”).
Currently, these spots reach a broad audience within fifteen
regions prioritized by SENAMHI, thanks to agreements signed
between this institution and the National Broadcasting Coordina-
tion Agency (Coordinadora Nacional de Radio, CNR), as well as with
the National Radio. Thereby, SENAMHI established the first com-
munication channels reaching rural communities directly. The
transmission of warnings (which might be seen as a weather ser-
vice rather than a climate service) serves as a strategy of approxi-
mation to the users (the rural community), a community which
previously did not have any direct contact with such information.
Once established, this communication channel will also serve to
disseminate climate information and may improve the economic
activities in rural communities. Future steps towards an enhanced
communication strategy of SENAMHI require that alliances with
commercial, educational, and community radio stations are
strengthened.
5. Conclusions
National adaptation and mitigation strategies and climate-
related policy decisions need to be based on high-quality climate
information. The WMO-led Global Framework for Climate Services
is designed to bridge the gap between scientific knowledge and
end users’ requirements. In this context, CLIMANDES is an innova-
tive twinning project between the National Meteorological Ser-
vices of Switzerland and Peru. CLIMANDES provides climate
services to inform decision makers in Peru and the Andean region.
The key element is the web-based platform, which serves as a user
interface to disseminate user-tailored climate information to
specific groups, in particular to political decision makers. Experi-
ence gained from this work should be used as a basis for upscaling
the technical results to the national and regional level through
institutions such as WMO and the Centro Internacional para la
Investigación del Fenómeno de El Niño (CIIFEN) through workshops
with NMHs from neighboring countries.
Within CLIMANDES, a demand study was conducted among cur-
rent users of the climate information delivered by SENAMHI, as well
as among potential new users. Although this survey was done in a
late stage of the project, and thus no crucial adaptations could be
implemented, its results provide a framework for a second phase
of CLIMANDES that started in January 2016. Based on the outcomes
of the demand study, the efforts will focus on the development of
reliable and precise monthly-to-seasonal forecasts of precipitation,
temperature, and related climate events. The study showed that a
fundamental drawback to tackle in Peru is the availability of good
quality climate observations of high spatial coverage. Further, cli-
mate services should be tailored to the specific users’ needs con-
cerning their geographical reality. Also, the background
knowledge of the end users concerning climate information should
be considered within SENAMHI’s communication strategy, so that
right guidance is provided. This is a crucial aspect for the proper
interpretation and application of the information. The demand
study as a first approach to determine the needs of the users of
weather and climate information was an interesting exercise per-
formed by SENAMHI to change its focus of perception, to determine
the needs of users in dependence of diverse factors, such as region,
economic interest (subsistence or selling producers), responsibility
in society (family livelihood or regional authority).
10 G. Rosas et al. / Climate Services xxx (2016) xxx–xxx
Please cite this article in press as: Rosas, G., et al. Towards implementing climate services in Peru – The project CLIMANDES. clim. Ser. (2016), http://dx.doi.
org/10.1016/j.cliser.2016.10.001
11. To improve the basis for climate services, a great effort has been
undertaken to improve the quality of climatological data at
SENAMHI. The approach of the project was threefold: a) applica-
tion of selected methods to stations in pilot regions to obtain
exemplary results that can be up-scaled to the larger region and
that may be used for training purposes, b) development of tools
to facilitate quality control procedures and ensure sustainability,
and c) training of dedicated staff at SENAMHI. The joint efforts of
SENAMHI and MeteoSwiss have shown to be very constructive in
order to adapt and develop tailored procedures to improve the data
chain at SENAMHI. Further, the diverse technical exchanges of pro-
fessional staff of both institutions allowed to ensure a profound
training and exchange of experiences between the two meteoro-
logical offices.
Challenges in the data chain remain due to the pronounced
need for a general revision of the data management concept and
the set-up of the data base at SENAMHI. These and other issues
that clearly emerged as a current need at SENAMHI are addressed
in the second phase of the project. Further, the operationalization
of the quality chain at SENAMHI requiring dedicated human
resources will be continuously monitored during the second phase,
ensuring the sustainability of the obtained results.
The results of the technical part of the project are provided
through climate change indicators (CCIs) on the web to decision
makers. The web platform is the main direct communication chan-
nel between SENAMHI and trained end-users developed within
CLIMANDES. Additionally, mass communication with a broader
audience is reached through other channels, such as mobiles, social
networks, and reports. This resulted in effective communication
means in the project that allowed to raise the awareness of climate
information in public and private institutions. Individuals of the
public and private sectors were trained during diverse events in
order to improve their understanding of the climate information
and its applications such that the information is used appropriately
and understood correctly. These events further allowed to obtain
direct feedback from the users on how to improve the services pro-
vided by SENAMHI, which, in a continuous process, will be imple-
mented in the future. Further, a network of specialized journalists
has been established to reach and inform the public properly
through an adequate use of language. Targeting more urban users,
specifically the tourism sector in Cuzco, SENAMHI envisions the
development of a mobile app, inspired by the MeteoSwiss App,
so that tourists are able to better plan their leisure activities.
Further, alliances with local communication channels, such as
communitarian radio stations, were strengthened. In the future
and concerning the agricultural sector in particular, radio spots
that deliver climatic information will raise sensitivity awareness
related to climate services among farmers. For that, their tradi-
tional knowledge should be incorporated and combined with the
climate services developed by SENAMHI. Moreover, climate infor-
mation will be translated into Quechua and Aymara, the native lan-
guages of a considerable part of the farmers within the pilot
regions. Through all these efforts, the quality of the climate ser-
vices as well as the communication means were improved through
CLIMANDES, resulting in higher awareness and higher confidence
of the users of climate information.
Acknowledgements
We acknowledge the support of the World Meteorological
Organization (WMO) through the project Servicios CLIMáticos
con énfasis en los ANdes en apoyo a las DEcisioneS (CLIMANDES),
Project no. 7F-08453.01 between the Swiss Agency for Develop-
ment and Cooperation (SDC) and the WMO. We thank two anony-
mous referees for their valuable comments and contributions to
this manuscript. Further, we thank A. Luedi-Gugelmann for
proof-reading the manuscript.
References
Adger, W.N., Huq, S., Brown, K., Conway, D., Hulme, M., 2003. Adaptation to climate
change in the developing world. Prog. Dev. Stud. 3, 179–195.
Aguilar, E., 2011. Manual de uso de rsnht.r (software de homogenización del Center
for Climate Change, Tarragona, Spain). Taller Análisis Eventos Extremos,
Guayaquil.
Avalos, G., Cubas, F., Oria, C., Díaz, A., Quispe, N., Rosas, G., Cornejo, A., Solis, O.,
Guerra, S., 2011a. Atlas de precipitación y temperatura de aire en la cuenca del
río Mantaro. Proyecto de Adaptación al Impacto del Retroceso Acelerado de
Glaciares en los Andes Tropicales – PRAA, Lima, Perú. Servicio Nacional de
Meteorología e Hidrología del Perú-SENAMHI.
Avalos, G., Oria, C., Cubas, F., Díaz, A., Acuña, D., Quispe, N., Rosas, G., Cornejo, A.,
Solis, O., Guerra, S., 2011b. Atlas de precipitación y temperatura de aire en la
cuenca del río Urubamba. Proyecto de Adaptación al Impacto del Retroceso
Acelerado de Glaciares en los Andes Tropicales – PRAA, Lima, Peru. Servicio
Nacional de Meteorología e Hidrología del Perú-SENAMHI.
Boulanger, J.P., Aizpuru, J., Leggieri, L., Marino, M., 2010. A procedure for automated
quality control and homogenization of historical daily temperature and
precipitation data (APACH): part 1: quality control and application to the
Argentine weather service stations. Climatic Change 98, 471. http://dx.doi.org/
10.1007/s10584-009-9741-9.
Bradley, R.S., Vuille, M., Díaz, H.F., Vergara, W., 2006. Threats to water supplies in
the tropical Andes. Science 312, 1755–1756.
Brunet, M., Saladié, O., Jones, P., Sigró, J., Aguilar, E., Moberg, A., Lister, D., Walther,
A., Almarza, C., 2008. A Case-study/Guidance on the Development of Long-term
Daily Adjusted Temperature Datasets. WCDMP No. 66 – WMO/TD-No. 1425.
Care, 2011. Application of Climate Vulnerability and Capacity Assessment (CVCA)
Methodology in Ecuador, Peru and Bolivia: Regional Project for Adaptation to
the Impact of Rapid Glacier Retreat in the Tropical Andes – PRAA, p. 11.
Díaz, H.F., Markgraf, V., 1992. El Niño. Cambridge University Press, Cambridge, UK.
DWD, 2015. Deutscher Wetterdienst. <https://cdc.dwd.de/catalogue/Klimadaten_
QC.html> (accessed 15.02. 2015).
Garreaud, R.D., 2009. The Andes climate and weather. Adv. Geosci. 22, 3–11.
GFCS, 2014. Implementation Plan of the Global Framework for Climate Services.
World Meteorological Organiziation.
Gubler, S., Hunziker, S., Begert, M., Croci-Maspoli, M., Konzelmann, T., Brönnimann,
S., Schwierz, C., Oria, C., Rosas, G. The influence of station density to climate data
homogenization using HOMER (under review for publication in the Int. J.
Climatol.).
Huggel, C., Raissig, A., Romero, G., Rohrer, M., Salzmann, N., Díaz, A., Acuña, D., 2012.
On Trends and Climatic Effects of Multi-type and Cascading Hazards in the
Andes of Peru.
Hunziker, S., Gubler, S., Oria, S., Acuña, D., Calle, J., Moreno, I., Ticona, L., Andrade, M.,
Velarde, F., Brönnimann, S., Croci-Maspoli, M., Konzelmann, T., Carrasco, G.,
Castellón, Y. Identifying and attributing common data quality problems:
temperature and precipitation observations in Bolivia and Peru (submitted to
Int. J. Climatol.).
INDECI, 2012. Compendio estadístico del Indeci. En la atención de emergencias y
disastres 2011. Instituto Nacional de Defensa Civil.
INEI, 2013a. Perú – Población proyectada por departamento, 2012 y 2013.
INEI, 2013b. Producto bruto interno por departamentos, 2001–2011.
IPCC, 2007. Climate Change 2007: The Physical Science Basis: Contribution of
Working Group I to the Fourth Assessment Report of the Intergovernmental
Panel on Climate Change. Cambridge Univ Pr.
Jacques-Coper, M., Garreaud, R.D., 2014. Characterization of the 1970s climate shift
in South America. Int. J. Climatol. 43, 2111–2130. http://dx.doi.org/10.1002/
joc.4120.
Karl, T.R., Nicholls, N., Ghazi, A., 1999. CLIVAR/GCOS/WMO workshop on indices and
indicators for climate extremes: workshop summary. Clim. Change 42, 3–7.
Klein Tank, A.M.G., Zwiers, F.W., Zhang, X., 2009. Guidelines on Analysis of Extremes
in a Changing Climate in Support of Informed Decisions for Adaptation. World
Meteorological Organization.
Mantua, N., Hare, S., 2002. The Pacific decadal oscillation. J. Oceanogr. 58, 35–44.
http://dx.doi.org/10.1023/A:1015820616384.
Mestre, O., Domonkos, P., Picard, F., Auer, I., Robin, S., Lebarbier, E., Böhm, R., Aguilar,
E., Guijarro, J., Vertacˇnik, G., Klancar, M., Dubuisson, B., Stepanek, P., 2013.
HOMER: a homogenization software – methods and applications. Quart. J.
Hung. Meteor. Serv. 117, 47–67.
López-Moreno, J.I., Morán-Tejeda, E., Vicente-Serrano, S.M., Bazo, J., Azorin-Molina,
C., Revuelto, J., Sánchez-Lorenzo, A., Navarro-Serrano, F., Aguilar, E., Chura, O.,
2015. Recent temperature variability and change in the Altiplano of Bolivia and
Peru. Int. J. Climatol. http://dx.doi.org/10.1002/joc.4459.
MeteoSwiss/SENAMHI, 2015. Socio-Economic Benefits of User-Tailored Climate
Services: A Case Study for the Coffee and Maize Production in Peru. Publication
of SENAMHI and MeteoSwiss, p. 28.
Obregón, G., Díaz, A., Rosas, G., Avalos, G., Oria, C., Acuña, D., Llacza, A., Richard, M.,
2009. Escenarios climáticos en el Perú para el año 2030 – Segunda
comunicación nacional de cambio climático. Servicio Nacional de
Meteorología e Hidrología del Perú – SENAMHI, Lima.
G. Rosas et al. / Climate Services xxx (2016) xxx–xxx 11
Please cite this article in press as: Rosas, G., et al. Towards implementing climate services in Peru – The project CLIMANDES. clim. Ser. (2016), http://dx.doi.
org/10.1016/j.cliser.2016.10.001
12. Peterson, T.C., Folland, C., Gruza, G., Hogg, W., Mokssit, A., Plummer, N., 2001.
Summary Report of the Activities of the WMO CCl/CLIVAR Working Group on
Climate Change Detection. WMO, p. 143. Rep. WCDMP-47, WMO-TD 1071,
Geneve, Switzerland.
R Development Core Team, 2014. R: A Language and Environment for Statistical
Computing. R Foundation for Statistical Computing, Vienna, Austria. ISBN 3-
900051-07-0, URL <http://www.Rproject.org/>.
Rabatel, A., Francou, B., Soruco, A., Gomez, J., Cáceres, B., Ceballos, J.L., Basantes, R.,
Vuille, M., Sicart, J.-E., Huggel, C., Scheel, M., Lejeune, Y., Arnaud, Y., Collet, M.,
Condom, T., Consoli, G., Favier, V., Jomelli, V., Galarraga, R., Ginot, P., Maisincho,
L., Mendoza, J., Ménégoz, M., Ramirez, E., Ribstein, P., Suarez, W., Villacis, M.,
Wagnon, P., 2013. Current state of glaciers in the tropical Andes: a multi-
century perspective on glacier evolution and climate change. Cryosphere 7, 81–
102. http://dx.doi.org/10.5194/tc-7-81-2013.
Rusticucci, M.M., Barrucand, M.G., 2001. Climatología de temperaturas extremas en
la Argentina. Consistencia de datos. Relación entre la temperatura media
estacional y la ocurrencia de días extremos. Meteorología 26, 69–84.
Salzmann, N., Huggel, C., Calanca, P., Díaz, A., Jonas, T., Jurt, C., Konzelmann, T.,
Lagos, P., Rohrer, M., Silverio, W., Zappa, M., 2009. Integrated assessment and
adaptation to climate change impacts in the Peruvian Andes. Adv. Geosci. 22,
35–39.
Salzmann, N., Huggel, C., Rohrer, M., Silverio, W., Mark, B.G., Burns, P., Portocarrero,
C., 2012. Glacier changes and climate trends derived from multiple sources in
the data scarce Cordillera Vilcanota region, Southern Peruvian Andes.
Cryosphere 7, 103–118.
Scherrer, S.C., Croci-Maspoli, M., Van Geijtenbeek, D., Hotz, C., Frei, C., Appenzeller,
C., 2011. Operational quality control of daily precipitation using spatio-
climatological plausibility testing. Meteorol. Z. 20 (4), 397–407.
SENAMHI, 2007a. Escenarios del cambio climático en la cuenca del río Mantaro para
el año 2100. Servicio Nacional de Meteorología e Hidrología del Perú.
SENAMHI, 2007b. Escenarios del cambio climático en la cuenca del río Urubamba
para el año 2100. Servicio Nacional de Meteorología e Hidrología del Perú.
SENAMHI, 2010. El Perú y el cambio climático – Segunda comunicación nacional del
Perú a la convención marco de las Naciones Unidas sobre cambio climático.
SENAMHI, 2013. Criterios establecidos para el sistema de control de calidad del
SENAMHI – temperatura y precipitación. In: Oria, C., Barreto, C., Cubas, F.,
Acuña, D., Valdez, M., Gubler, S. (Eds.), Reporte Técnico CLIMANDES-2013-
001.
Skansi, M.D.L.M., Brunet, M., Sigró, J., Aguilar, E., Arévalo, J.A., Bentancur, O.J.,
Castellón, Y.R., Correa, R.L., Jácome, H., Malheiros, A., Oria, C., Pasten, A.M.,
Sallons, S., Vallaroel, C., Martínez, R., Alexander, L.V., Jones, P.D., 2013. Warming
and wetting signals emerging from analysis of changes in climate extreme
indices over South America. Global Planet. Change 100, 295–307.
Smit, B., Pilifosova, O. (Eds.), 2001. Adaptation to Climate Change in the Context of
Sustainable Development and Equity. Cambridge University Press, Cambridge.
Thornthwaite, C.W., 1948. An approach toward a rational classification of climate.
Geogr. Rev. 38, 55–94.
Van Geijtenbeek, D., Naguel, C., Scherrer, S.C., Landl, B., 2009. The data quality
control chain for automatic surface observation data at MeteoSwiss. In: 7th
ECSN Data Management Workshop 2009. DMI, Copenhagen.
Venema, V.K.C., Mestre, O., Aguilar, E., Auer, I., Guijarro, J.A., Domonkos, P.,
Vertacˇnik, G., Szentimrey, T., Štepáneˇk, P., Zahradnícˇek, P., Viarre, J., Müller-
Westermeier, G., Lakatos, M., Williams, C.N., Menne, M.J., Lindau, R., Rasol, D.,
Rustemeier, E., Kolokythas, K., Marinova, T., Andresen, L., Acquaotta, F.,
Fratianni, S., Cheval, S., Klancar, M., Brunetti, M., Gruber, C., Prohom Duran,
M., Likso, T., Esteban, P., Brandsma, T., 2012. Benchmarking homogenization
algorithms for monthly data. Clim. Past 8, 89–115.
Vergara, W., Deeb, A., Valencia, A., Bradley, R., Francou, B., Zarzar, A., Grünwaldt, A.,
Häussling, S., 2007. Economic impacts of rapid glacier retreat in the Andes. Eos
Trans. Am. Geophys. Union 88, 261–264.
Vuille, M., Bradley, R.S., Keimig, F., 2000. Interannual climate variability in the
Central Andes and its relation to tropical Pacific and Atlantic forcing. J. Geophys.
Res. 105, 12447–12460.
Vuille, M., Franquist, E., Garreaud, R., Lavado, W.S., Cáceres, B., 2015. Impact of the
global warming hiatus on Andean temperature. J. Geophys. Res. Atmos. 120,
3745–3757. http://dx.doi.org/10.1002/jgrd.v120.9.
WMO, 2009. Global Framework for Climate Services. World Meteorological
Organization.
WMO, 2011. Climate Knowledge for Action: A Global Framework for Climate
Services – Empowering the Most Vulnerable. World Meteorological
Organization.
ZAMG, 2015. Zentralanstalt für Meteorologie und Geodynamik. <http://www.zamg.
ac.at/cms/de/klima/messnetze/datenpruefung:> (accessed 15.02. 2015).
Zhang, X., Yang, F., 2004. RClimDex (1.0) User Manual, p. 23.
Zubler, E.M., Fischer, A.M., Liniger, M.A., Schlegel, T., 2015. Auftausalzverbrauch im
Klimawandel, Fachbericht MeteoSchweiz, 253, p. 36 (in german).
12 G. Rosas et al. / Climate Services xxx (2016) xxx–xxx
Please cite this article in press as: Rosas, G., et al. Towards implementing climate services in Peru – The project CLIMANDES. clim. Ser. (2016), http://dx.doi.
org/10.1016/j.cliser.2016.10.001