Mercer Capital's Business Development Companies Quarterly Newsletter | Q4 201...
consultative work
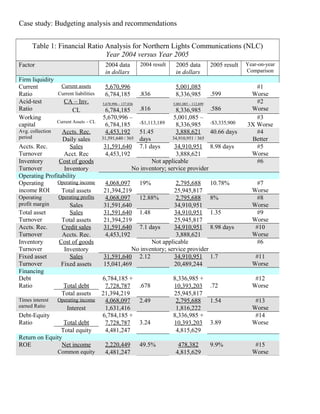
1. Case study: Budgeting analysis and recommendations
Table 1: Financial Ratio Analysis for Northern Lights Communications (NLC)
Year 2004 versus Year 2005
Factor 2004 data
in dollars
2004 result 2005 data
in dollars
2005 result Year-on-year
Comparison
Firm liquidity
Current
Ratio
Current assets 5,670,996
.836
5,001,085
.599
#1
WorseCurrent liabilities 6,784,185 8,336,985
Acid-test
Ratio
CA – Inv. 5,670,996 – 137,036
.816
5,001,085 – 112,699
.586
#2
WorseCL 6,784,185 8,336,985
Working
capital
Current Assets – CL
5,670,996 –
6,784,185 -$1,113,189
5,001,085 –
8,336,985 -$3,335,900
#3
3X Worse
Avg. collection
period
Accts. Rec. 4,453,192 51.45
days
3,888,621 40.66 days #4
BetterDaily sales 31,591,640 / 365 34,910,951 / 365
Accts. Rec.
Turnover
Sales 31,591,640 7.1 days 34,910,951 8.98 days #5
WorseAcct. Rec 4,453,192 3,888,621
Inventory
Turnover
Cost of goods Not applicable
No inventory; service provider
#6
Inventory
Operating Profitability
Operating
income ROI
Operating income 4,068,097 19% 2,795,688 10.78% #7
WorseTotal assets 21,394,219 25,945,817
Operating
profit margin
Operating profits 4,068,097 12.88% 2,795,688 8% #8
WorseSales 31,591,640 34,910,951
Total asset
Turnover
Sales 31,591,640 1.48 34,910,951 1.35 #9
WorseTotal assets 21,394,219 25,945,817
Accts. Rec.
Turnover
Credit sales 31,591,640 7.1 days 34,910,951 8.98 days #10
WorseAccts. Rec. 4,453,192 3,888,621
Inventory
Turnover
Cost of goods Not applicable
No inventory; service provider
#6
Inventory
Fixed asset
Turnover
Sales 31,591,640 2.12 34,910,951 1.7 #11
WorseFixed assets 15,041,469 20,489,244
Financing
Debt
Ratio Total debt
6,784,185 +
.678
8,336,985 +
.72
#12
Worse7,728,787 10,393,203
Total assets 21,394,219 25,945,817
Times interest
earned Ratio
Operating income 4,068,097 2.49 2,795,688 1.54 #13
WorseInterest 1,631,416 1,816,222
Debt-Equity
Ratio Total debt
6,784,185 +
3.24
8,336,985 +
3.89
#14
Worse7,728,787 10,393,203
Total equity 4,481,247 4,815,629
Return on Equity
ROE Net income 2,220,449 49.5% 478,382 9.9% #15
WorseCommon equity 4,481,247 4,815,629
2. 1. Assessment of the year-on-year financial performance of Northern Lights Communications
NLC is having trouble meeting its financial commitments
NLC has less liquidity for meeting its financial commitments in 2005 versus 2004. Point #1 from the table
shows that in 2004, NLC carried 83.6 cents of current assets for every dollar of debt, and in 2005 this dropped
to 59.9. The acid test ratio (point #2) showed the same trend. The company produces a pure service, and thus
carries no inventory (point #6). As later analysis will show, the reason for this under-performance is the large
increase in current liabilities which is outpacing sales growth. It has a rapidly decreasing capacity to service its
daily operations with working capital. In one year this has the amount of negative working capital has tripled
(point #3), thus urgently increasing the need for NLC to borrow funds to meet day-to-day operations. It is cash
poor and is on the verge of insolvency unless it can re-finance its current liabilities and delay payment to the
long-term. This is true despite the fact that NLC’s collection period has improved from last year, from 51 days
to 40 days (point #4), because it is able to convert receivables into cash at a faster rate. The problem is that the
gross amount of receivables has declined from 2004 to 2005, and this is reflected in the account receivables
turnover rate, which has increased from 7 days to 9 days (point #5).
NLC is not producing enough operating profit on its asset base
The operating income ROI dropped in half, from 19% in 2004 to 10.8% in 2005 (point #7). While this
percentage is still probably higher than the industry norm, the drop in sales should be of concern to
management. In light of the large installation expenditure which expanded the company’s debt exposure, a drop
in OIROI was probably not anticipated. The profit margin is dropping too: from 12.9% in 2004 to 8% in 2005.
This is an indication that one or more of the five factors affecting the operating profit margin of NLC is getting
out of control. Sales volume is decreasing as a ratio of total assets (point #9), and as a ratio of fixed assets (point
#10), which are negative signs. This is occurring despite the fact that NLC seems to be losing market share in
routed operator calls, while increasing its volume of pay-phone coin calls and sundry revenues, which is
positive (see Table 2 below).
Table 2: Income Statement: Sales Revenue*
2004 ($) 2005 ($)
Pay-phone coin calls 14,306,665 17,615,069
Automated operator, routed calls 17,049,394 15,932,154
Other 505,581 1,363,738
Total revenues 31,591,640 34,910,951
*culled from company statements
Being a pure service means NLC cannot realize any reductions in the cost of manufacturing or acquiring the
firm’s products in terms of cost of goods sold. Thus, the main culprit in determining the loss in profitability
would seem to be in operating expenses. The fixed asset turnover ratio has been degraded, from 2.12 in 2004 to
1.7 in 2005. It would appear that the fixed asset capital investment was too onerous a financial undertaking;
NLC just could not afford it. As a result, it is now cash-poor for daily operations, and will have to refinance its
debt and delay payment on its current liabilities, or face insolvency.
NLC is having trouble financing its assets
NLC has leveraged its equity to finance a major installation, probably an increase in the number of coin-
operated phone booths. The medium-term financing has become current in 2005, and this is evident in the
increased debt ratio (see point #12): 0.68 in 2004 < 0.72 in 2005. The times interest earned ratio has also
3. decreased (point #13): from 2.49 in 2004 to 1.54 in 2005. This increasing debt level is increasing its exposure to
financial risk (see point #14), as the debt-equity ratio indicates: NLC had $3.24 of debt for every $1 of equity in
2004, and this increased to $3.89 for every equity dollar in 2005. As a result, the amount of operating income
available to service its debt obligations has decreased by almost 40% in one year. If emergency situations arise,
NLC has less operating capital to deal with it, and its balance sheet will cause potential lenders to increase its
marginal lending rates to compensate for the risk of default. Because it has too much debt, it is less able to
service its interest expenses, and its capacity to incur further debt (or acquire additional financing) is decreasing,
which limits NLC’s future growth prospects.
NLC’s return on investment is decreasing
The operating profit margin may still be competitive for this industry, but at 8% (point #8), it is not high enough
to compensate for the increased debt levels. As a result, the return on equity has decreased dramatically (point
#15): from 49.5% in 2004 to 9.9% in 2005 – a five-fold drop! This exactly parallels the rate of decrease in
NLC’s bottom line (point #15). The net income in 2004 of $2,220,449 dropped to only $478,382 in 2005 –
more than a 4-and-a-half fold drop!
2. What happened to NLC?
NLC probably had a large capital expenditure: the installation of pay phone service equipment and associated
investments which cost about 5 million dollars. This was financed by the owners’ own cash (which shows up in
the lowered interest accrued in the income statement: from 57,278 dollars in 2004, to 5,069 dollars in 2005),
and the issue of company bonds / notes. This debt was issued in 2004, and is coming due in 2005.
The profits generated by this project increased NLC’s sales revenues by about 10%, but not enough to cover its
debt obligations. As a result, NLC does not have enough cash to meet its daily operating expenses, and is faced
with borrowing continuously just to make payroll.
To improve on its cash-poor position, NLC needs to refinance its debt obligations, by negotiating for more time
at lower rates. As well, NLC needs to address the loss of income from its automated and routed calling services.
Its operating expenses could also be curtailed: while the sales revenue increased by 10.5% in 2005, its sales
commissions increased by 14.6%. This might have been due to an attempt by NLC to increase attention on its
pay phone services. Hopefully, next year the commission rates can be rolled back, to be commensurate with
actual sales revenue generated. By paying attention to these areas, hopefully NLC can return to its more
profitable, less debt-dependent ways.