ER Quality Comparison of 5 Dallas Hospitals
•Download as DOCX, PDF•
1 like•172 views


Recommended
Recommended
More Related Content
What's hot
What's hot (19)
Viewers also liked
Viewers also liked (17)
Similar to ER Quality Comparison of 5 Dallas Hospitals
Similar to ER Quality Comparison of 5 Dallas Hospitals (20)
More from Chiao-Chin Lin, MPH, CPH
ER Quality Comparison of 5 Dallas Hospitals
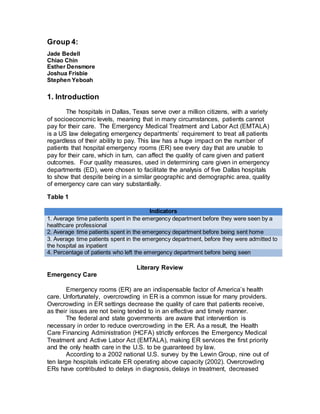
- 1. Group 4: Jade Bedell Chiao Chin Esther Densmore Joshua Frisbie Stephen Yeboah 1. Introduction The hospitals in Dallas, Texas serve over a million citizens, with a variety of socioeconomic levels, meaning that in many circumstances, patients cannot pay for their care. The Emergency Medical Treatment and Labor Act (EMTALA) is a US law delegating emergency departments’ requirement to treat all patients regardless of their ability to pay. This law has a huge impact on the number of patients that hospital emergency rooms (ER) see every day that are unable to pay for their care, which in turn, can affect the quality of care given and patient outcomes. Four quality measures, used in determining care given in emergency departments (ED), were chosen to facilitate the analysis of five Dallas hospitals to show that despite being in a similar geographic and demographic area, quality of emergency care can vary substantially. Table 1 Indicators 1. Average time patients spent in the emergency department before they were seen by a healthcare professional 2. Average time patients spent in the emergency department before being sent home 3. Average time patients spent in the emergency department, before they were admitted to the hospital as inpatient 4. Percentage of patients who left the emergency department before being seen Literary Review Emergency Care Emergency rooms (ER) are an indispensable factor of America’s health care. Unfortunately, overcrowding in ER is a common issue for many providers. Overcrowding in ER settings decrease the quality of care that patients receive, as their issues are not being tended to in an effective and timely manner. The federal and state governments are aware that intervention is necessary in order to reduce overcrowding in the ER. As a result, the Health Care Financing Administration (HCFA) strictly enforces the Emergency Medical Treatment and Active Labor Act (EMTALA), making ER services the first priority and the only health care in the U.S. to be guaranteed by law. According to a 2002 national U.S. survey by the Lewin Group, nine out of ten large hospitals indicate ER operating above capacity (2002). Overcrowding ERs have contributed to delays in diagnosis, delays in treatment, decreased
- 2. quality of care, and poor patient outcomes (Lynn and Kellermann, 1991). One study correlates ER overcrowding to delays in identification and treatment of time sensitive conditions like acute myocardial infarction, acute stroke, acute surgical emergencies, and severe sepsis (Derlet RW, Richards JR, 2002). Another study published, focuses on the main reasons that people visit ER, such as the aforementioned acute conditions of stroke, myocardial infarctions, traumatic injuries (shock and organ damage), and severe sepsis (Capp, 2014). This can then result in patients sometimes leaving the ER without seeing a clinician if the wait is too long (Capp 2014). Other than treatment for severe conditions, a large majority of patients resort to the ER for seeking care if they do not have the means (insurance) to access a primary care physician (PCP) (Lucas, 2009). Emergency care research frequently indicates that inappropriate time usage in care delivery is one of the primary reasons for decrease in quality of care (Lucas, 2009). Not having adequate time in the care delivery process also results in the patient being uninformed about their situation which can lead to further complications (Lucas, 2009). When patients that are seeking emergency care services for traumatic injuries are informed of their situation and are aware of the best evidence based outcome, the healthiest outcome will be produced (Silow-Caroll, 2007). We can reduce unnecessary time loss in ER care delivery by focusing on communication and patient understanding. This focus can be applied to all emergency care services to yield the best outcome (Silow-Caroll, 2007). 2. Data and Methods Indicator Selection
- 3. Quality indicator 1 measures the length of time that a patient has to wait to be seen, from the time they arrived in the ER to the time that they were sent home. This measure only applies to patients who were sent home after being seen. The high average for a hospital could mean that their ER does not have enough employees or that they are seeing too many patients. Quality indicator 2 shows the average time patients were in the ER from arrival to the time they were sent home. Lower numbers reflect efficiency of an ED, as it indicates that patients were being both seen then treated in a timely manner. Quality indicator 3 shows the average time patients spent in the ER but it doesn’t count the patients who just arrived the ER and went home. Long stays in an ER prior to a patient being admitted can be a clue that the ER are understaffed, beds are not available, or they are overcrowded. Quality indicator 4 shows that hospital ER that have a high volume of patients who leave without being seen usually do not have the resources to provide timely and effective ER care. This is important because patients who leave the ER without being seen may be seriously ill, putting themselves at higher risk for poor health outcomes; and these patients could return to the ER with a more serious illness or worse, die. Table 2 Quality Indicators Hospitals 1. Average time patients spent in the emergency department before they were seen by a healthcare professional 2. Average time patients spent in the emergency department before being sent home 3. Average time patients spent in the emergency department, before they were admitted to the hospital as inpatient 4. Percentage of patients who left the emergency department before being seen *Nationwide data 26 min 134 min 274 min 2% *Statewide (Texas) data 26 min 127 min 270 min 3% Texas Health Presbyterian 52 min 200 min 352 min 1% Baylor University Medical Center 50 min 239 min 405 min 4% Methodist Dallas Medical Center 43 min 212 min 369 min 5% Parkland 106 min 356 min 442 min 8% UT Southwestern 43 min 219 min 374 min 4% For quality indicator 1, “Average time patients spent in the ER before they were seen by a healthcare professional,” the national, and Texas statewide averages are both 26 minutes. Parkland hospital has the worst average time, at
- 4. 106 minutes, while Methodists Dallas Medical Center (MDMC) and UT Southwestern University Hospital (UTSUH) have the best times, at 43 minutes. The other two hospitals, Texas Health Presbyterian (THP) and Baylor University Medical Center (BUMC), have average times of 52 and 50 minutes, respectively. Quality indicator 2 found the average time that patients spent in the ED before being sent home. The national average time is 134 minutes and the Texas statewide average time is 127 minutes. All of the hospitals analyzed had average times above, both, the national and state average, with THP, MDMC, and UTSUH having the three lowest times, at 200,212, and 219 minutes. While Parkland hospital and BUMC had the longest times of 356 and 239 minutes, respectively. The third quality indicator found the average time patients spent in the ER before being admitted as an inpatient. The national average time is 274 minutes and the statewide average is 270 minutes. Patients at Parkland hospital have to wait an average 442 minutes, while BUMC patients have a 405-minute average wait time. UTSUH, MDMC, and THP have the lowest average times of 374, 369, and 352 minutes, respectively. The fourth and final quality indicator, which found the percentage of patients who left the ED before being seen, THP, at 1%, was the only hospital with a percentage below the nationwide and statewide averages of 2 and 3%, respectively. BUMB and UTSUH both had 4% of their patients who left before being seen, while Parkland and MDMC had the highest percentage of patients who left, at 8 and 5%, respectively. 3. Results THP has twice the national and state average length of time spent in the ER before a patient was seen by a healthcare professional. However, they had the lowest percentage of patients who left before being seen. THP and MDMC, the only non-level 1 trauma centers of the 5 hospitals analyzed, both had the lowest average time spent in the ER before being sent home. This could be due to the fact that they are treating patients with lower level of trauma compared to the other 4 hospitals, meaning that even if takes more time for patients to be seen, less time to be actually treated. BUMC and Parkland hospital both have wait times substantially longer than the national average wait time in the ER before a patient is seen and they have the two highest average times spent in the ER before being admitted to the hospital. Both hospitals have the largest ER patient inflow as well as a low patient volume to number of patient room ratio, suggesting the possibility that overcrowding could be an issue. Though BUMH and UTSUH are level 1 trauma centers and have similar outcomes for most of the quality measurements, BUMH has over 3 times the ER patient volume. This could indicate that UTSUH is less efficient than BUMH. Based on the data collected for MDMC, it is determined that they are consistent in being average, relative to the other hospitals analyzed. Their quality outcomes matched what would be expected based on their organizational information.
- 5. Table 3 Organizational Information Hospital # of patie nt room s Location Trauma Level Ownership # of ER visits # of employees in clinic Texas Health Presbyterian 56 Dallas III Non-Profit 42,000 3000+ Baylor University Medical Center 74 Dallas I Non-Profit 115,239 4,750 Methodist Dallas Medical Center 59 Dallas II Non-Profit 60,259 2,828 Parkland Hospital 108 Dallas I Government 142,000 10,000+ UT Southwestern Medical Center 28 Dallas I Government 36,000 13,800+ Table 4 Hospital Mission Texas Health Presbyterian “To improve the health of the people in the communities we serve” Baylor UniversityMedical Center “Baylor Scott & White Health exists to serve all people by providing personalize health and wellness through exemplary care, education and research as a Christian ministry of healing.” Methodist Dallas Medical Center “To improve and save lives through compassionate quality health care.” Parkland Hospital “Dedicated to the health and well-being of individuals and communities entrusted to our care.” UT Southwestern “To improve health care in our community, Texas, our nation, and the world through innovation and education.” 4. Discussion Conclusion Overall the data collected and analyzed verifies the hypothesis that hospitals in the same geographic area serving the same population can have varying degrees of quality. Of the five Dallas hospitals assessed, Texas Health Presbyterian had the best quality outcomes in comparison to the national and state averages. Some ways for hospitals to improve their quality outcomes in ED
- 6. could be more effective communication between clinicians, clerical workers, and patients, as well as improvements to their structure and processes in the ER. Reference ACEP. (2014). Efficiency in the Emergency Department. Retrieved from http://www.acep.org/content.aspx?id=29876 Anthony Komaroff. (2013). What are the qualities of a good emergency medicine doctor? - Ask Doctor K - Ask Doctor K. Retrieved from
- 7. http://www.askdoctork.com/what-are-the-qualities-of-a-good-emergency- medicine-doctor-201310225559 Baylor Health Care System. (2014).Emergency Care and Trauma. (n.d.). Retrieved from http://www.baylorhealth.com/PhysiciansLocations/Dallas/SpecialtiesServic es/EmergencyCare/Pages/Default.aspx Capp, R., Rooks, S., Wiler, J., Zane, R., & Ginde, A. (2014). National Study of Health Insurance Type and Reasons for Emergency Department Use. JGIM: Journal Of General Internal Medicine, 29(4), 621-627. doi:10.1007/s11606-013-2734-4 Derlet RW, Richards JR. (2002). Emergency department overcrowding in Florida, New York, and Texas. South Med J 2002;95:846–9. Jon Mark Hirshon, Nicholas Risko, Emilie JB Calvello, Sarah Stewart de Ramirez, Mayur Narayan, Christian Theodosis, Joseph O’Neill & for the Acute Care Research Collaborative at the University of Maryland Global Health Initiative. (2012). Health systems and services: the role of acute care. Retrived from http://www.who.int/bulletin/volumes/91/5/12- 112664/en/ Lucas, R., Parley, H., Twanmoh, J., Urumov, A., Evans, B., & Olsen, N. (2009). Measuring the Opportunity Loss of Time Spent Boarding Admitted Patients in the Emergency Department: A Multihospital Analysis. Journal Of Healthcare Management, 54(2), 117-125. Lewin Group (for the American Hospital Association). (2002). Emergency
- 8. department overload: a growing crisis. The results of the American Hospital Association Survey of Emergency Department (ED) and Hospital Capacity. Falls Church, VA: American Hospital Association. Lynn SG, Kellermann AL. (1991). Critical decision-making: managing the emergency department in an overcrowded hospital. Ann Emerg Med 1991;20:287–92. Methodist Dallas Medical Center. (2014). Emergency Room and Level I Adult Trauma Center. Retrieved from http://www.methodisthealthsystem.org/dallasemergency Parkland Health & Hospital System. (2014). Retrieved from http://www.parklandhospital.com/phhs/emergency-care.aspx S Trzeciak & E P Rivers. (2003). Emergency department overcrowding in the United States: an emerging threat to patient safety and public health. Retrived from http://emj.bmj.com/content/20/5/402.short Silow-Carroll, S., Alteras, T., & Meyer, J. A. (2007). Hospital quality improvement: Strategies and lessons from US hospitals. USA: Commonwealth Fund. Texas Department of State Health Services. (2014). Texas Trauma Facilities. Retrieved from https://www.dshs.state.tx.us/emstraumasystems/etrahosp.shtm Texas Health Presbyterian Hospital Dallas. (2014). Retrieved from http://www.texashealth.org/body.cfm?id=4683
- 9. The University of Texas Southwestern Medical Center. (2014). Emergency Care: UTSW Medicine. Retrieved from http://www.utswmedicine.org/conditions- specialties/emergency/