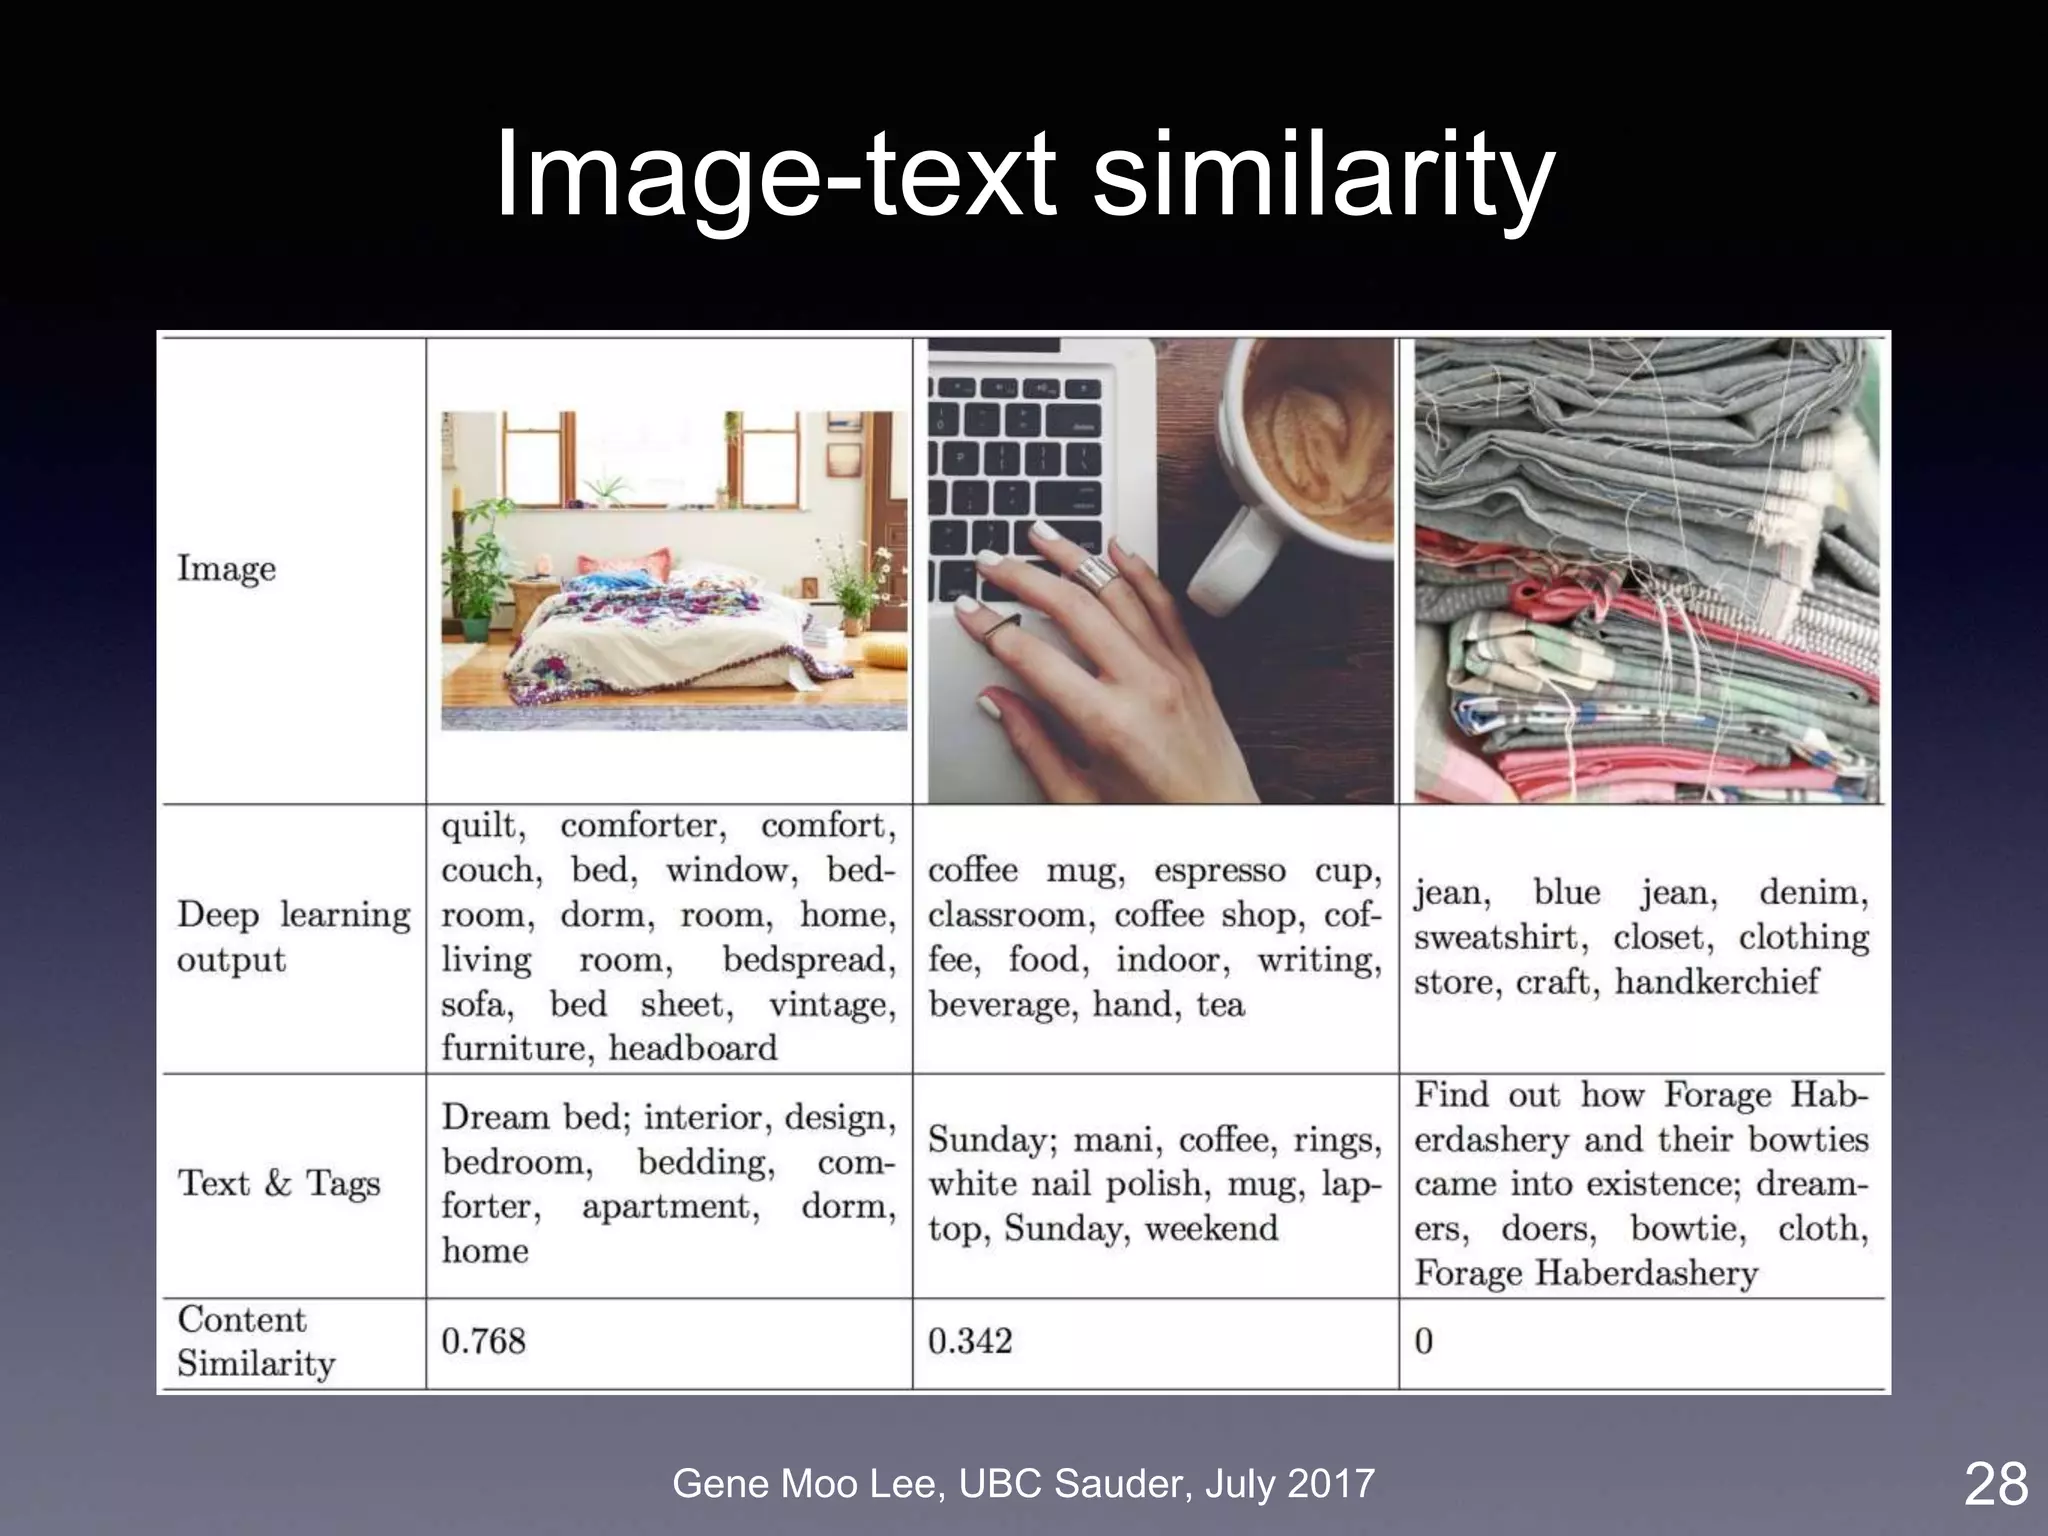
Downloaded 13 times


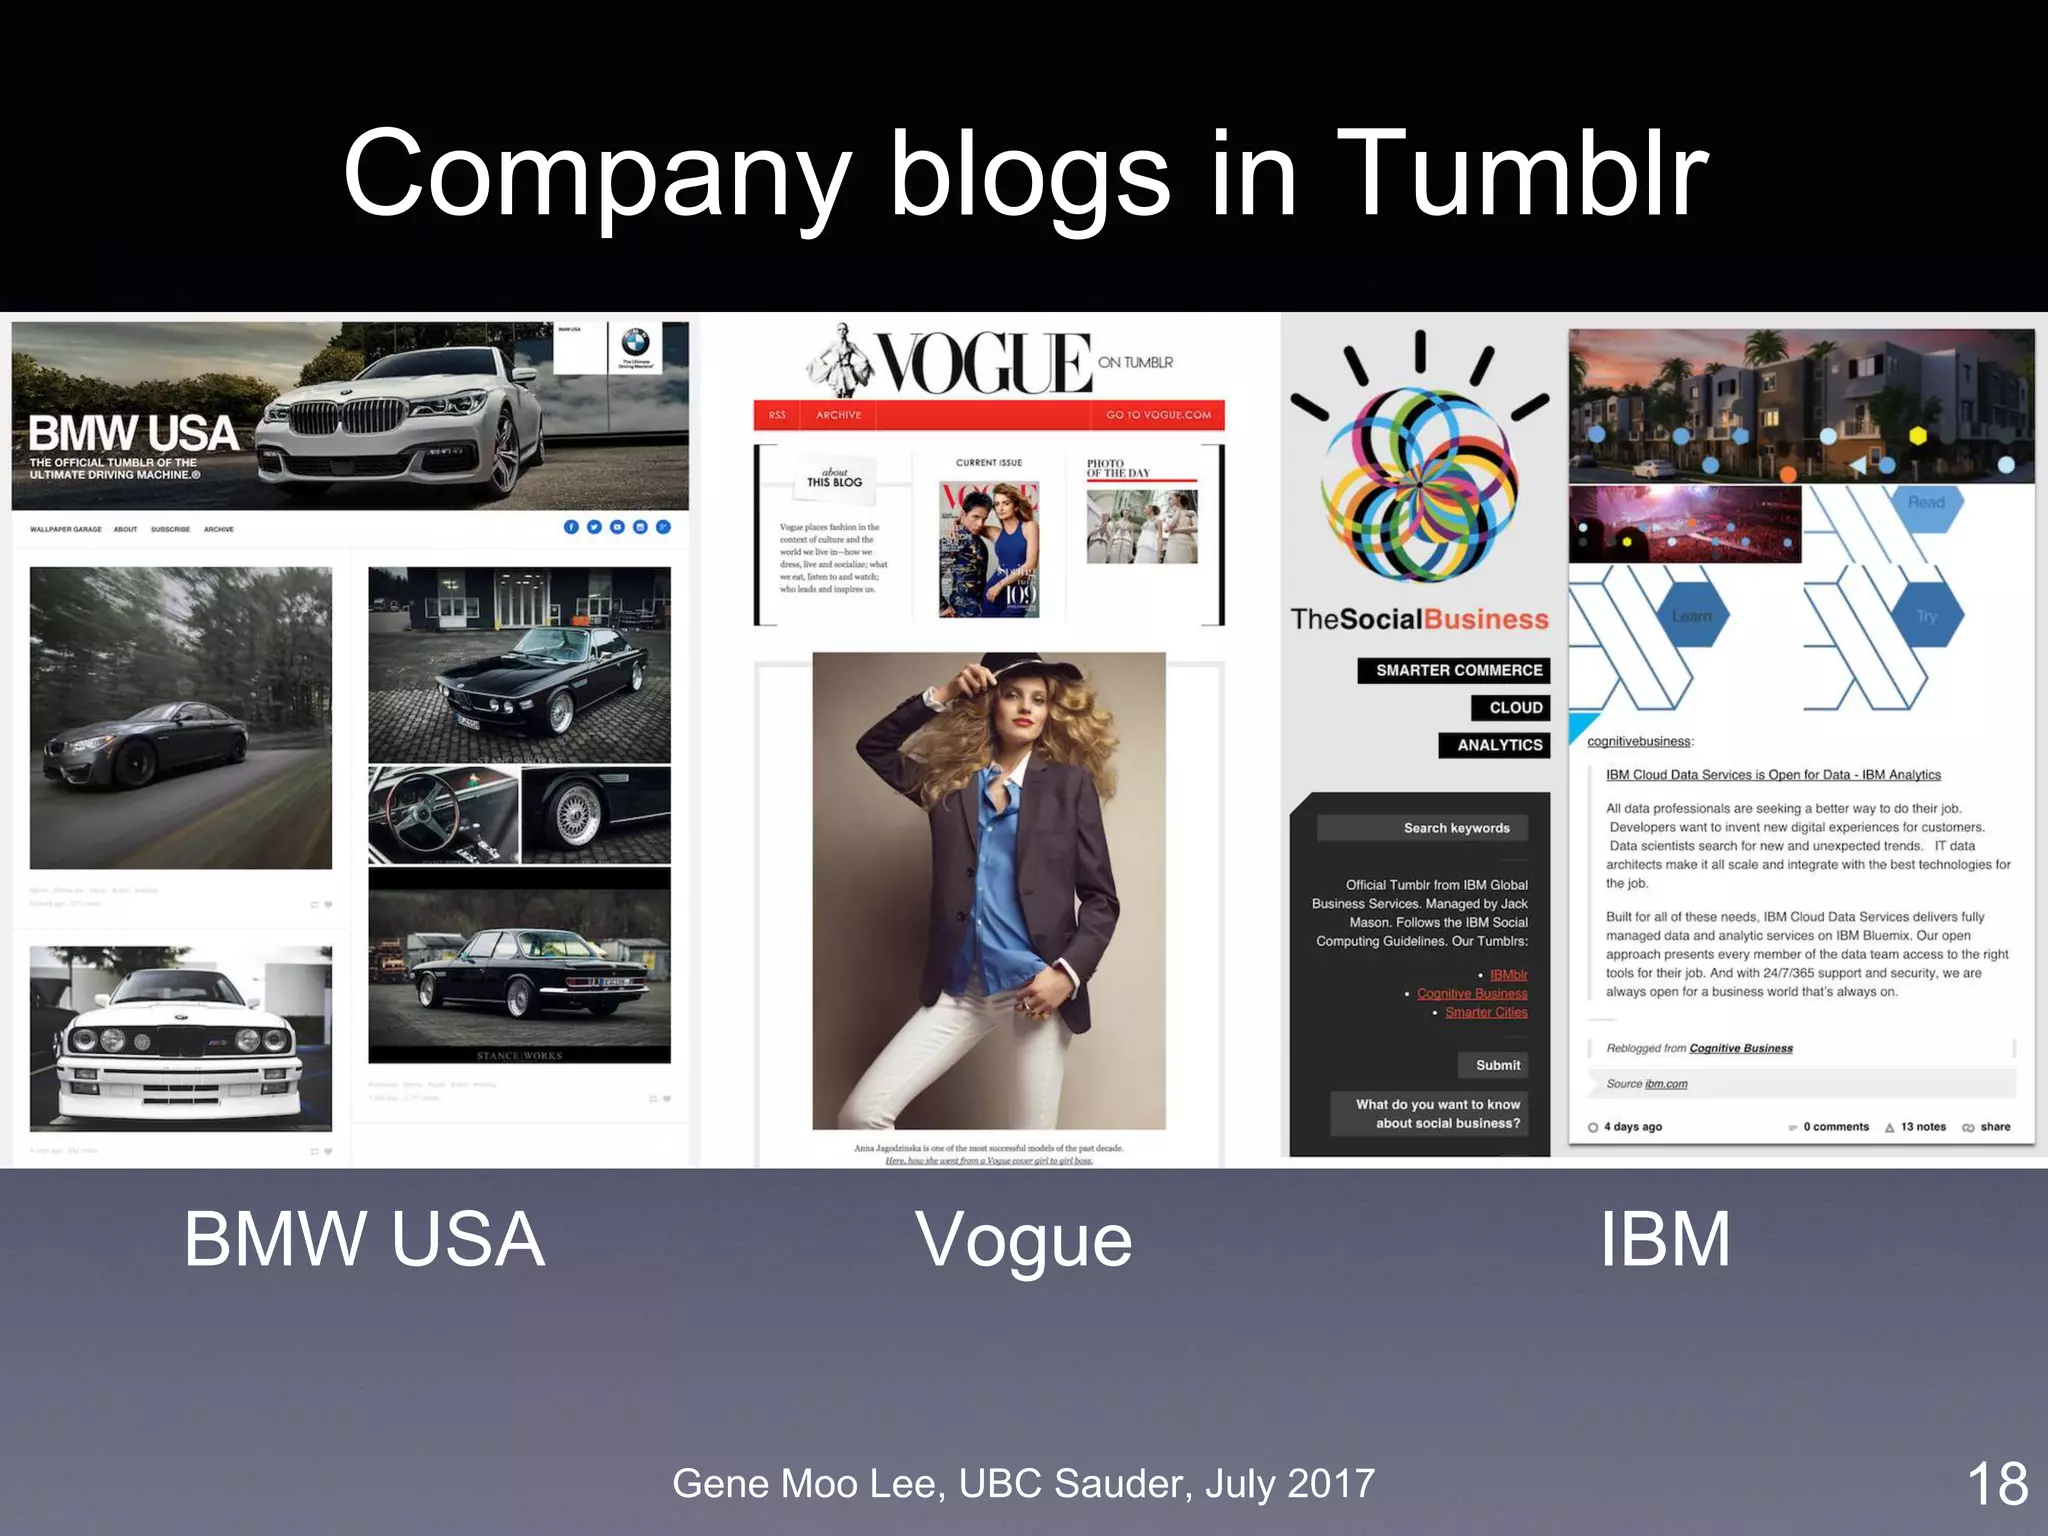
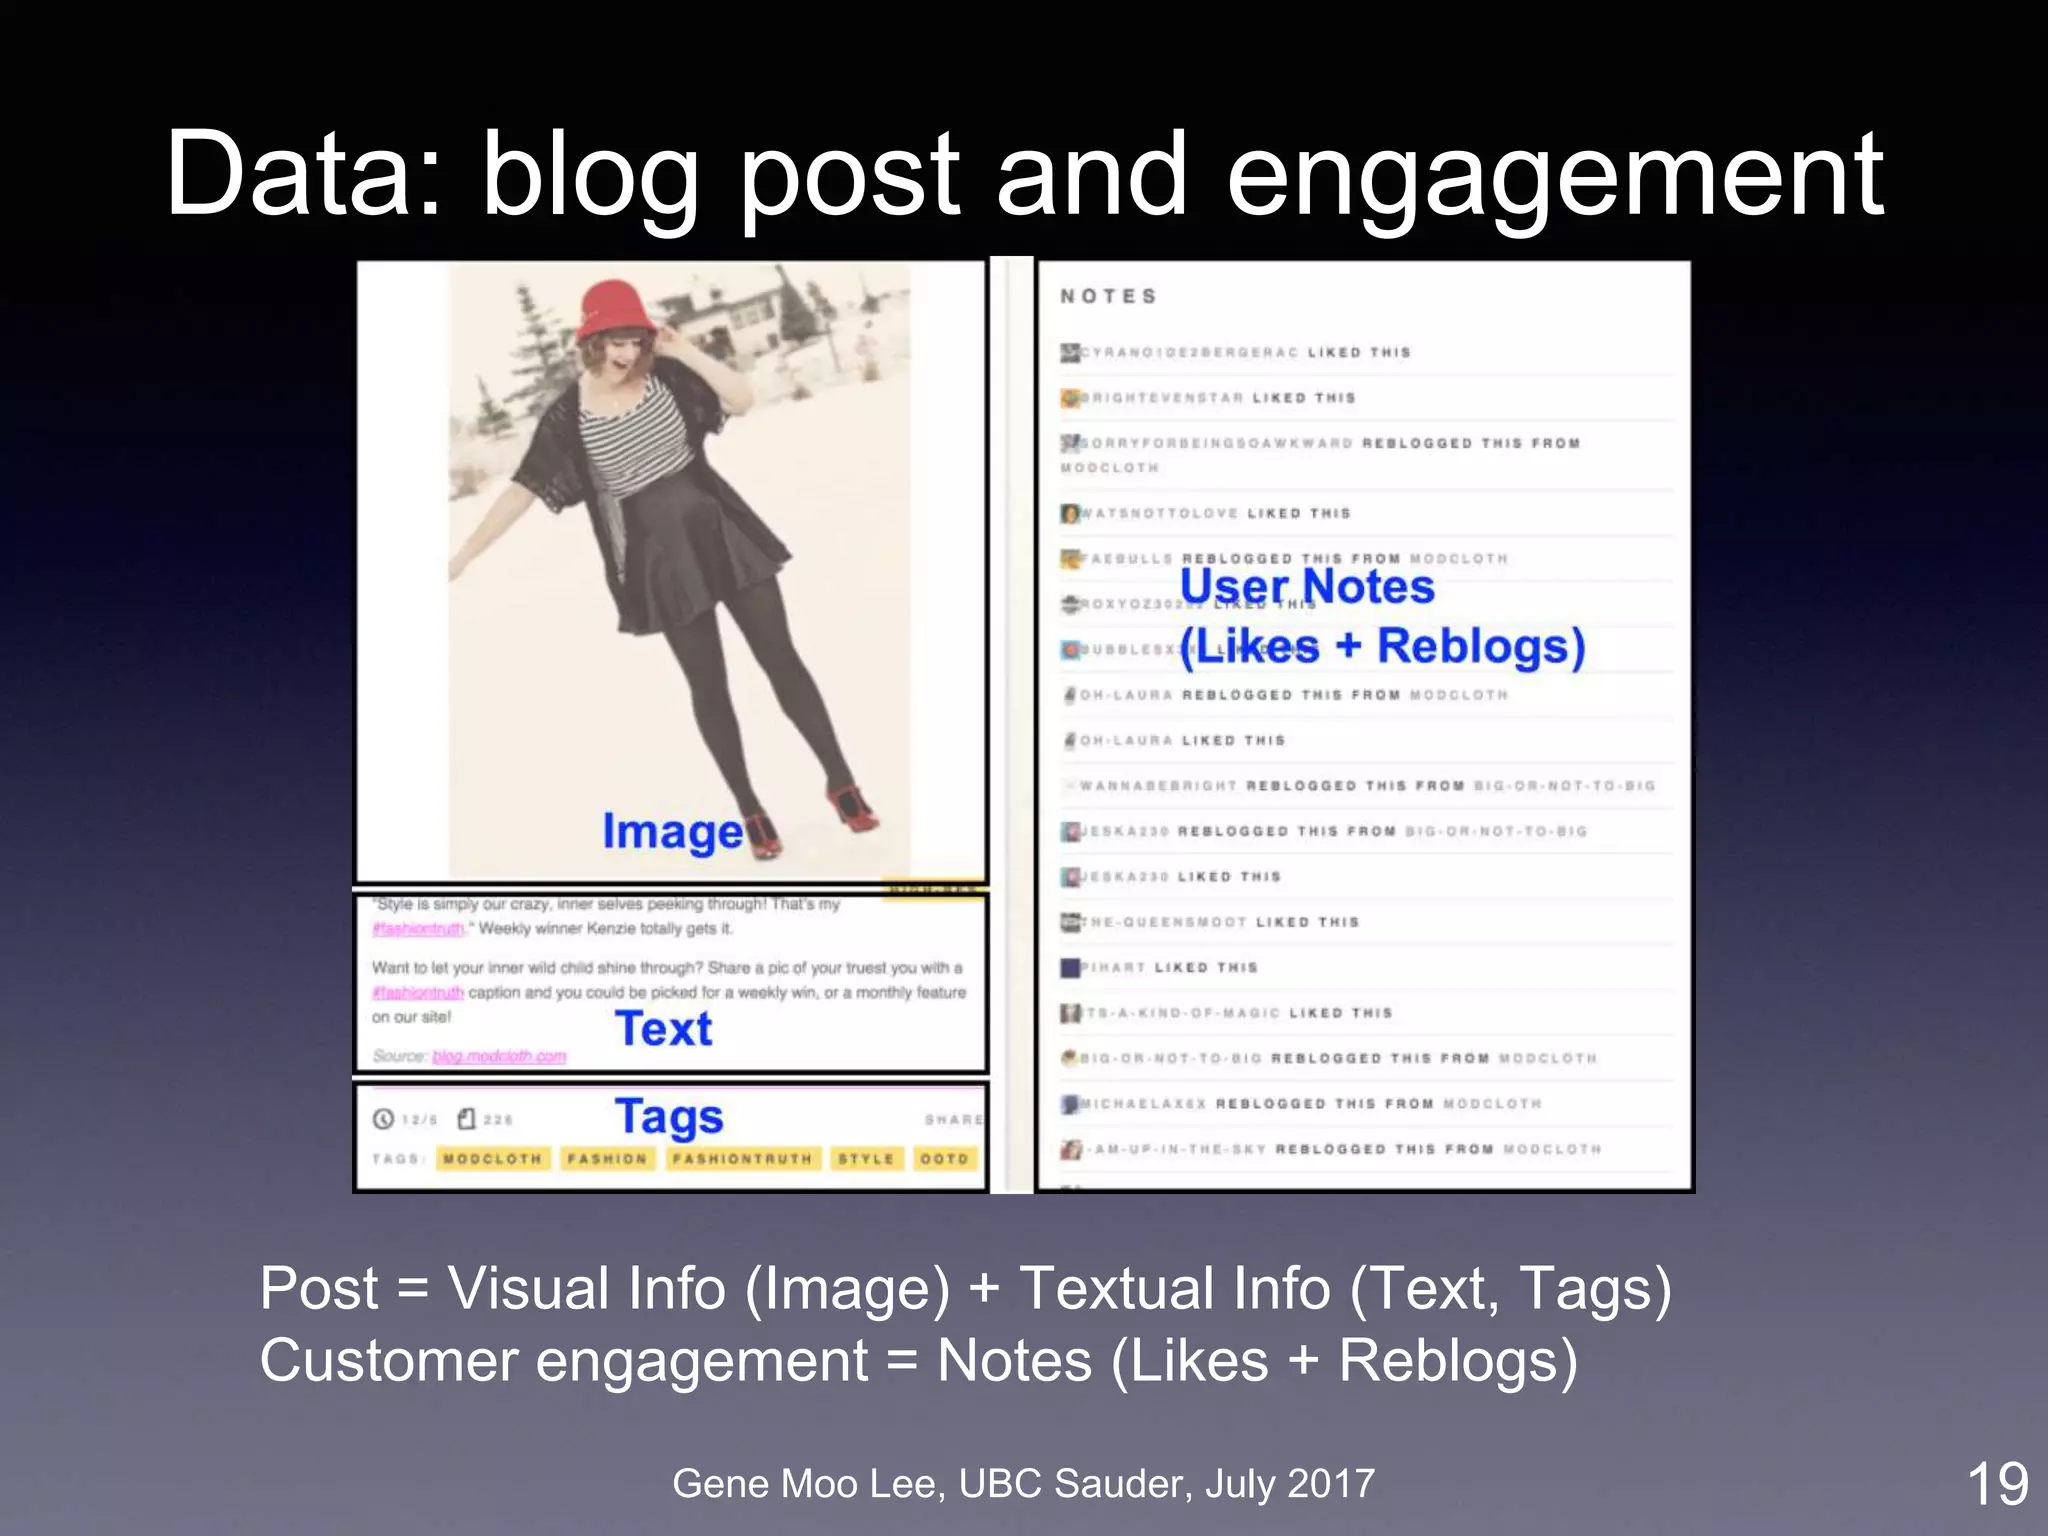

![Gene Moo Lee, UBC Sauder, July 2017
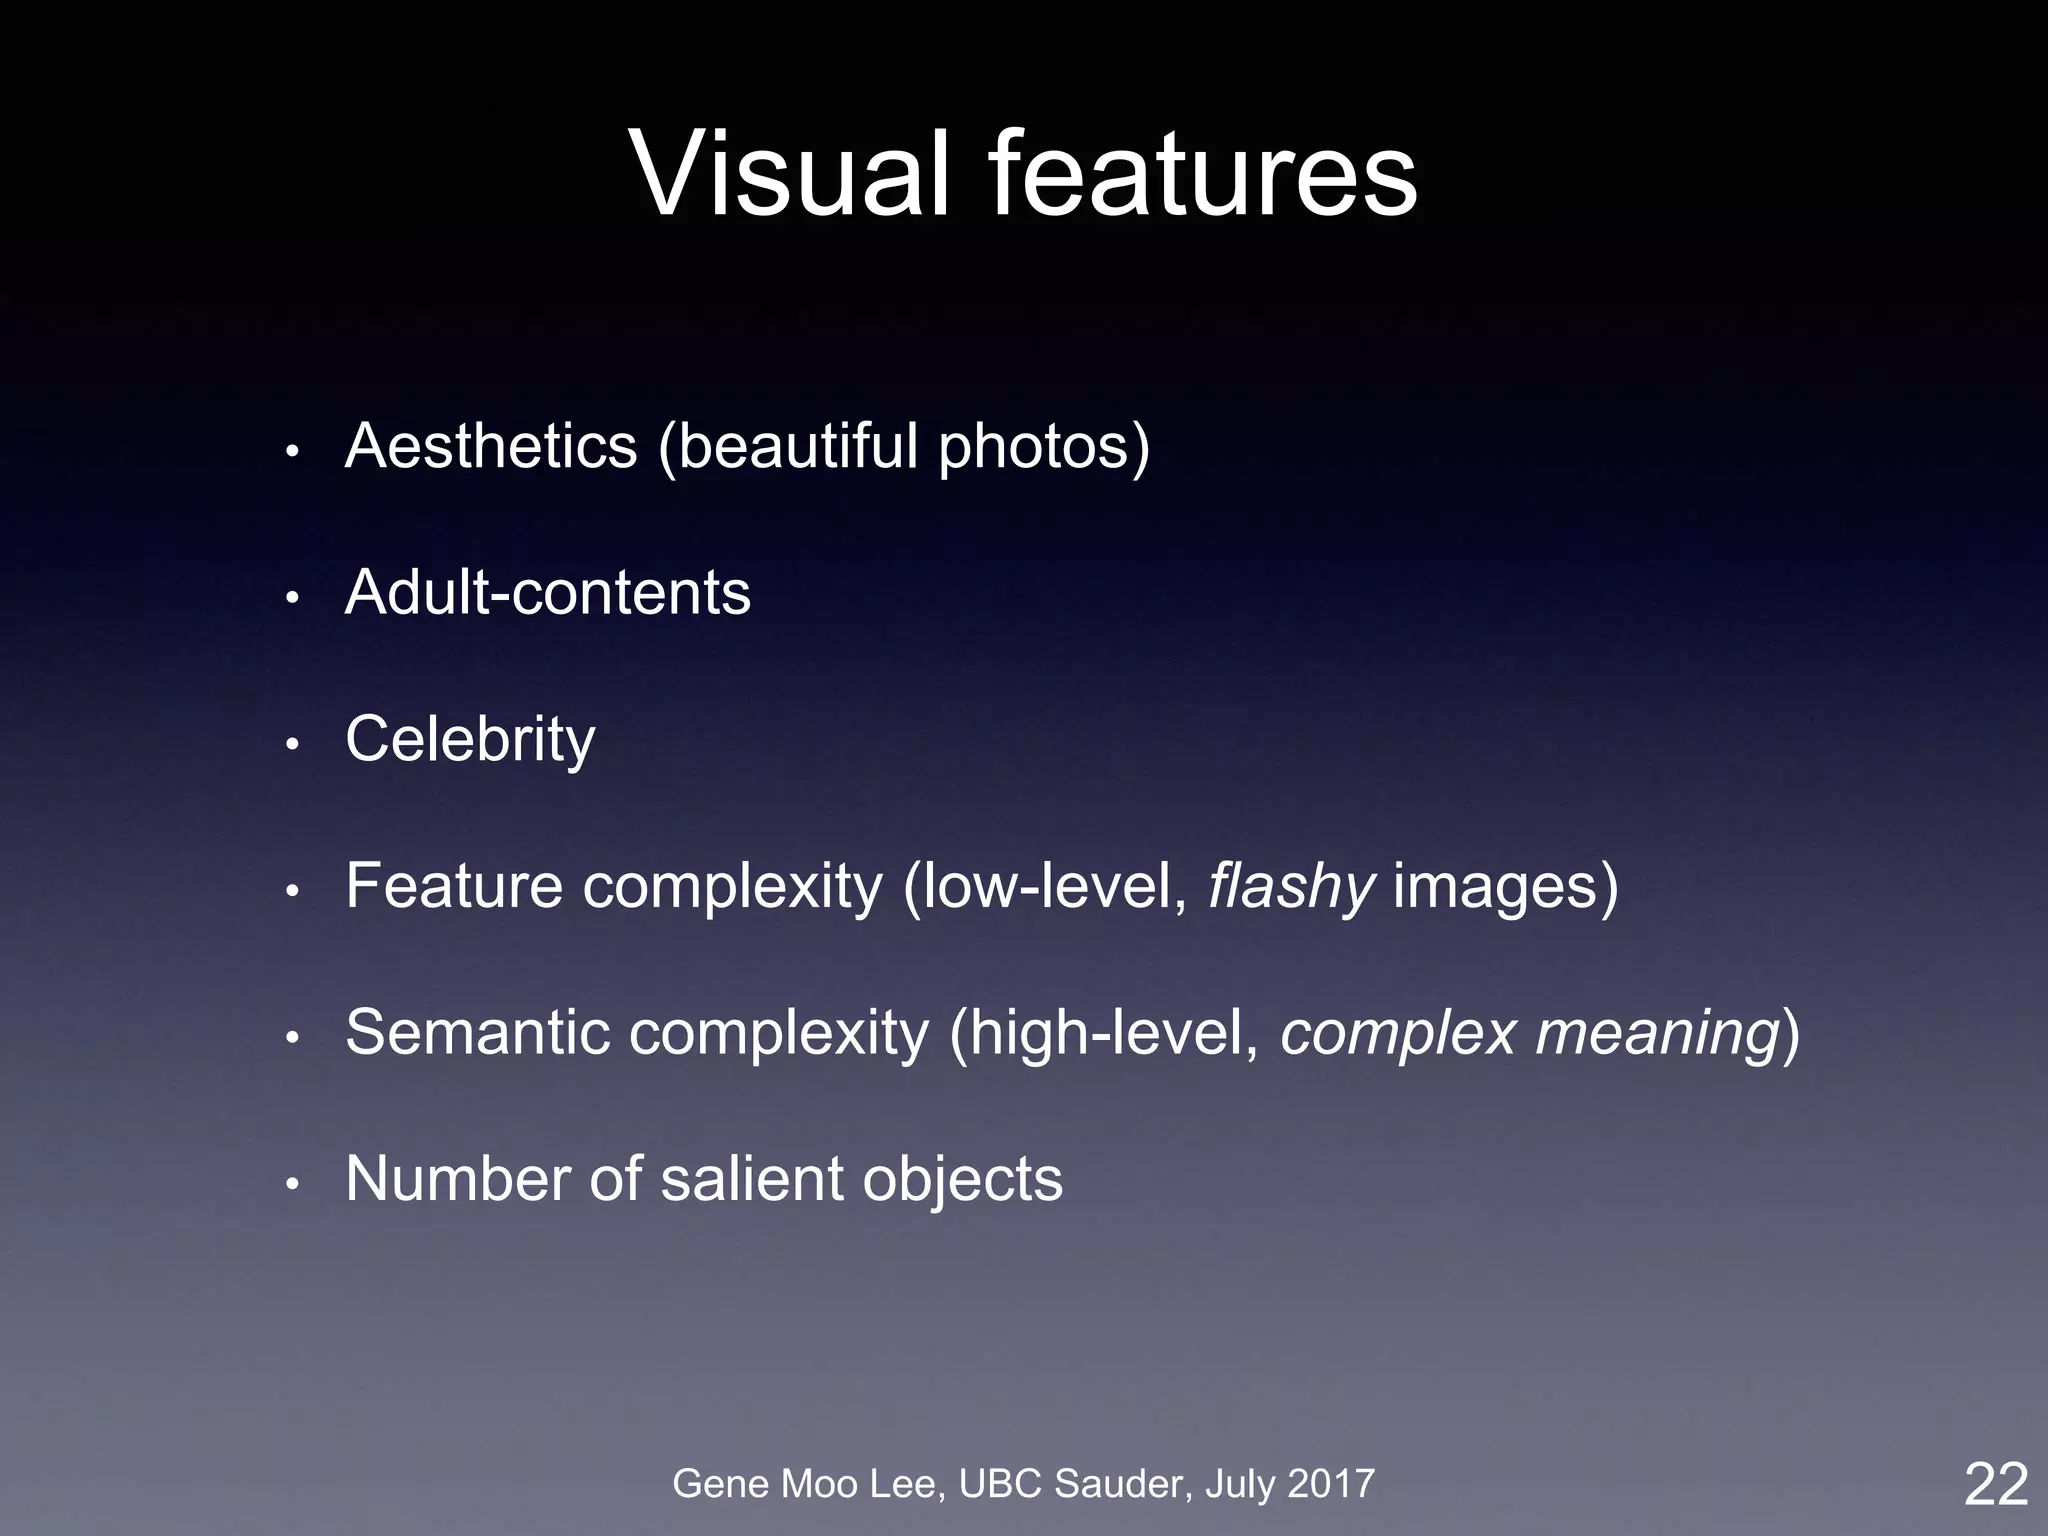
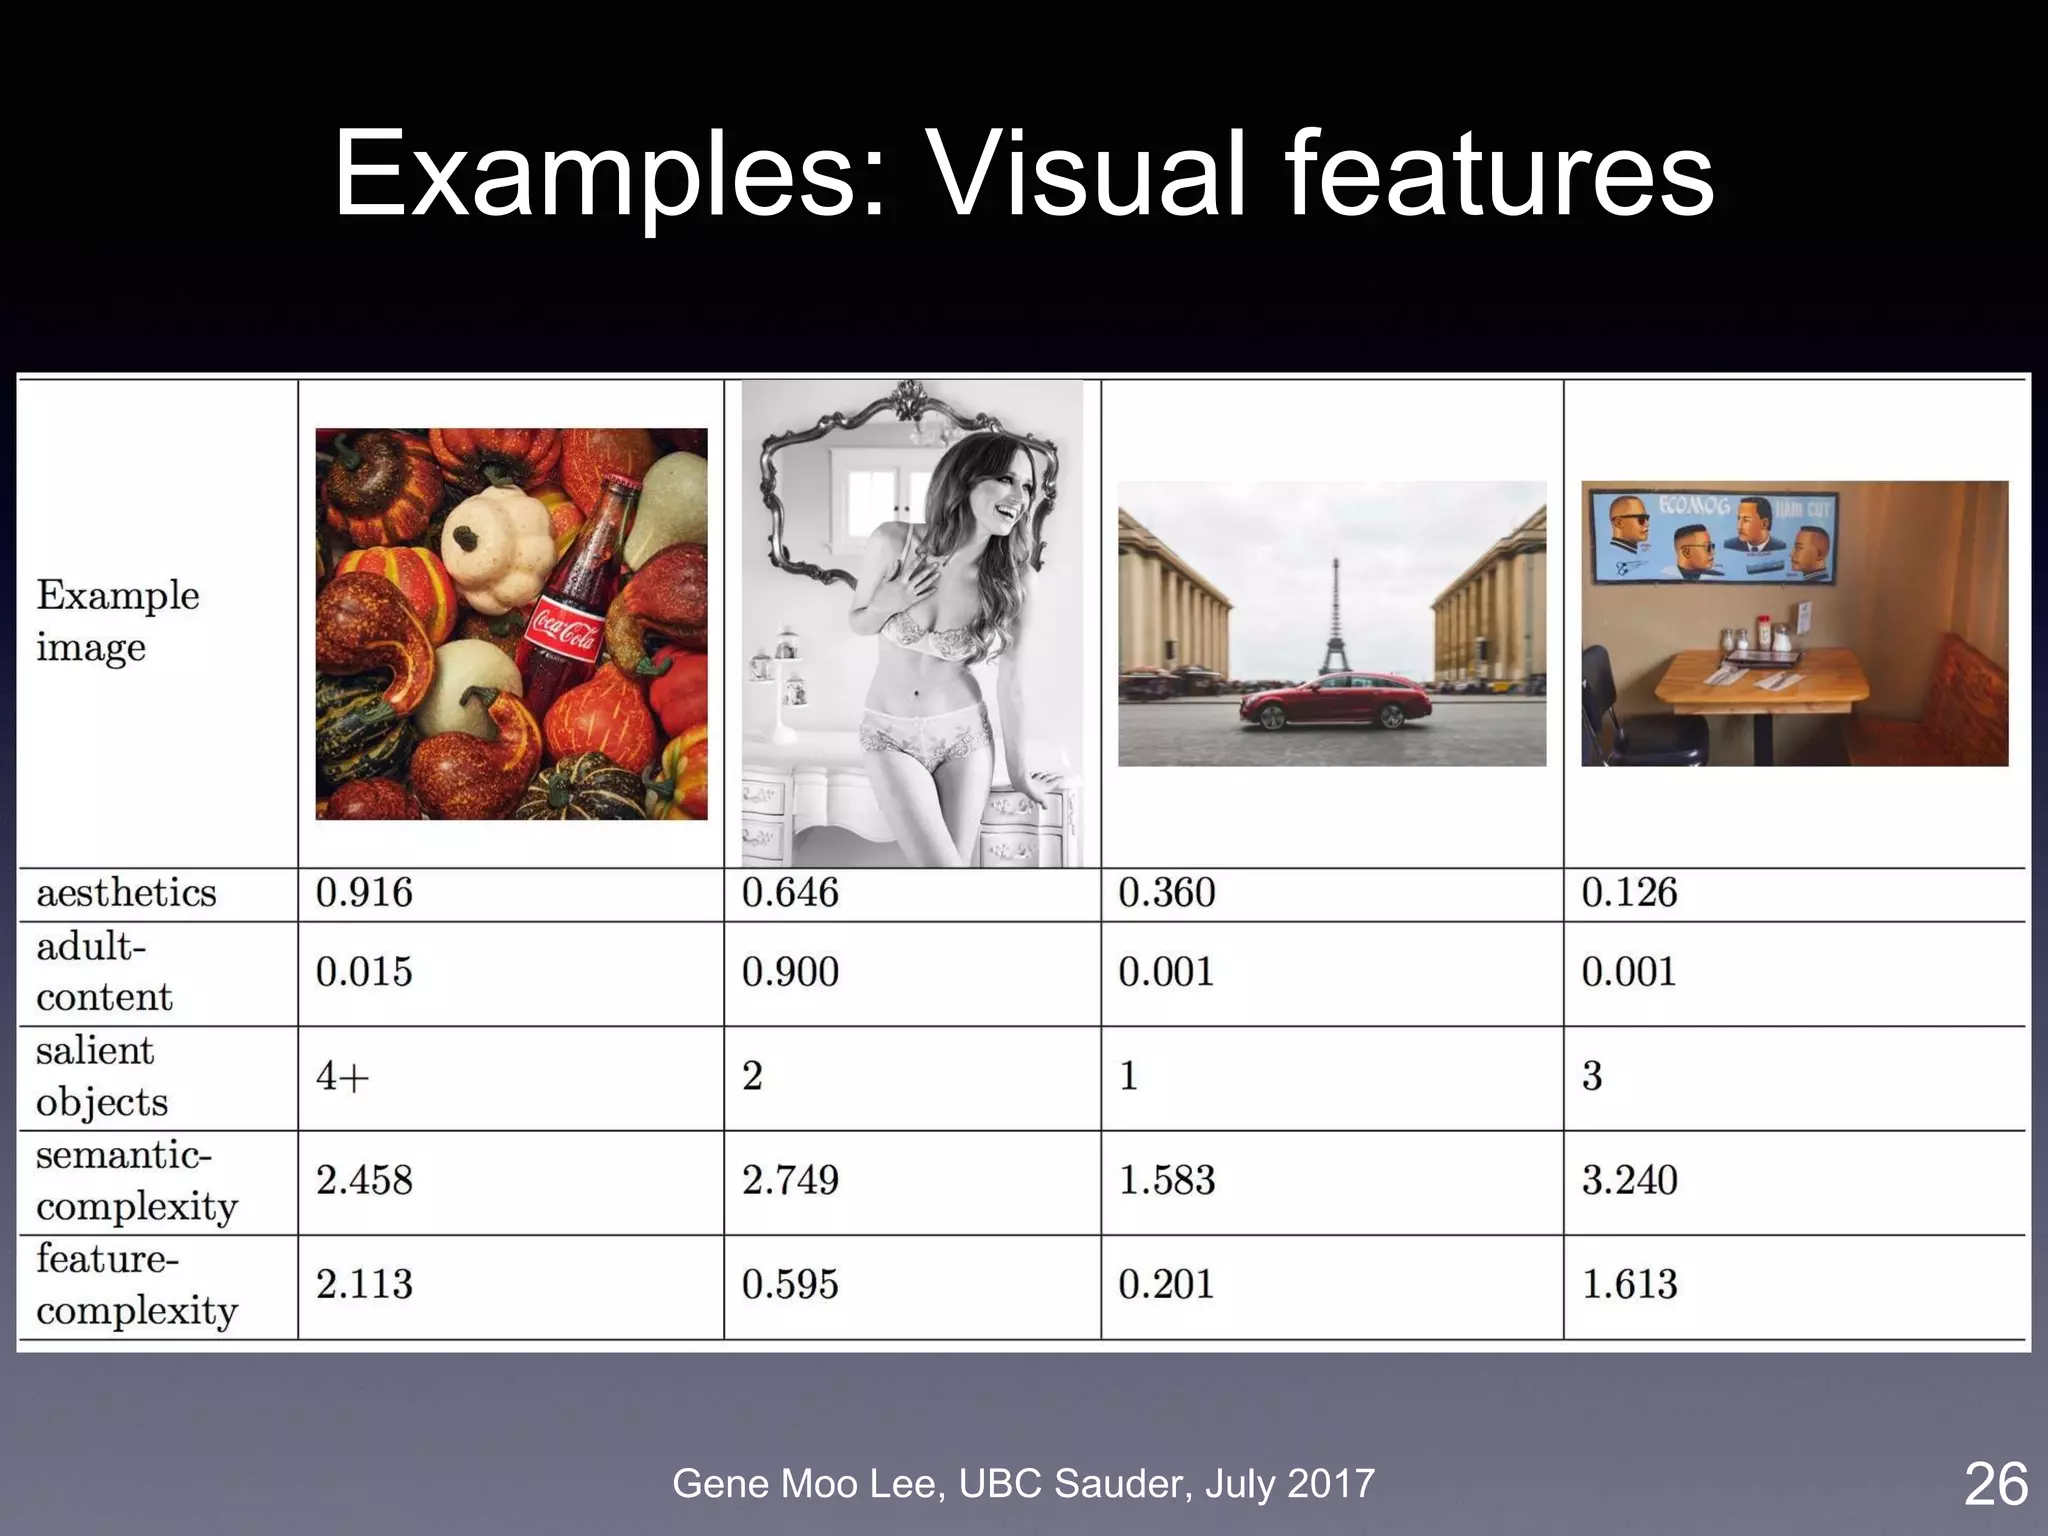
More visual features
• 7th-layer output = robust representation of the image for “computer vision” tasks
• Aesthetic/beauty score [Dhar et al. 2011 (CVPR, Vision)]
• Adult-content score [Sengamedu et al. 2011 (MM, Vision)]
• Celebrity (450 celebrities) [Parhki et al. 2015 (BMV, Vision)]
• Number of salient objects [Zhang et al. 2015 (CVPR, Vision)]
25](https://image.slidesharecdn.com/20170731ubc-170731214632/75/Towards-Advanced-Business-Analytics-using-Text-Mining-and-Deep-Learning-25-2048.jpg)
![Gene Moo Lee, UBC Sauder, July 2017
Empirical results
• [+] GIF, Beautiful/Adult images, Celebrity,
More images, Consistent image and text
• [-] Video, Semantic complexity, More
sentences, Questions, Asking Reblog
• Industry-specific results: e.g., adult images
only work for Fashion
• Different short and long term effects
• Different in hedonic and utilitarian products
29](https://image.slidesharecdn.com/20170731ubc-170731214632/75/Towards-Advanced-Business-Analytics-using-Text-Mining-and-Deep-Learning-29-2048.jpg)

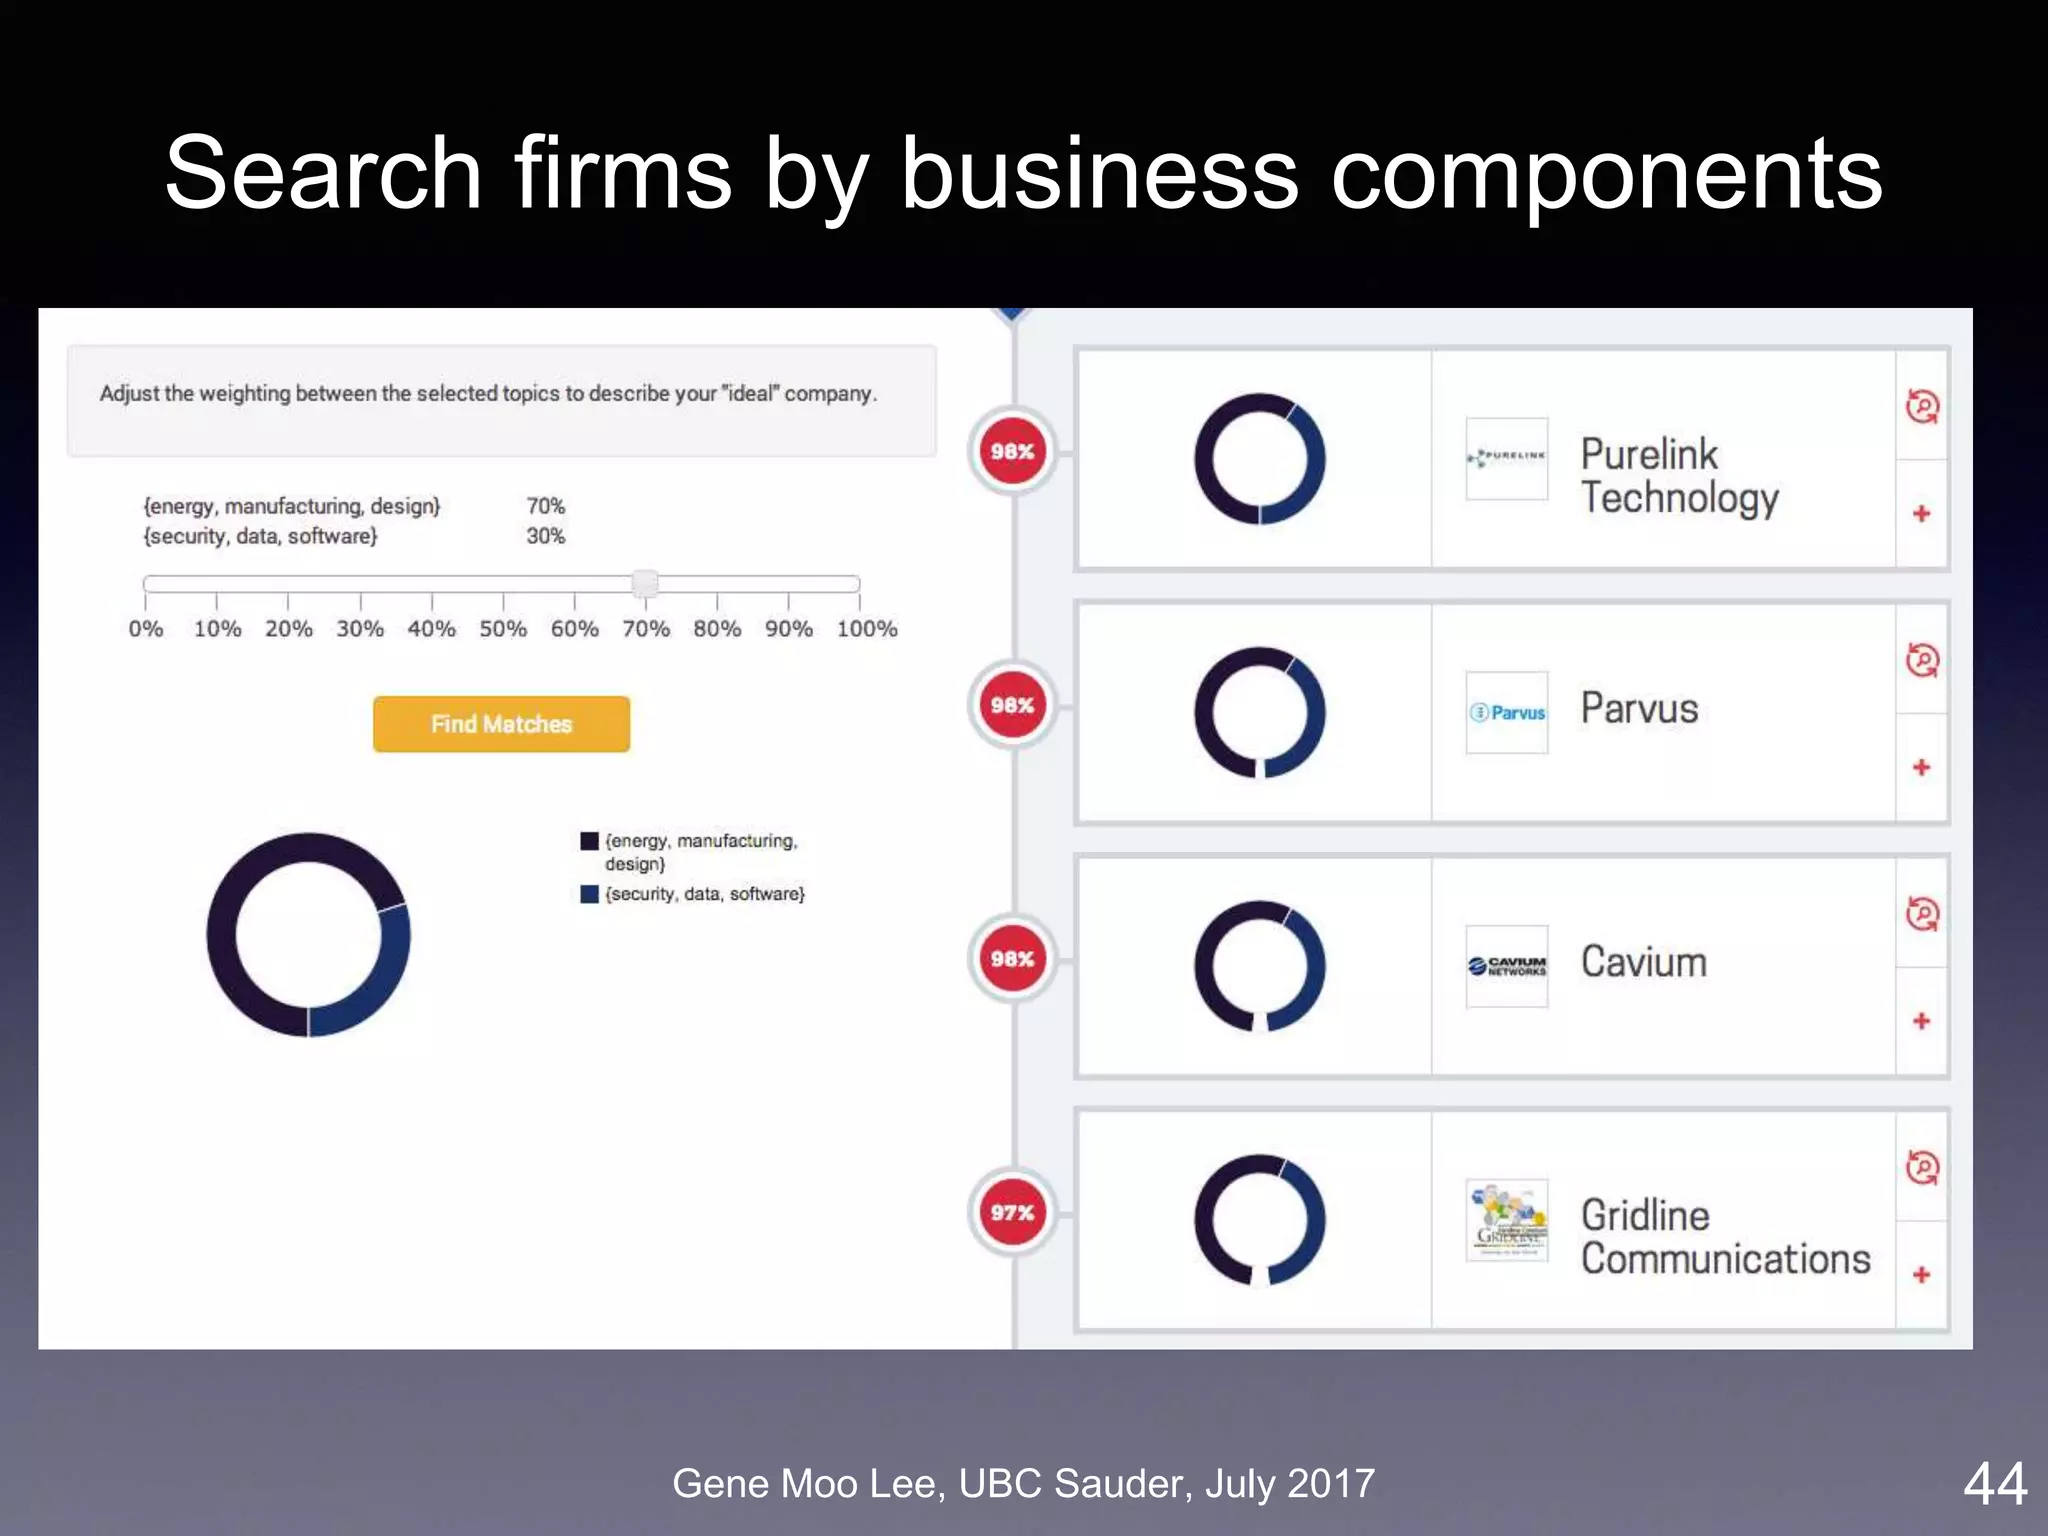
![Gene Moo Lee, UBC Sauder, July 2017
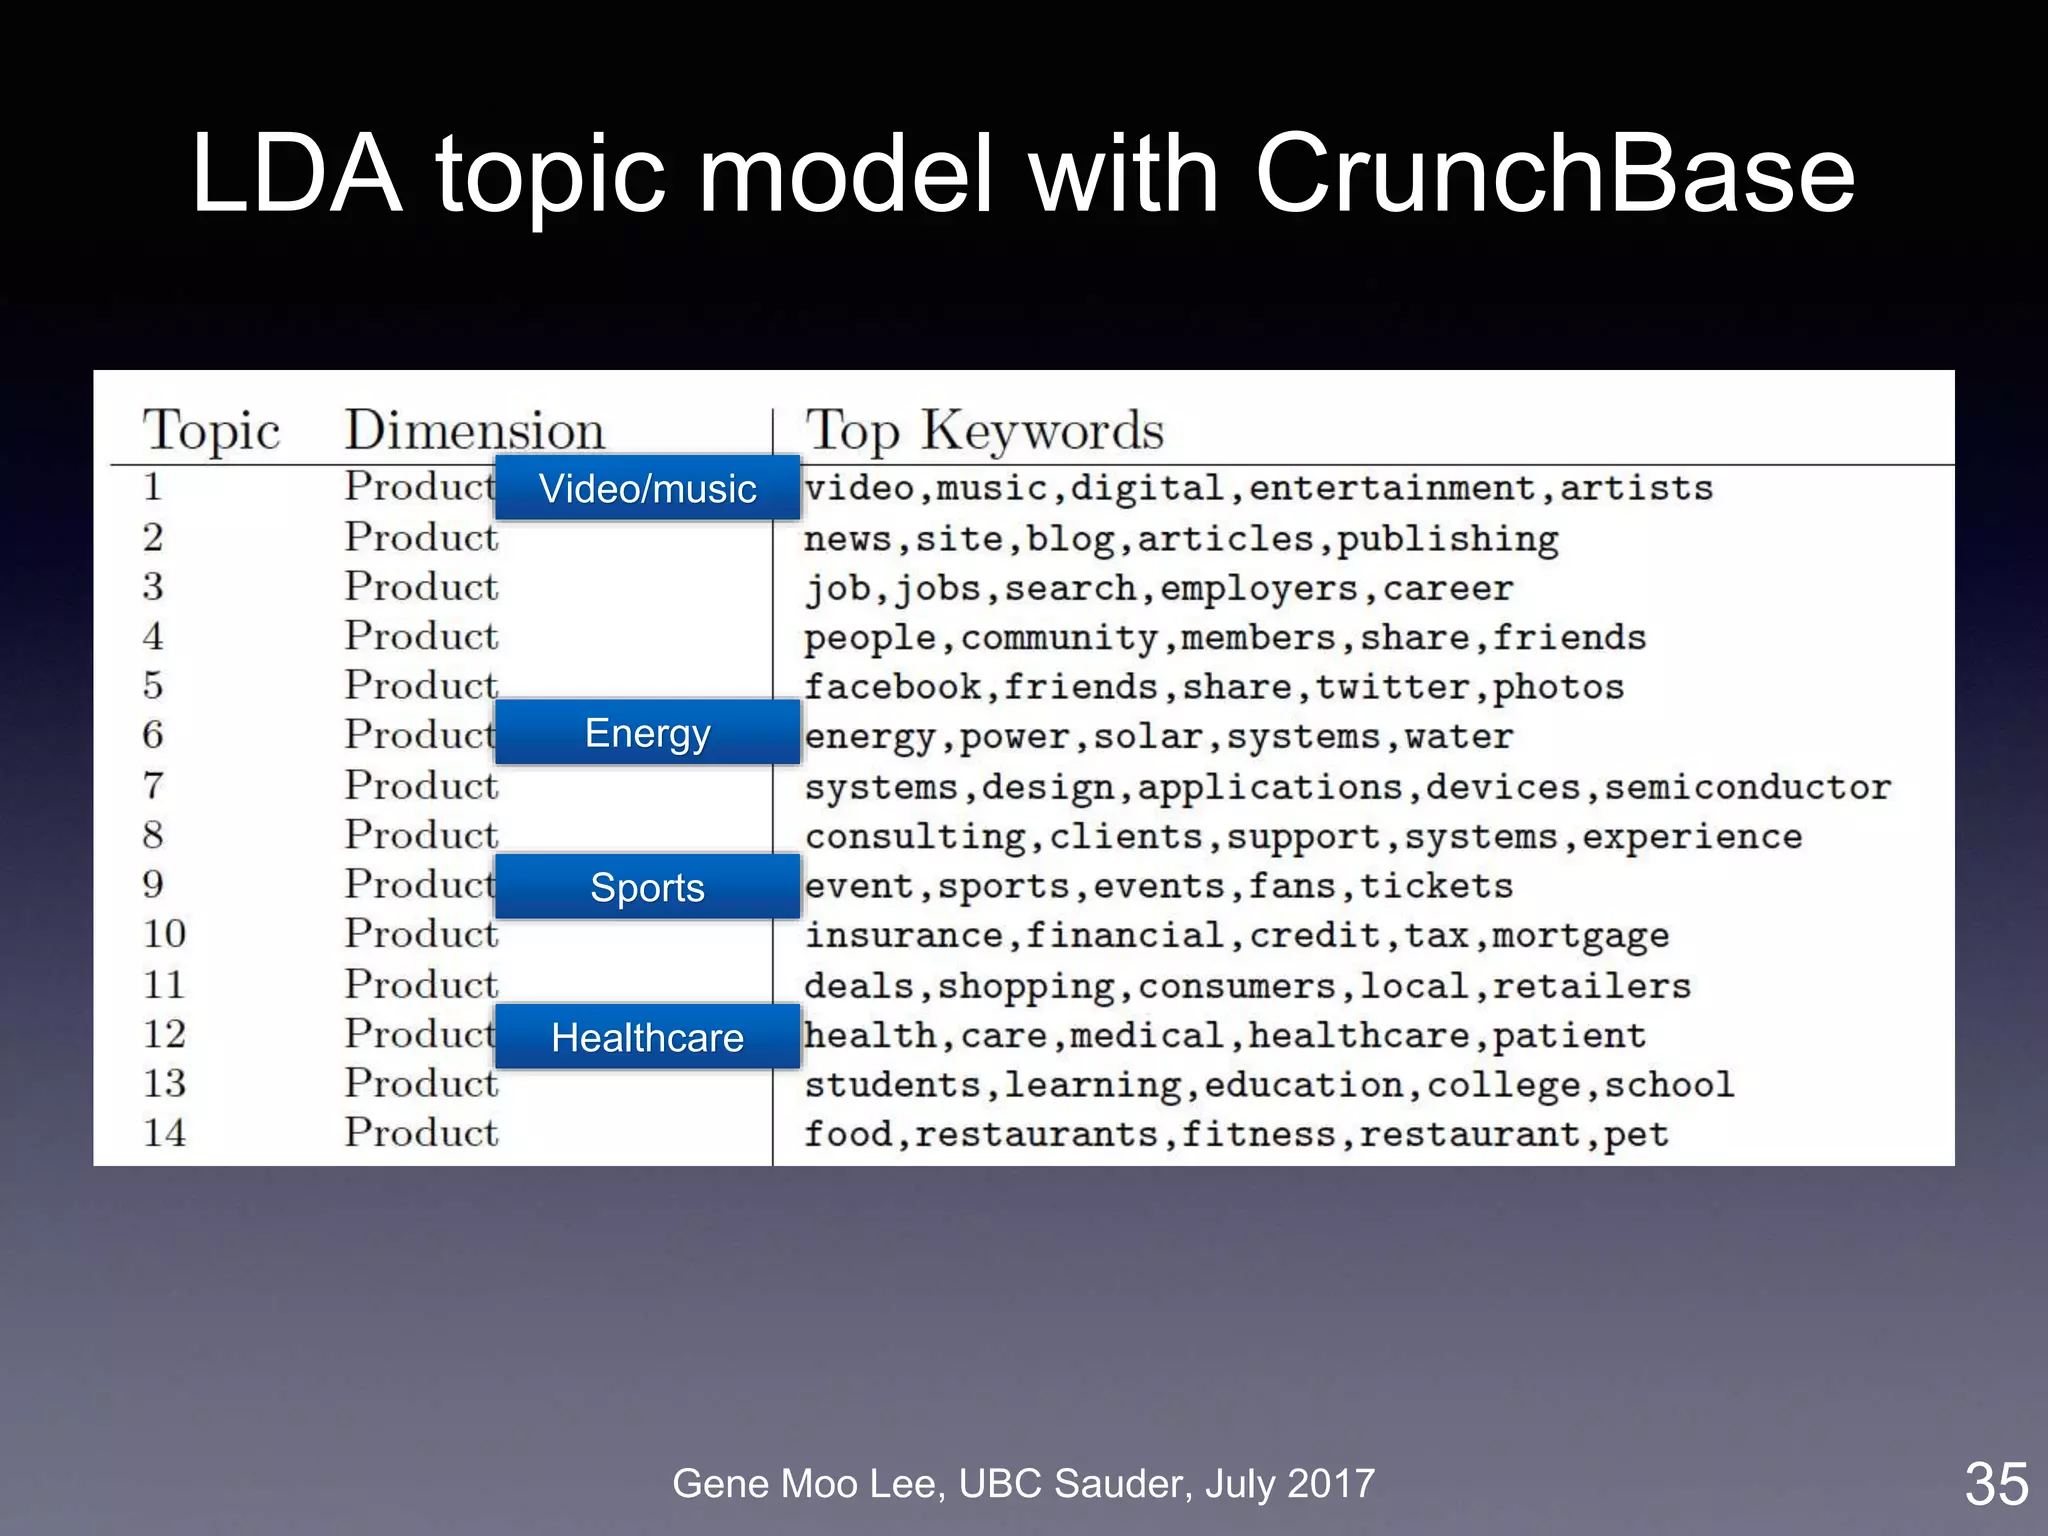
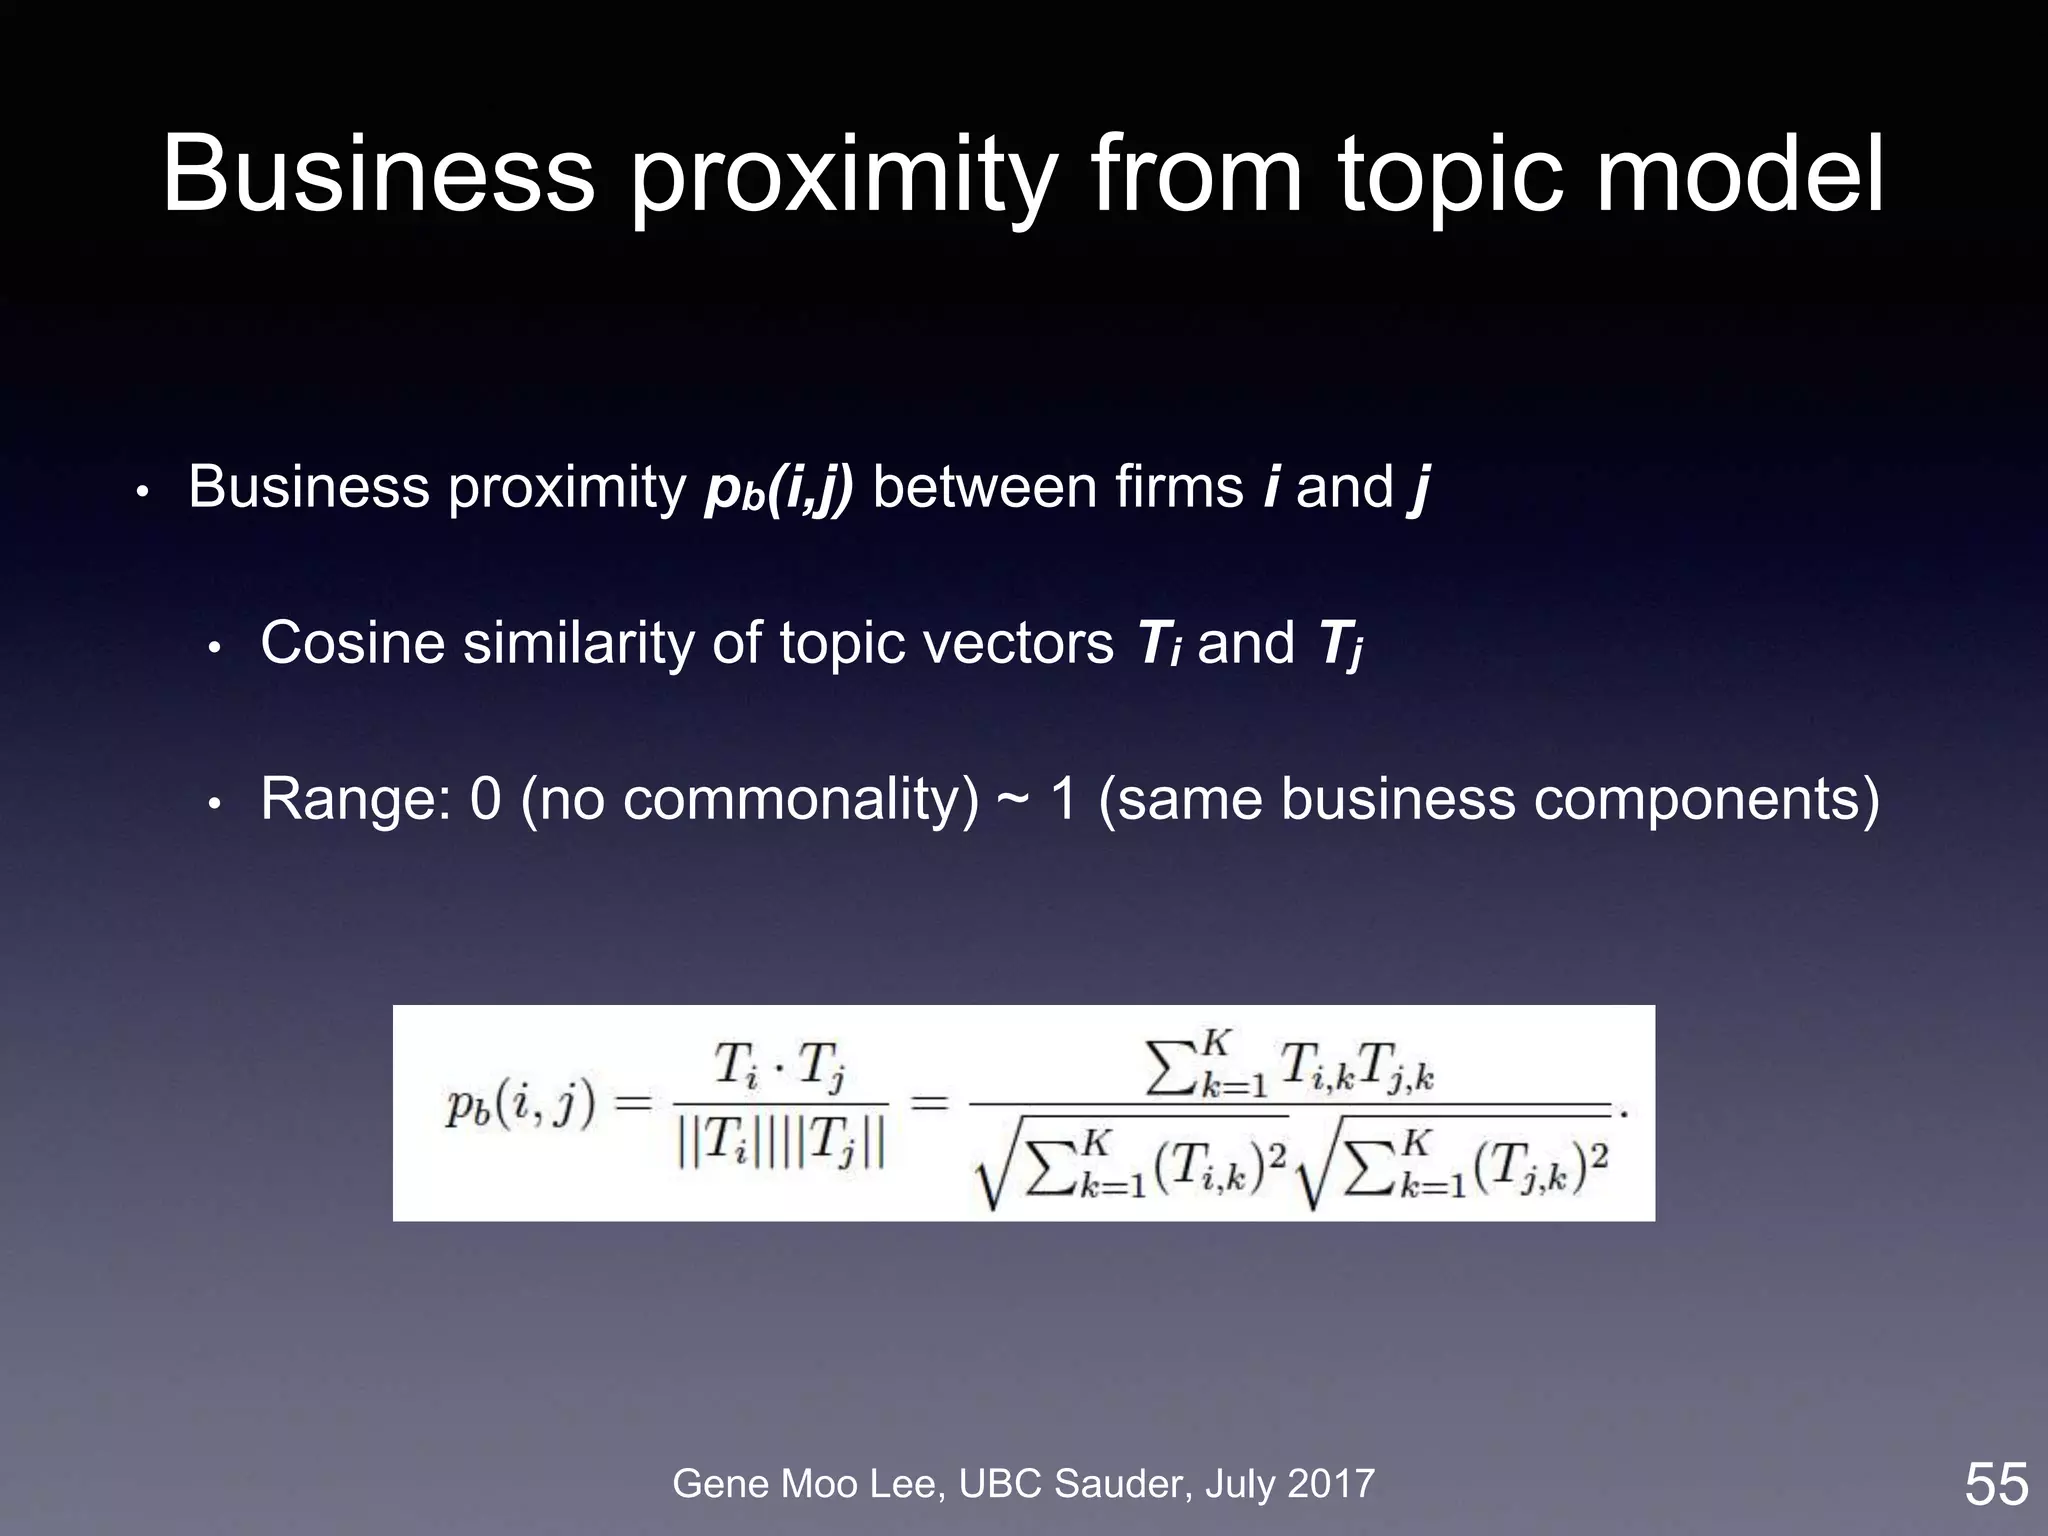
Our approach on business proximity
• Approach: LDA topic modeling [Blei et al. 2003]
• Unsupervised learning to discover latent “topics” from a large
collection of documents
• Business proximity = cosine similarity of topic distributions
33
LDA
Industry-wide topics
Company’s topics
Company
descriptions](https://image.slidesharecdn.com/20170731ubc-170731214632/75/Towards-Advanced-Business-Analytics-using-Text-Mining-and-Deep-Learning-33-2048.jpg)
![Gene Moo Lee, UBC Sauder, July 2017
ERGM for M&A network
ERGM (Exponential Random Graph Model):
• Based on random graph [Erdos and Renyi 1959]
• Probability of realizing a graph = a function of the graph’s
statistics [Robins et al. 2007]
• Inter-firm proximity: business, geographic, social, co-invest
• Selective mixing: 50 states, 30 industry sectors
• Degree distribution: node degree, M&A experiences
38
degree selective mixing proximity](https://image.slidesharecdn.com/20170731ubc-170731214632/75/Towards-Advanced-Business-Analytics-using-Text-Mining-and-Deep-Learning-38-2048.jpg)

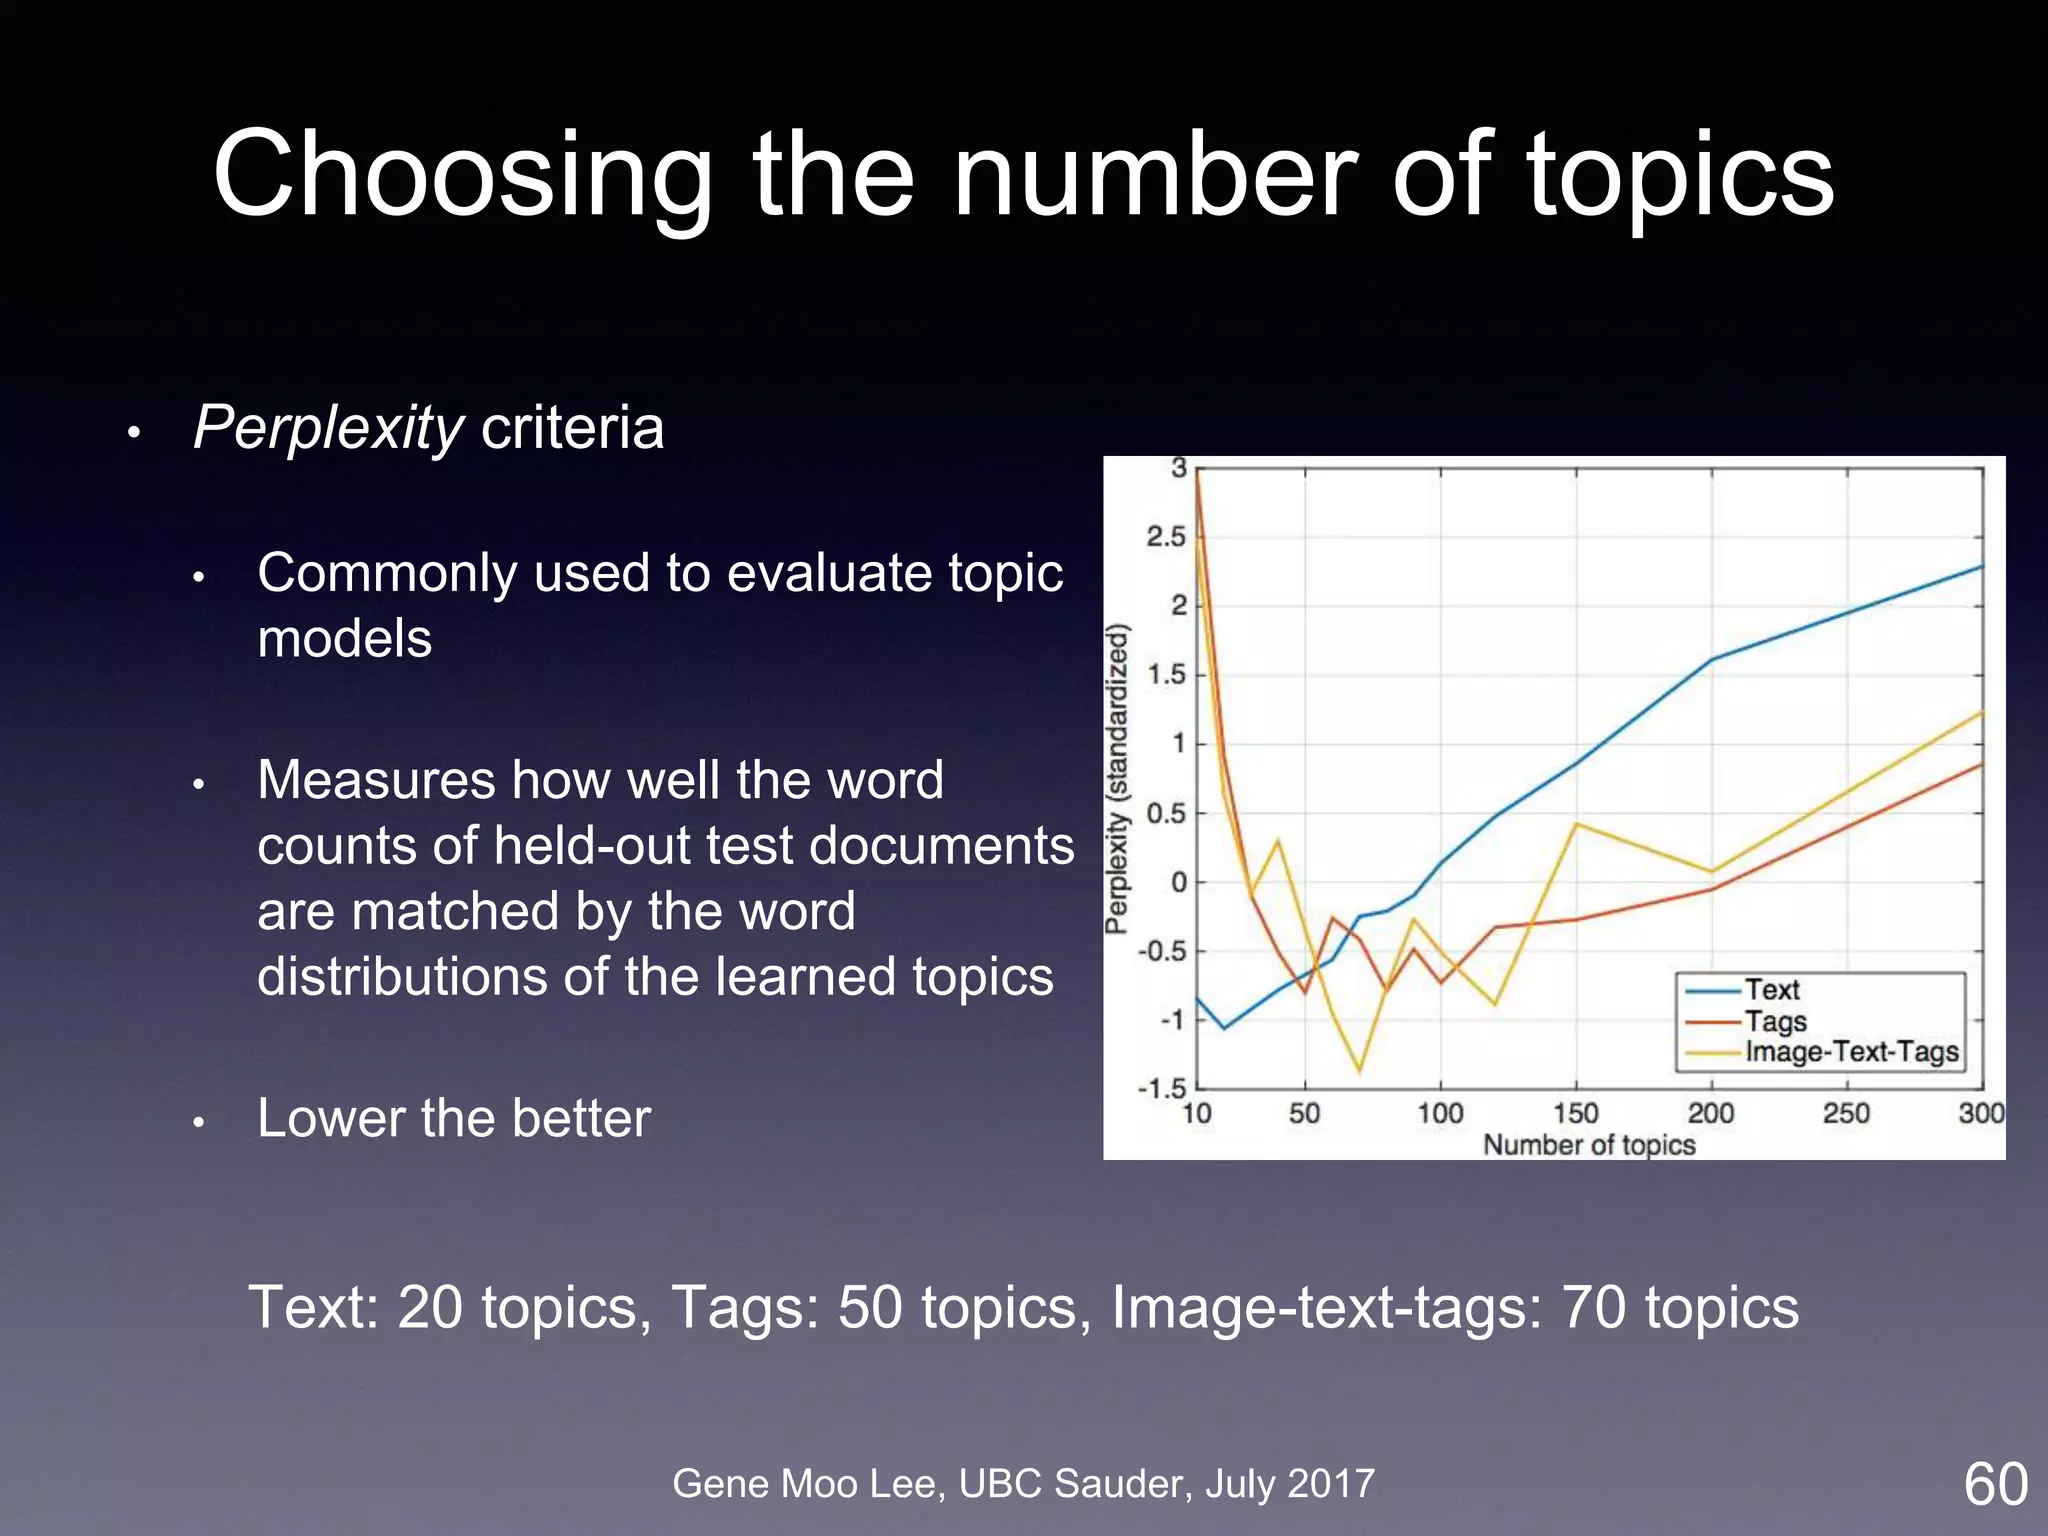
![Gene Moo Lee, UBC Sauder, July 2017
Topic models and topic complexity
• Apply Latent Dirichlet Allocation (LDA) on text and tags in blog
posts [Blei et al. 2003]
1. Whole text collection (bag of words, word sequence doesn’t
matter) is described by topics
2. Each topic is a set of related keywords
3. Each post is represented by a topic vector
• Input: 33,686 blog posts
• Output: d topics, d-dimensional vector for each post
56LDA results](https://image.slidesharecdn.com/20170731ubc-170731214632/75/Towards-Advanced-Business-Analytics-using-Text-Mining-and-Deep-Learning-56-2048.jpg)
![Gene Moo Lee, UBC Sauder, July 2017
Word2vec: Word embedding
57
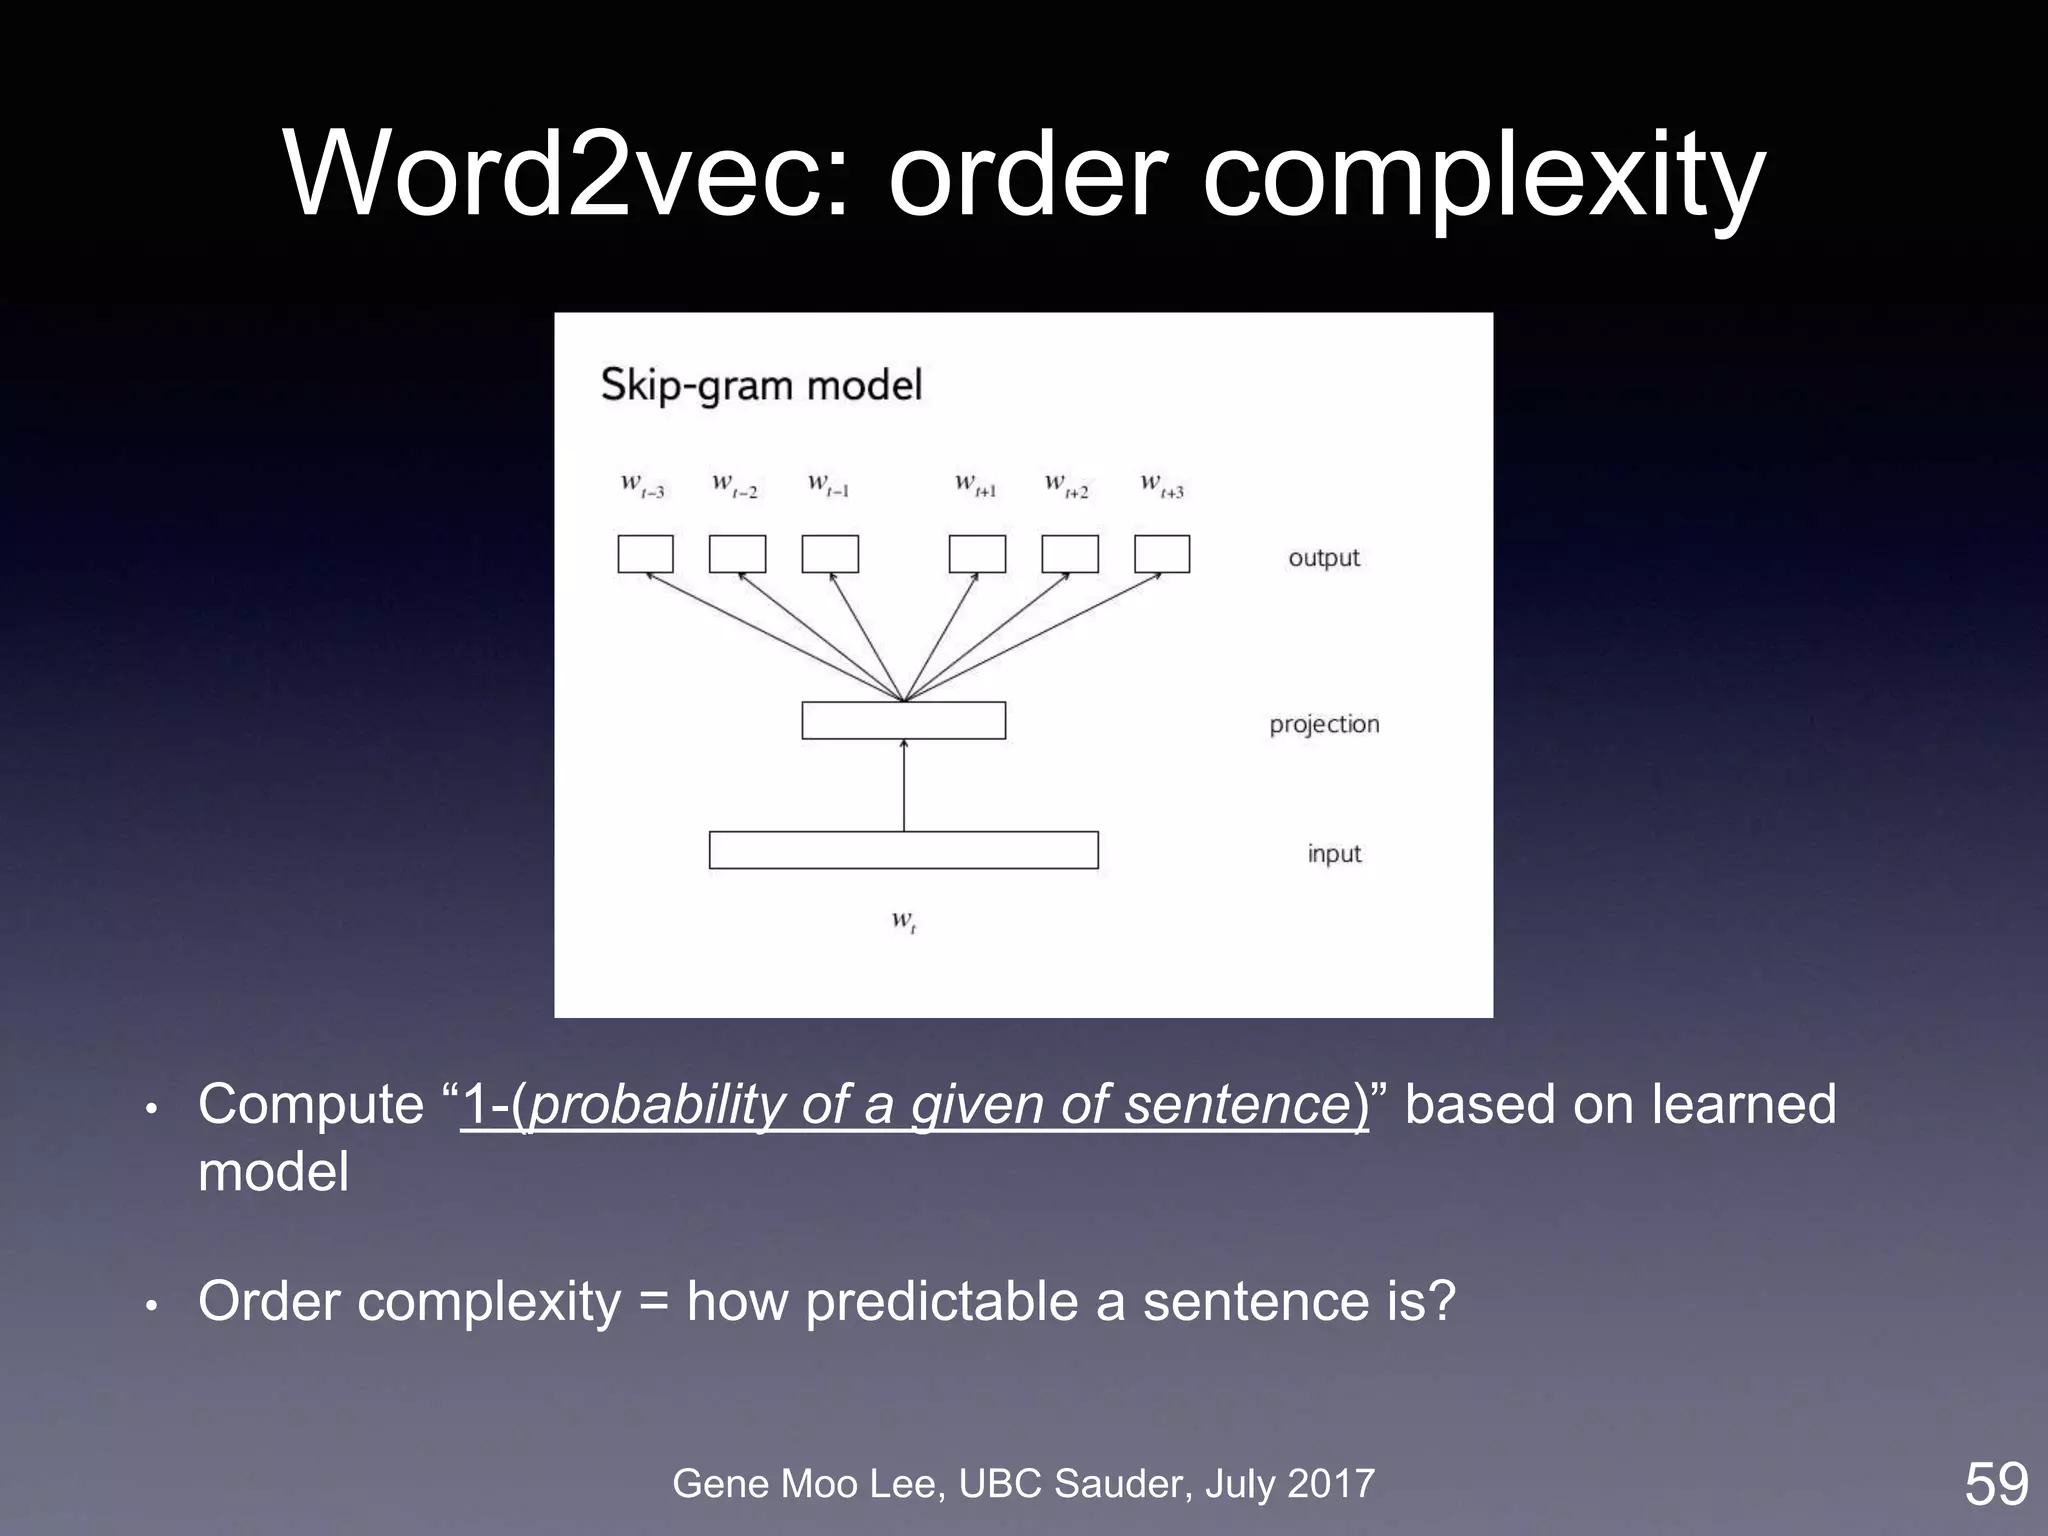
• Word2vec [Mikolov et al. 2013] represents words in a vector space
where semantically similar words are nearby
• Assumption: Words appear in the same contexts share semantics
• Train a model that maximizes prediction of words co-occurrence
(3 words before/after the focal word): word order matters here
Source: TensorFlow](https://image.slidesharecdn.com/20170731ubc-170731214632/75/Towards-Advanced-Business-Analytics-using-Text-Mining-and-Deep-Learning-57-2048.jpg)
![Gene Moo Lee, UBC Sauder, July 2017
Word2vec: Word embedding
58
• Word2vec [Mikolov et al. 2013] represents words in a vector space
where semantically similar words are nearby
• Assumption: Words appear in the same contexts share semantics
• Train a model that maximizes prediction of words co-occurrence
(3 words before/after the focal word): word order matters here
Source: TensorFlow](https://image.slidesharecdn.com/20170731ubc-170731214632/75/Towards-Advanced-Business-Analytics-using-Text-Mining-and-Deep-Learning-58-2048.jpg)

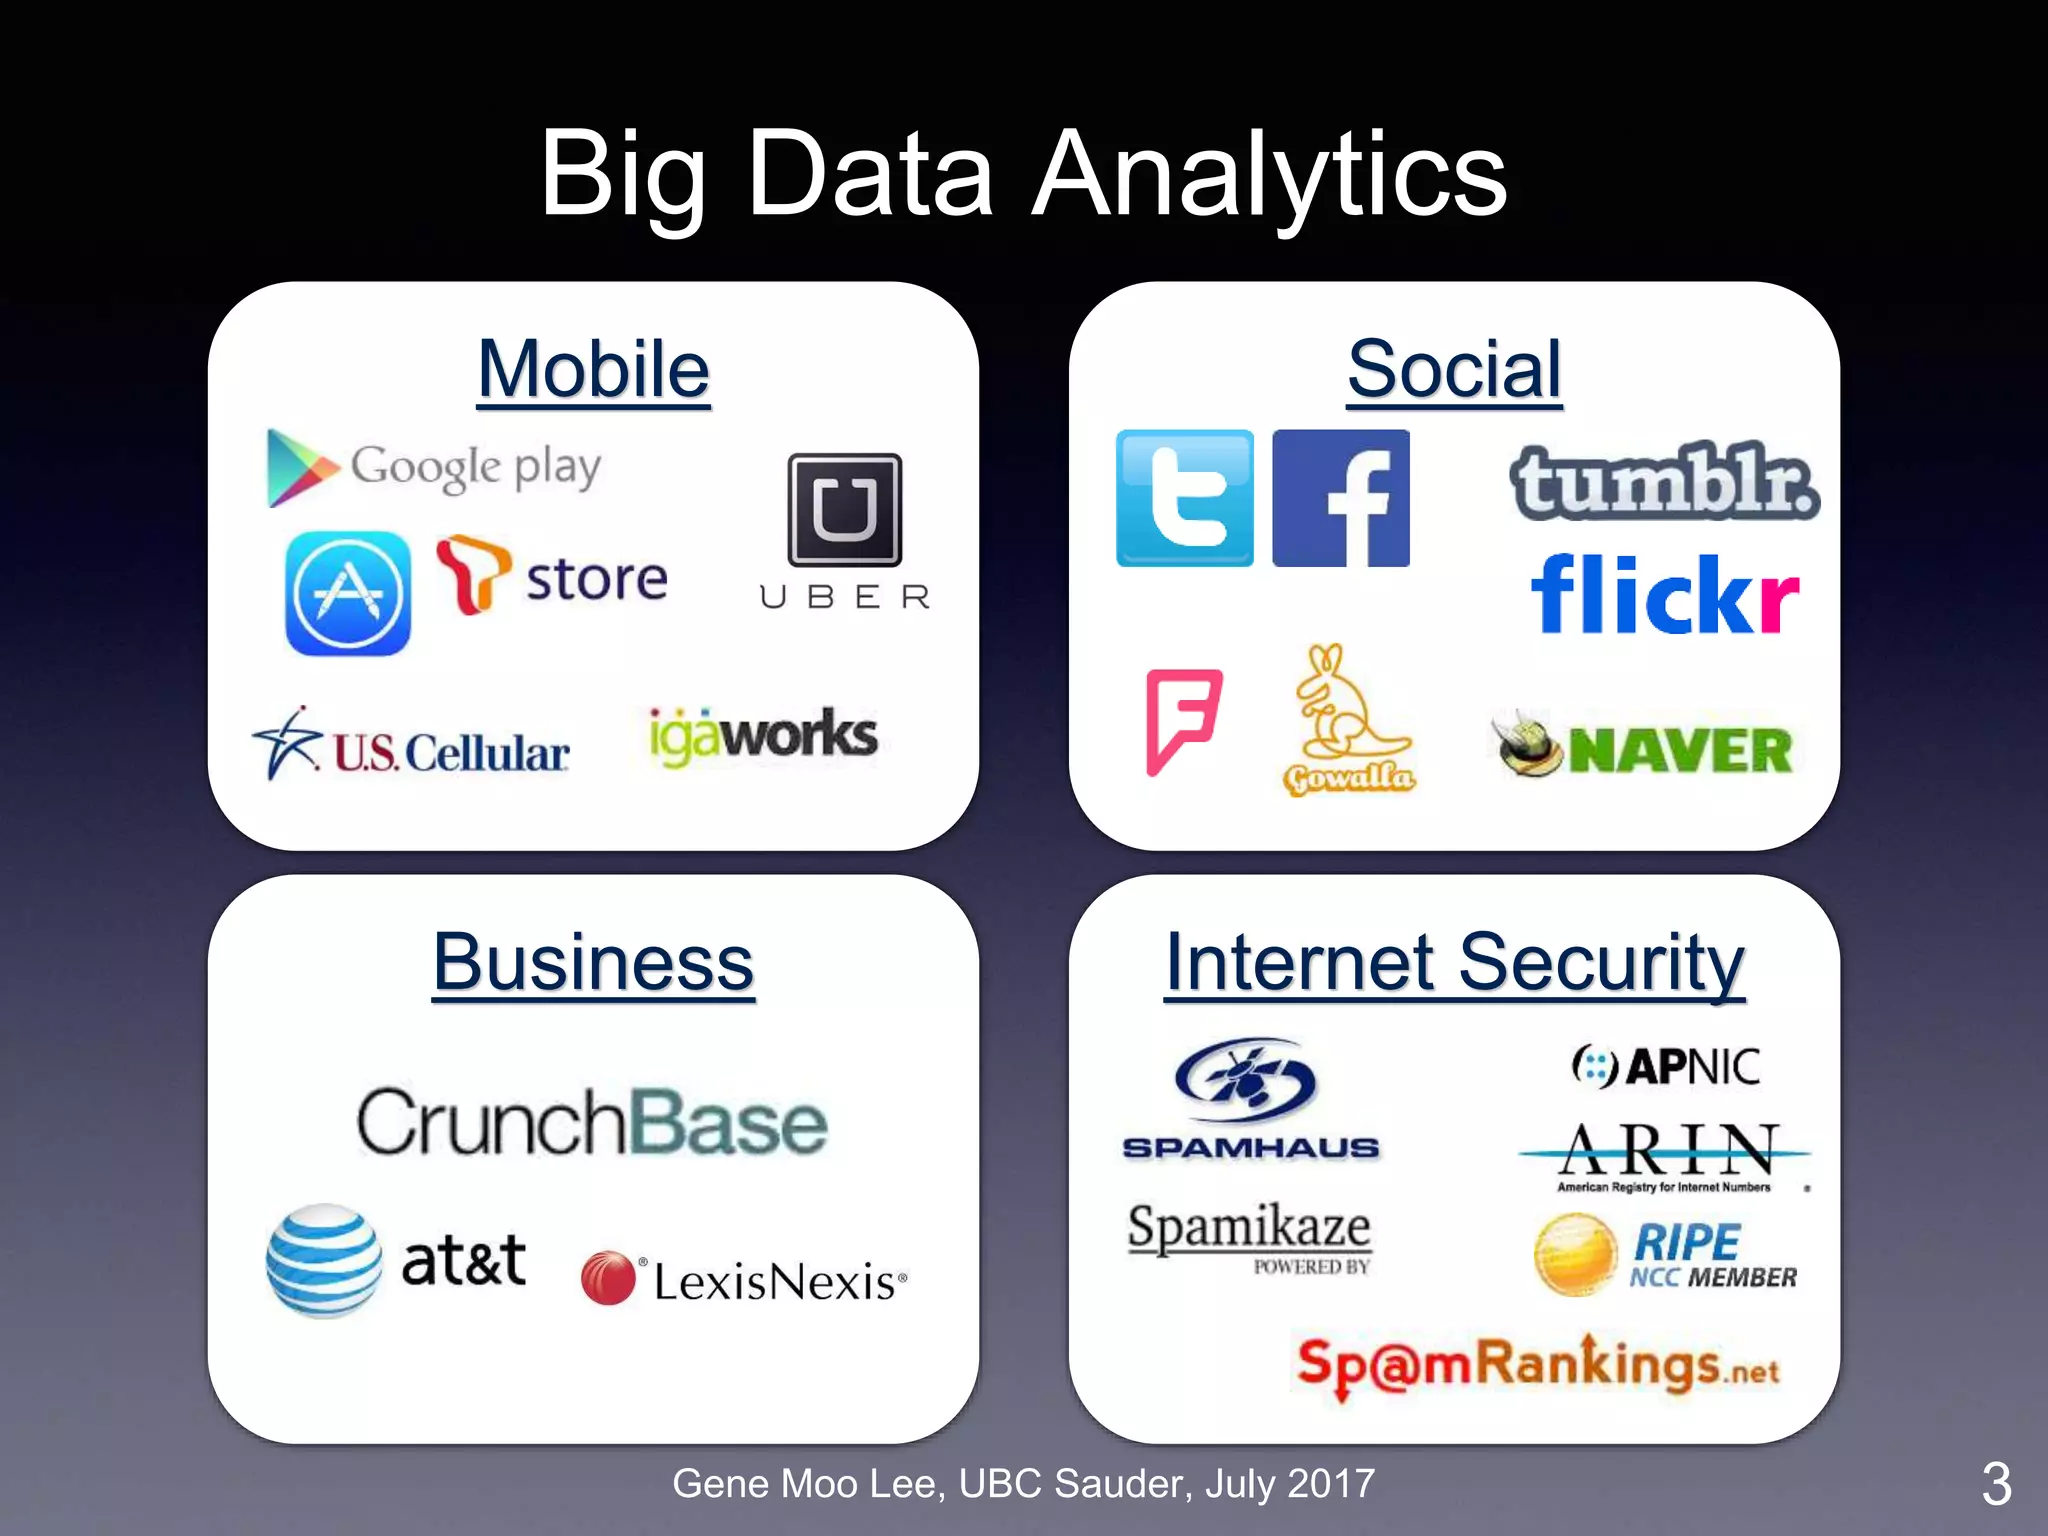
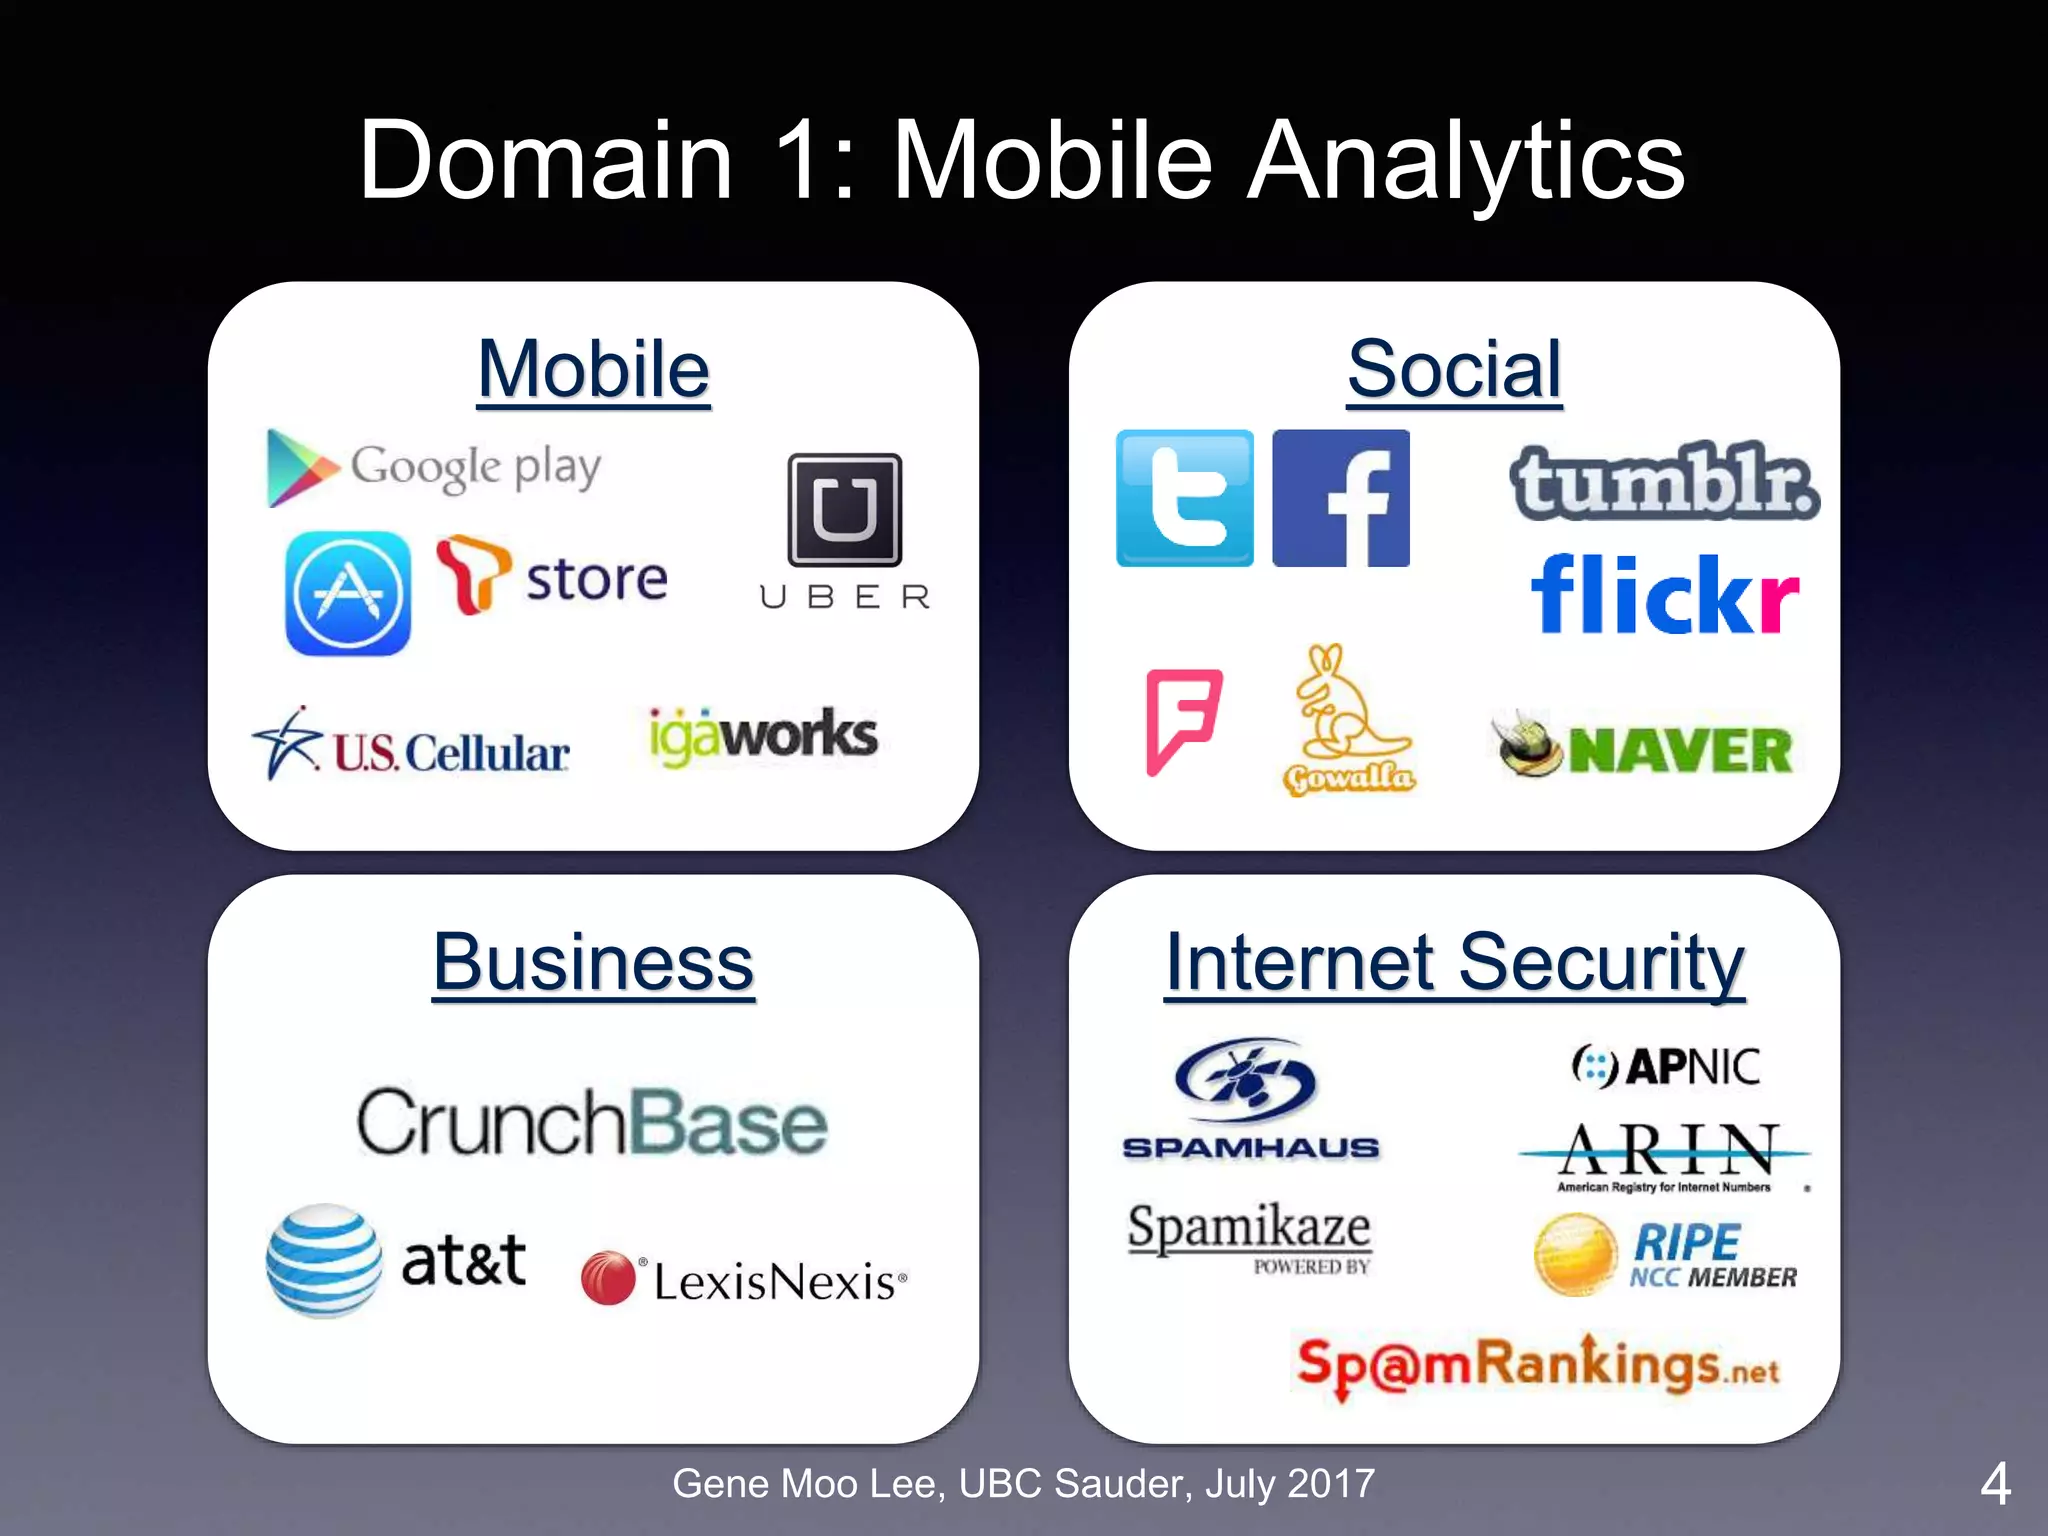
The document discusses advanced business analytics utilizing text mining and deep learning, focusing on unstructured big data, which constitutes 80-90% of available data. It highlights various domains, including mobile analytics, social media analytics, business analytics, and cybersecurity analytics, and introduces methodologies like machine learning and topic modeling to enhance user engagement, content analysis, and business proximity in these fields. The research emphasizes the significance of leveraging big data and deep learning techniques to derive actionable insights for better decision-making in business contexts.