Perspectives & opportunities for investment in Colombia.
F di's latin american sates of the future 2018 19
1. 34
B
razil’s São Paulo has been
named fDi’s Latin American
State of the Future for 2018/19.
Located on the country’s south-east-
ern coast, São Paulo – the most popu-
lous state in the study – ranks first for
both Economic Potential and
Business Friendliness. It boasted the
highest GDP of all locations analysed
and was the most attractive state in
the region for foreign investors
between 2013 and 2017.
According to data from greenfield
investment monitor fDi Markets, 592
companies invested in 659 projects in
the state in the review period. In
recent years, São Paulo has received
majorinvestmentsfromUS-basedNew
Generation Power, which invested
more than $900m with joint-venture
partner Grupo Léros in a photovoltaic
power facility in Taubaté, and Spain-
based call-centre operator Atento,
which hired 3000 people for its new
contact centre facility in Guarulhos.
São Paulo is home to more com-
panies in knowledge-based sectors
than any other state in the region,
contributing to its first place in the
Business Friendliness category. P3
Ingenieurgesellschaft, a Germany-
based engineering and consulting
company, attributed its decision to
open an office in São Paulo in 2016 to
the state’s reputation as a leading
technology and research centre
within Latin America.
RANK STATE COUNTRY
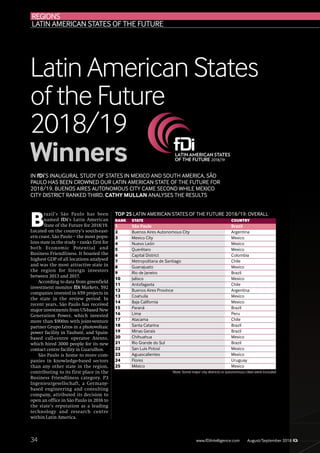
1 São Paulo Brazil
2 Buenos Aires Autonomous City Argentina
3 Mexico City Mexico
4 Nuevo León Mexico
5 Querétaro Mexico
6 Capital District Colombia
7 Metropolitana de Santiago Chile
8 Guanajuato Mexico
9 Rio de Janeiro Brazil
10 Jalisco Mexico
11 Antofagasta Chile
12 Buenos Aires Province Argentina
13 Coahuila Mexico
14 Baja California Mexico
15 Paraná Brazil
16 Lima Peru
17 Atacama Chile
18 Santa Catarina Brazil
19 Minas Gerais Brazil
20 Chihuahua Mexico
21 Rio Grande do Sul Brazil
22 San Luis Potosí Mexico
23 Aguascalientes Mexico
24 Flores Uruguay
25 México Mexico
TOP 25 LATIN AMERICAN STATES OF THE FUTURE 2018/19: OVERALL
www.fDiIntelligence.com August/September 2018
REGIONS
LATIN AMERICAN STATES OF THE FUTURE
IN fDi’S INAUGURAL STUDY OF STATES IN MEXICO AND SOUTH AMERICA, SÃO
PAULO HAS BEEN CROWNED OUR LATIN AMERICAN STATE OF THE FUTURE FOR
2018/19. BUENOS AIRES AUTONOMOUS CITY CAME SECOND WHILE MEXICO
CITY DISTRICT RANKED THIRD. CATHY MULLAN ANALYSES THE RESULTS
Latin American States
of the Future
2018/19
Winners
Note: Some major city districts or autonomous cities were included
2. REGIONS
LATIN AMERICAN STATES OF THE FUTURE
35August/September 2018 www.fDiIntelligence.com
Buenos Aires tech boost
Second ranked Buenos Aires
Autonomous City state hosts
Argentina’s capital city and is home to
more than 3 million people. The state
is creative and innovative, with the
highest proportion of third-level stu-
dents of all Latin American states and
the highest registration of patents on
a per capita basis. Buenos Aires
Autonomous City boasts 33 higher
education colleges and universities
and 21 International Baccalaureate
schools, helping it to rank first in the
Human Capital and Lifestyle category.
US-based CloudHesive credited its
November 2017 decision to open an
office in the state to its reputation for
innovation. Buenos Aires
Autonomous City was chosen due to
the “eagerness of the technical com-
munity to be leaders in Latam and
drive innovation”.
Mexico City district (formerly
known as Federal District) boasted
the third highest level of GDP of all
171 Latin American states analysed
(more than $347m at purchasing
power parity rate) and ranks third
overall. One of the most accessible
areas in the region, investors from
56 international destinations can
reach the district directly, where
sales, marketing and support opera-
tions make up the majority of the
business activities from inward
investors, accounting for more than
40% of all investment in the state
between 2013 and 2017.
Almost two-fifths of all invest-
ment in Mexico City is derived from
US companies, with recent invest-
ments from software giant Microsoft,
financial institution Bank of America
and home rental company Airbnb.
Spanish companies accounted for
more than 11% of investments
between2013and2017,whileGerman
companies accounted for 7.5%. ■
RANK STATE COUNTRY
1 São Paulo Brazil
2 Querétaro Mexico
3 Buenos Aires Auto Argentina
4 Nuevo León Mexico
5 Mexico City Mexico
6 Capital District Colombia
7 Metro de Santiago Chile
8 Guanajuato Mexico
9 Rio de Janeiro Brazil
10 Jalisco Mexico
TOP 10 LATIN AMERICAN STATES
OF THE FUTURE 2018/19 –
ECONOMIC POTENTIAL OVERALL
RANK STATE COUNTRY
1 Manabí Ecuador
2 Chimborazo Ecuador
3 Chuquisaca Bolivia
4 Cochabamba Bolivia
5 Santa Cruz Bolivia
6 Esmeraldas Ecuador
7 Cajamarca Peru
8 Apurímac Peru
9 La Paz Bolivia
10 Demerara-Mahaica Guyana
TOP 10 LATIN AMERICAN STATES
OF THE FUTURE 2018/19 – COST
EFFECTIVENESS OVERALL
RANK STATE COUNTRY
1 São Paulo Brazil
2 Capital District Colombia
3 Nuevo León Mexico
4 Guanajuato Mexico
5 Querétaro Mexico
6 Coahuila Mexico
7 Baja California Mexico
8 Jalisco Mexico
9 Metro de Santiago Chile
10 Chihuahua Mexico
TOP 10 SOUTH AMERICAN
STATES OF THE FUTURE 2018/19 –
BUSINESS FRIENDLINESS OVERALL
RANK STATE COUNTRY
1 Buenos Aires Auto Argentina
2 São Paulo Brazil
3 Metro de Santiago Chile
4 Lima Peru
5 Mexico City Mexico
6 Minas Gerais Brazil
7 Bogota Colombia
8 Buenos Aires Prov Argentina
9 Paraná Brazil
10 Valparaíso Chile
TOP10 LATIN AMERICAN STATES
OF THE FUTURE 2018/19 – HUMAN
CAPITAL AND LIFESTYLE OVERALL
RANK STATE COUNTRY
1 Quintana Roo Mexico
2 Buenos Aires Prov Argentina
3 São Paulo Brazil
4 Paraná Brazil
5 Metro de Santiago Chile
6 Rio de Janeiro Brazil
7 Veracruz Mexico
8 Jalisco Mexico
9 Baja California Sur Mexico
10 Santa Catarina Brazil
TOP 10 LATIN AMERICAN STATES
OF THE FUTURE 2018/19 –
CONNECTIVITY OVERALL
“BUENOS AIRES
AUTONOMOUS
CITY HAS
THE HIGHEST
PROPORTION OF
THIRD-LEVEL
STUDENTS OF ALL
LATIN AMERICAN
STATES “
3. 36 www.fDiIntelligence.com August/September 2018
RANK STATE COUNTRY
1 São Paulo Brazil
2 Mexico City Mexico
3 Nuevo León Mexico
4 Capital District Colombia
5 Metropolitana de Santiago Chile
6 Guanajuato Mexico
7 Rio de Janeiro Brazil
8 Jalisco Mexico
9 Buenos Aires Province Argentina
10 Paraná Brazil
TOP 10 MAJOR LATIN AMERICAN STATES OF
THE FUTURE 2018/19 – OVERALL
RANK STATE COUNTRY
1 São Paulo Brazil
2 Metropolitana de Santiago Chile
3 Lima Peru
4 Mexico City Mexico
5 Minas Gerais Brazil
6 Capital District Colombia
7 Buenos Aires Province Argentina
8 Paraná Brazil
9 Puebla Mexico
10 Rio Grande do Sul Brazil
TOP 10 MAJOR LATIN AMERICAN STATES OF
THE FUTURE 2018/19 – HUMAN CAPITAL
AND LIFESTYLE
RANK STATE COUNTRY
1 Buenos Aires Province Argentina
2 São Paulo Brazil
3 Paraná Brazil
4 Metropolitana de Santiago Chile
5 Rio de Janeiro Brazil
6 Veracruz Mexico
7 Jalisco Mexico
8 Santa Catarina Brazil
9 Mexico City Mexico
10 Michoacán Mexico
TOP 10 MAJOR LATIN AMERICAN STATES OF
THE FUTURE 2018/19 – CONNECTIVITY
RANK STATE COUNTRY
1 São Paulo Brazil
2 Nuevo León Mexico
3 Mexico City Mexico
4 Capital District Colombia
5 Metropolitana de Santiago Chile
6 Guanajuato Mexico
7 Rio de Janeiro Brazil
8 Jalisco Mexico
9 Buenos Aires Province Argentina
10 Lima Peru
TOP10 MAJOR LATIN AMERICAN STATES OF
THE FUTURE 2018/19 – ECONOMIC POTENTIAL
RANK STATE COUNTRY
1 Guayas Ecuador
2 Ceará Brazil
3 Pernambuco Brazil
4 Maranhão Brazil
5 Oaxaca Mexico
6 Chiapas Mexico
7 Minas Gerais Brazil
8 Puebla Mexico
9 Guanajuato Mexico
10 Bahia Brazil
TOP10 MAJOR LATIN AMERICAN STATES OF
THE FUTURE 2018/19 – COST EFFECTIVENESS
RANK STATE COUNTRY
1 São Paulo Brazil
2 Capital District Colombia
3 Nuevo León Mexico
4 Guanajuato Mexico
5 Jalisco Mexico
6 Metropolitana de Santiago Chile
7 México Mexico
8 Mexico City Mexico
9 Lima Peru
10 Antioquia Colombia
TOP 10 MAJOR LATIN AMERICAN STATES OF
THE FUTURE 2018/19 – BUSINESS
FRIENDLINESS
REGIONS
LATIN AMERICAN STATES OF THE FUTURE
GUAYAS
IN ECUADOR
TOPPED
THE COST-
EFFECTIVENESS
RANKING FOR
MAJOR STATES
Major states
4. 37August/September 2018 www.fDiIntelligence.com
Large states
RANK STATE COUNTRY
1 Buenos Aires Auto Argentina
2 Querétaro Mexico
3 Coahuila Mexico
4 Baja California Mexico
5 Chihuahua Mexico
6 San Luis Potosí Mexico
7 Quintana Roo Mexico
8 Santa Fe Argentina
9 Sonora Mexico
10 Atlantico Colombia
TOP 10 LARGE LATIN AMERICAN STATES OF
THE FUTURE 2018/19 – OVERALL
RANK STATE COUNTRY
1 Buenos Aires Auto Argentina
2 Valparaíso Chile
3 Pichincha Ecuador
4 La Libertad Peru
5 Biobío Chile
6 Cordoba Argentina
7 Santa Fe Argentina
8 Tucuman Argentina
9 Mendoza Argentina
10 Federal District Brazil
TOP 10 LARGE LATIN AMERICAN STATES OF
THE FUTURE 2018/19 – HUMAN CAPITAL
AND LIFESTYLE
RANK STATE COUNTRY
1 Quintana Roo Mexico
2 Buenos Aires Auto Argentina
3 Guerrero Mexico
4 Sinaloa Mexico
5 Santa Fe Argentina
6 Valparaíso Chile
7 Tamaulipas Mexico
8 Sonora Mexico
9 Tabasco Mexico
10 Córdoba Argentina
TOP 10 LARGE LATIN AMERICAN STATES OF
THE FUTURE 2018/19 – CONNECTIVITY
RANK STATE COUNTRY
1 Querétaro Mexico
2 Buenos Aires Auto Argentina
3 Coahuila Mexico
4 Baja California Mexico
5 San Luis Potosí Mexico
6 Chihuahua Mexico
7 Federal District Brazil
8 Sonora Mexico
9 Santa Fe Argentina
10 Atlantico Colombia
TOP10 LARGE LATIN AMERICAN STATES OF
THE FUTURE 2018/19 – ECONOMIC POTENTIAL
RANK STATE COUNTRY
1 Manabí Ecuador
2 Cochabamba Bolivia
3 Santa Cruz Bolivia
4 Cajamarca Peru
5 La Paz Bolivia
6 Piura Peru
7 La Libertad Peru
8 Central Paraguay
9 Alagoas Brazil
10 Cundinamarca Colombia
TOP 10 LARGE LATIN AMERICAN STATES OF
THE FUTURE 2018/19 – COST EFFECTIVENESS
RANK STATE COUNTRY
1 Querétaro Mexico
2 Coahuila Mexico
3 Baja California Mexico
4 Chihuahua Mexico
5 Buenos Aires Auto Argentina
6 San Luis Potosí Mexico
7 Valparaíso Chile
8 Cundinamarca Colombia
9 Atlantico Colombia
10 Biobío Chile
TOP 10 LARGE LATIN AMERICAN STATES OF
THE FUTURE 2018/19 – BUSINESS
FRIENDLINESS
BUENOSAIRES
AUTONOMOUS
CITY TOOK
SECOND
PLACE OVERALL
AND SCORED
HIGHLY IN
NUMEROUS
CATEGORIES
REGIONS
LATIN AMERICAN STATES OF THE FUTURE
5. REGIONS
LATIN AMERICAN STATES OF THE FUTURE
38 www.fDiIntelligence.com August/September 2018
Mid-sized states
RANK STATE COUNTRY
1 Montevideo Uruguay
2 Antofagasta Chile
3 Maule Chile
4 Los Lagos Chile
5 Coquimbo Chile
6 Arequipa Peru
7 Salta Argentina
8 Azuay Ecuador
9 Rio Negro Argentina
10 Corrientes Argentina
TOP 10 MID-SIZED LATIN AMERICAN
STATES OF THE FUTURE 2018/19 –
HUMAN CAPITAL AND LIFESTYLE
RANK STATE COUNTRY
1 Antofagasta Chile
2 Aguascalientes Mexico
3 Montevideo Uruguay
4 Campeche Mexico
5 Neuquén Argentina
6 Chubut Argentina
7 Baja California Sur Mexico
8 Salta Argentina
9 Meta Colombia
10 Canelones Uruguay
TOP10 MID-SIZED LATIN AMERICAN STATES OF
THE FUTURE 2018/19 – ECONOMIC POTENTIAL
RANK STATE COUNTRY
1 Antofagasta Chile
2 Aguascalientes Mexico
3 Montevideo Uruguay
4 Baja California Sur Mexico
5 Coquimbo Chile
6 Campeche Mexico
7 Callao Peru
8 Lib Gen Bernardo O’Higgins Chile
9 Maule Chile
10 Los Lagos Chile
TOP 10 MID-SIZED LATIN AMERICAN STATES
OF THE FUTURE 2018/19 – OVERALL
RANK STATE COUNTRY
1 Chimborazo Ecuador
2 Chuquisaca Bolivia
3 Esmeraldas Ecuador
4 Huánuco Peru
5 Azuay Ecuador
6 Loreto Peru
7 Puno Peru
8 Junín Peru
9 Áncash Peru
10 Lambayeque Peru
TOP 10 MID-SIZED LATIN AMERICAN
STATES OF THE FUTURE 2018/19 –
COST EFFECTIVENESS
RANK STATE COUNTRY
1 Baja California Sur Mexico
2 Antofagasta Chile
3 Callao Peru
4 Colima Mexico
5 Coquimbo Chile
6 Montevideo Uruguay
7 Lib Gen Bernardo O’Higgins Chile
8 Maule Chile
9 Los Lagos Chile
10 Aguascalientes Mexico
TOP 10 MID-SIZED LATIN AMERICAN
STATES OF THE FUTURE 2018/19 –
CONNECTIVITY
RANK STATE COUNTRY
1 Antofagasta Chile
2 Aguascalientes Mexico
3 Maule Chile
4 Lib Gen Bernardo O’Higgins Chile
5 Los Lagos Chile
6 Montevideo Uruguay
7 Coquimbo Chile
8 Canelones Uruguay
9 Ica Peru
10 Caldas Colombia
TOP 10 MID-SIZED LATIN AMERICAN
STATES OF THE FUTURE 2018/19 –
BUSINESS FRIENDLINESS
ANTOFAGASTA
INCHILEHAS
MARITIME LINKS
WHICH HELPED
IT SCORE HIGHLY
AMONG MID-
SIZED STATES
6. REGIONS
LATIN AMERICAN STATES OF THE FUTURE
40 www.fDiIntelligence.com August/September 2018
Small states
RANK STATE COUNTRY
1 Atacama Chile
2 Flores Uruguay
3 Tarapacá Chile
4 Río Negro Uruguay
5 Santa Cruz Argentina
6 Arica y Parinacota Chile
7 Los Ríos Chile
8 Maldonado Uruguay
9 Tierra del Fuego Argentina
10 Salto Uruguay
TOP 10 SMALL LATIN AMERICAN STATES OF
THE FUTURE 2018/19 – OVERALL
RANK STATE COUNTRY
1 Galápagos Ecuador
2 Arica y Parinacota Chile
3 La Rioja Argentina
4 Los Ríos Chile
5 Moquegua Peru
6 Tarapacá Chile
7 Atacama Chile
8 Maldonado Uruguay
9 San Luis Argentina
10 Tierra del Fuego Argentina
TOP 10 SMALL LATIN AMERICAN STATES OF
THE FUTURE 2018/19 – HUMAN CAPITAL
AND LIFESTYLE
RANK STATE COUNTRY
1 Tarapacá Chile
2 Arica y Parinacota Chile
3 Atacama Chile
4 Los Ríos Chile
5 Maldonado Uruguay
6 Demerara-Mahaica Guyana
7 Tierra del Fuego Argentina
8 Vargas Venezuela
9 Tacna Peru
10 San Luis Argentina
TOP 10 SMALL LATIN AMERICAN STATES OF
THE FUTURE 2018/19 – CONNECTIVITY
RANK STATE COUNTRY
1 Flores Uruguay
2 Atacama Chile
3 Santa Cruz Argentina
4 Río Negro Uruguay
5 Tierra del Fuego Argentina
6 Salto Uruguay
7 Tarapacá Chile
8 Florida Uruguay
9 Rocha Uruguay
10 Maldonado Uruguay
TOP10 SMALL LATIN AMERICAN STATES OF
THE FUTURE 2018/19 – ECONOMIC POTENTIAL
RANK STATE COUNTRY
1 Apurímac Peru
2 Demerara-Mahaica Guyana
3 Boquerón Paraguay
4 Concepción Paraguay
5 Tacna Peru
6 Tumbes Peru
7 Galápagos Ecuador
8 Moquegua Peru
9 Putumayo Colombia
10 Casanare Colombia
TOP10 SMALL LATIN AMERICAN STATES OF
THE FUTURE 2018/19 – COST EFFECTIVENESS
RANK STATE COUNTRY
1 Atacama Chile
2 Los Ríos Chile
3 Río Negro Uruguay
4 Flores Uruguay
5 Tarapacá Chile
6 Arica y Parinacota Chile
7 San José Uruguay
8 Florida Uruguay
9 Treinta y Tres Uruguay
10 Maldonado Uruguay
TOP 10 SMALL LATIN AMERICAN STATES OF
THE FUTURE 2018/19 – BUSINESS
FRIENDLINESS
FLORES
IN URUGUAY
SCORED HIGHLY
IN ECONOMIC
POTENTIAL
AMONG
SMALLER STATES
7. REGIONS
NORTH AMERICAN CITIES AND REGIONS OF THE FUTURE
41Month/2016 www.fDiIntelligence.com
RANK CITY COUNTRY
TOP 10 XXXXXXX XXXXXXX XXXXXXX
XXXXXXXXXX XXXXXXXXXX
RANK CITY COUNTRY
TOP 10 XXXXXXX XXXXXXX XXXXXXX
XXXXXXXXXX XXXXXXXXXX
RANK CITY COUNTRY
TOP 10 XXXXXXX XXXXXXX XXXXXXX
XXXXXXXXXX XXXXXXXXXX
RANK CITY COUNTRY
TOP 10 XXXXXXX XXXXXXX XXXXXXX
XXXXXXXXXX XXXXXXXXXX
RANK CITY COUNTRY
TOP 10 XXXXXXX XXXXXXX XXXXXXX
XXXXXXXXXX XXXXXXXXXX
RANK CITY COUNTRY
TOP 10 XXXXXXX XXXXXXX XXXXXXX
XXXXXXXXXX XXXXXXXXXX
RANK CITY COUNTRY
TOP 10 XXXXXXX XXXXXXX XXXXXXX
XXXXXXXXXX XXXXXXXXXXRANK CITY COUNTRY
TOP 10 XXXXXXX XXXXXXX
“QUISQUE
TURPIS LOREM,
PORTA NEC
VENENATIS
NEC. MAURIS
VIVERRA IACU-
LIS NISL A
HENDRERIT.
PROIN FRING-
ILLA VEHICULA
LACUS, LUC-
TUS
LUCTUS MI. ”
XXXXXXXXX
XXXXXXXXXXXX
FACTBOX
FIRSTLINE
INBOLD, THE
REST IN THIN
XXXX XXXX
XXXXXXX XXXXX
XXXX XXX
XXXXXX XXXXX
XXXXX XXXXX
REGIONS
LATIN AMERICAN STATES OF THE FUTURE
41August/September 2018 www.fDiIntelligence.com
FDI Strategy
M
ore than 60 staff at Investe
São Paulo are responsible for
investment promotion for
the state of São Paulo, which ranks
first for FDI Strategy in fDi’s Latin
American States of the Future
2018/19 league tables. Staff training
is provided by internationally recog-
nised organisations, including the
World Bank and the International
Finance Corporation.
Investe São Paulo provides an
interactive ‘São Paulo in Maps’ tool
on its website, where prospective
investors can view macroeconomic
and statistical information for the
state’s 645 municipalities, enabling
the user to research locations, infra-
structure and higher education insti-
tutions in proximity, logistics and
cluster information.
Investe São Paulo remains in close
contact with investing companies
already installed in the state, to mon-
itor expansion plans or answer any
requests. Advocacy remains an
important part of the promotion
body’s mission and it works closely
with the government to ensure any
barriers to investments are removed.
Minas Gerais’ intelligent thinking
A little to the north of São Paulo,
Minas Gerais ranks second for its
investment attraction strategy.
FIEMG, the state agency responsible
for investment promotion, owns a
pioneering business intelligence sys-
tem designed to support investing
companies and assist them in their
business decisions. It is the first such
system to be used in Brazil, and puts
the agency at the forefront of tech-
nology and investment attraction in
the country. FIEMG’s key initiatives
for attracting investment include
working with states to improve the
local business environment and
attracting investors, as well as inter-
national outreach missions.
Invest in Paraná, tasked with
attracting investors to Paraná state,
ranks third in the FDI Strategy cate-
gory and is located just south of São
Paulo. The agency recently launched
the ‘CEO Investment Meeting’, which
brings together investors and the
state governor to discuss the needs of
companies and the local investment
environment. A series of meetings
has resulted in the implementation
of three new tax policies encourag-
ing investment at sector level. The
Paraná Competitivo programme
offers investors incentives that cover
greenfield, brownfield and e-com-
merce, in addition to site selection
and technical support. ■
TOP 10 LATIN AMERICAN STATES OF THE
FUTURE 2018/19 – FDI STRATEGY
RANK STATE COUNTRY
1 São Paulo Brazil
2 Minas Gerais Brazil
3 Paraná Brazil
4 Atlantico Colombia
5 Durango Mexico
6 Capital District Colombia
7 Guanajuato Mexico
8 Valle de Cauca Colombia
9 Risaralda Colombia
10 Buenos Aires Autonomous City Argentina
Editors’ choice award
MINASGERAIS
IN BRAZIL IS
PIONEERING
A BUSINESS
INTELLIGENCE
SYSTEM
DESIGNED
TO SUPPORT
INVESTMENT
8. REGIONS
LATIN AMERICAN STATES OF THE FUTURE
42 www.fDiIntelligence.com August/September 2018
ECONOMIC POTENTIAL
• Population
• Average annual population growtttw h rate
(%)
• Unemployment rate
• Inflllf ation rate
• GDP (PPP current $$$) (millions)
• GDP per Capita (PPP current $)
• Average annual GDP growttwth rate (2011-
2015)
• Projected average annual GDP growtttw h
rate (2016-2020)
• Outward FDI (2013-2017)
• Outward FDI per 100,000 people (2013-
2017)
• Inward FDI (2013-2017)
• Inward FDI per 100,000 people (2013-
2017)
• FDI in R&D and DDT (2013-2017)
• FDI in advanced manufacturing (2013-
2017)
• Number of mega projects by capex
(more than $100m) (2013-2017)
• Number of mega projects by capex
(more than $100m) per 100,000 people
(2013-2017)
• Number of mega projects by jobs (more
than 1000 jobs) (2013-2017)
• Number of mega projects by jobs (more
than 1000 jobs) per 100,000 people
(2013-2017)
• Capital expenditure on R&D and DDT
Projects ($) (2013-2017)
• Number of patents 2007-2016
• Number of patents per 100,000 people
2007-2016
JUDGING CRITERIA
HUMAN CAPITAL AND LIFESTYLE
• Labour force as % of populationnn
• Secondaryyry enrollment rate (%)
• Tertttr iaryyyr enrollment rate (%)
• Education expenditure (% of GNNNI)
• Number of higher education inssstitutions
• Number of higggher education inssstitutions
per 100,000 population
• Number of IB schools
• Number of IB Schools per 100,00000
people
• QS University Rankings: Latin Ammmerica
2017 Top 400 universities
• Number of students
• Third level students as % of popppulation
• Ability to attract and retain talennnt
• Physicians (per 1,000 people)
• Life expectancy
• Social Progress Index 2016
COST EFFECTIVENESS
• Average annual salaryyyr for an unskilled
worker ($)
• Average annual salaryyry for an semmmi-skilled
worker ($)
• Average annual salaryyry for an skilled
worker ($)
• 4*/5* hotel in city centre ($ perrr night)
• Minimum wage ($ per month)
• Cost of establishing a business (((absolute
value using GNI)
• Cost of registering a propertttr y (aaabsolute
value using GNI)
• Cost of construction permits (%%% of
warehouse value)
• Petrol prices ($ per litre)
• Cost of establishing an electricity
connection (absolute value using GNI)
• Corporation tax rate (%)
• VAT/common indirect tax rate (%)
• Total tax rate, % of profiifit
• Countryyry PPP/exchange rate 2016
••• EEEllleeeccctttrrriiiccciiitttyyy ((($$$ pppeeerrr kkkwwwHHH)))
CONNECTIVITY
• Upload speed (kb/s)
• Download speed (kb/s)
• Percentage of people using the internet
(%)
• ICT Development Index
• Mobile phone subscribers (2017) per
capita
• Number of airporttrts within the state
• Number of international destinations
servvrved
• Distance to nearest international airportttr
(km)
• Number of portttr s (medium)
• Number of portttr s (large)
• Number of porttrts (veryyyr large)
• Number of porttrts (medium+)
• Liner shipping connectivity index (2017)
• Environmental Perfffr ormance Index 2016
• Logistics Perfffr ormance Index 2016
• Networked Readiness Index 2016
• Quality of overall infrastructure 2017
• Quality of roads 2017
• Quality of railroad infrastructure 2017
• Companies in transportttr ation per
100,000 people
BUSINESS FRIENDLINESS
• Total number of commmpanies within
hi-tech manufacturinnng sector 2017
• Total number of commmpanies within
hi-tech servvvr ice sector 2017
• Total number of commmpanies within the
knowledge-based seccctor 2017
• Proporttrtion of companies within hi-tech
manufacturing sector 2017 (%)
• Proportttr ion of companies within hi-tech
servvvr ice sector 2017 (%%%)
• Proportttr ion of companies within the
knowledge-based seccctor 2017 (%)
• Number of companieees within hi-tech
manufacturing sector per 100,000
population
• Number of companieees within hi-tech
servvrvice sector per 100,000 population
• Number of companieees within the
knowledge based seccctor per 100,000
population
• Number of jobs creattted by all inward FDI
(2013-2017)
• Number of jobs creattted by all inward FDI
per 100,000 people (((2013-2017)
• Number of expansionnn/co-location
projects (2013-2017)))
• Corporation tax rate (((%)
• Days taken to startttr a business
• Firing costs
• Ease of Doing Busineeess Rank 2016
• Strength of Investor PPProtection Index
• Index of Economic Frrreedom
• Corruption Perceptiooon Index 2016
• Fragile States Index 222017
• Credit rating (S&P)
• Countryyyr risk score
To create a shortlist for the fDDDf i Latin
AmmmA erican States of the Future 2018/19
rankiiik ng,thefDDDf iIntelligencedivisionof
the Financial Times collected data
using the specialist online FDI tools fDDfDi
Benchmark and fDDDf i Markets as well as
other sources. Data was collected for
171 locations under five categories:
Economic Potential, Human Capital
and Lifesytle, Cost Effectiveness,
METHODOLOGY
Connectivvvity and Business
Friendlinessss. Locations scored up to a
maximum of 10 points for each data
point, which were weighted by impor-
tance to theee FDI decision making pro-
cess in ordeeer to compile both the sub-
category rannnkings as well as the overall
Latin Amerrrican States of the Future
2018/19 rankkking.
In addiiition, surveys were col-
lected under a sixth caaategory, FDI
Strategyygy, for which there were 32 sub-
missions. Locations thaaat ranked in
the top 10 in this categorrry were given
bonus points, which connntributed to
their overall score. Togethhher, the data
subcategory rankings aaand the FDI
Strategyygy ranking make up the overall
Latin American States of the Future
2018/19 ranking. ■
SÃOPAULO
STATE
TOPPED
THE OVERALL
RANKINGS,
AND TOOK THE
EDITORS’ CHOICE
AWARD FOR
FDI STRATEGY