1. Research Summary
My thesis research focuses on the control of lasing and related many-body effects in a
highly photoexcited semiconductor microcavity at room temperature. Macroscopic cooper-
ative phenomena such as Bose-Einstein condensation or superconductors have been realized
in semiconductors at low temperature. Quantum correlation is typically significant at large
particle density and cryogenic temperature, but it can be enhanced with the assistance of
light even at room temperature. My co-workers and I addresses two issues. One is we will
explore the cooperative phenomena in the coupled electron-hole-photon system at room tem-
perature. The other is if the correlated e-h pairs exist and decay into lasing, whether we can
control such coherent radiation.
A semiconductor microcavity was chosen as our system with similar structure with
vertical-cavity surface-emitting lasers (VCSELs). The designed microcavity has large energy
detuning in 80 meV between quantum well band gap and cavity resonance, which suppresses
the spontaneous recombination of e-h pairs and increases the e-h density. The microcavity
was non-resonantly pumped with 2-ps pulsed laser. We temporally and spatially modulated
laser pulses to reduce the heating and carrier diffusion effect, which might destabilize the
e-h correlation. In experiments, we investigated the luminescence from microcavity with its
intensity, spectroscopy, dynamics, and polarization state to understand the dynamics of pho-
toexcited carriers and their interactions. We also explored the luminescence evolution with
dependence of excitation intensity or polarizations. The control of excitation and analysis of
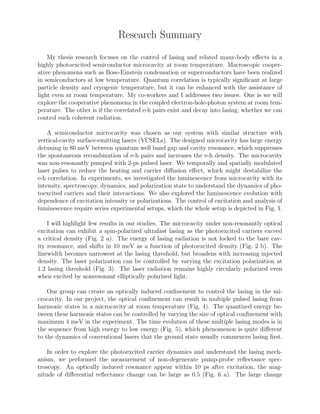
luminescence require series experimental setups, which the whole setup is depicted in Fig. 1.
I will highlight few results in our studies. The microcavity under non-resonantly optical
excitation can exhibit a spin-polarized ultrafast lasing as the photoexcited carriers exceed
a critical density (Fig. 2 a). The energy of lasing radiation is not locked to the bare cav-
ity resonance, and shifts in 10 meV as a function of photoexcited density (Fig. 2 b). The
linewidth becomes narrowest at the lasing threshold, but broadens with increasing injected
density. The laser polarization can be controlled by varying the excitation polarization at
1.2 lasing threshold (Fig. 3). The laser radiation remains highly circularly polarized even
when excited by nonresonant elliptically polarized light.
Our group can create an optically induced confinement to control the lasing in the mi-
crocavity. In our project, the optical confinement can result in multiple pulsed lasing from
harmonic states in a microcavity at room temperature (Fig. 4). The quantized energy be-
tween these harmonic states can be controlled by varying the size of optical confinement with
maximum 4 meV in the experiment. The time evolution of these multiple lasing modes is in
the sequence from high energy to low energy (Fig. 5), which phenomenon is quite different
to the dynamics of conventional lasers that the ground state usually commences lasing first.
In order to explore the photoexcited carrier dynamics and understand the lasing mech-
anism, we performed the measurement of non-degenerate pump-probe reflectance spec-
troscopy. An optically induced resonance appear within 10 ps after excitation, the mag-
nitude of differential reflectance change can be large as 0.5 (Fig. 6 a). The large change
2. is about three to four orders of magnitude reported in typical measurement in GaAs-based
semiconductor quantum wells or microcavities. Slightly above the lasing threshold, the gain
appear near the resonance, but the energy shifts of the lasing gain and the resonance are not
the same in the time domain (Fig. 6 b).
The lasing radiation from the microcavity is attributed to the spin-dependent stimulated
process of correlated electron-hole pairs, which the pairs form near but not lock to the
cavity resonance. The energy blue shift results from the combination effect of both cavity
resonance shift and electron-hole interaction. Solid establishment of correlated e-h pairs as
well as their energy level requires further experiments such as terahertz experiments. The
results on lasing in highly photoexcited microcavities in my research can lead to further
developments to harness many-body effects at room temperature and spin degree of freedom
to control lasing.
3. k//
SLM: Spatial Light Modulator
VA: Variable Attenuator
VR: Variable Retarder
PR: Polarization Rotator
CP: Compensator
F
F
Ti:Sapphire Laser
AOM
GP
VA
HWP
FR
L25
L75
SLM
PBS
GM
VR
CP
Obj
L250
VR
PR
L200
L200 GP
NF
Spectrometer
Sample
PH
76 MHz
Obj
E vs. k dispersion
ky
k-image
E
ky
kx
LN-CCD
Streak Camera
LXX: Lens, f = “XX” mm
PBS: Polarized Beam Splitter
AOM:Acousto-optic Modulator
FR: Faraday Rotator
GP: Glan Polarizer
HWP:Half Wave Plate
GM: Miniature Gold Mirror
Obj: Objective 50X (N.A. = 0.42)
PH: Pinhole Aperture
NF: Notch Filter
Y
X
Z
σ+ σ−
GP
S
S
θ
k
k-space
L250
L200
PH
r-space
1 kHz
*removable
k-space
k||
Figure 1: Whole Experimental Set-up: Luminescence from the microcavity is collected
by a microscope objective (N.A. = 0.42, effective focal length f0 = 4 mm). The collection
angle is up to θ ≈ 25◦
in air. The measurement of imaging/spectroscopy can be referred
to Fig. ??, with the lens labeled with focal length (ex: L200 means f = 200 mm). In the
conjugate real-space imaging plane (r-space), we place a 600-µm diameter circular aperture
to spatially isolate luminescence and a single transverse mode within a circular ≈10-µm
diameter area on the sample. The image at the entrance plane can be directed to the LN-CCD
for time-integrated imaging/spectroscopy or to the streak camera system for time-resolved
measurements. In this configuration, we measure the angular distribution of luminescence
as k-space images (k-images) or spectra (E vs. k dispersions) using respectively the 0-order
or 1st-order diffracted light from the grating. By inserting a removable 200 mm focal-length
lens (L200), we project the r-space luminescence to the entrance plane of the spectrometer.
4. Figure 2: Spin-polarized lasing at room temperature. (a) Angle-resolved [k-space
(kX, kY )] luminescence images at lasing threshold (P = Pth) for co-circular (σ+
/σ+
, left
panel) and cross-circular (σ+
/σ−
, right panel) components. Here, σ±
/σ±
represents the
polarization of pump/luminescence, respectively. Pth ≈ 2.5 × 10⁸
photons per pulse (over
an area of 80 µm2
), resulting in an estimated photoexcited density nth ≈ 3 × 10¹²
cm−2
per
QW per pulse. Insets are corresponding real space (r-space) luminescence images. (b) 2D
false-color images of microcavity luminescence/lasing spectra vs. the pump flux for σ+
/σ+
components. Each vertical slice represents normalized spectrum at corresponding pump flux.
Figure 3: Spin-amplification effect: (a) Representation of polarization states (Stokes
vectors) in a Poincar´e sphere. The pump polarization is varied along the meridian in the
s1-s3 (x-z) plane. (b) The time-integrated DoCP of the spin-polarized laser radiation as a
function of pump DoCP (ρp
c) (blue line) at 0.8 (black dots), 1.0 (magenta dots), and 1.2 Pth
(red dots). The pump flux is maintained at a constant when ρp
c is varied. For a specific φ,
only the ηex of the majority polarized emission component is shown (σ+
for 0◦
≤ φ < 180◦
and σ−
for 180◦
≤ φ < 360◦
).
5. 0 4 0-4-4 4
1.40
1.41
Position (µm)
Energy(ev)
0 4 0-4-4 4
k||
(µm-1
)
0
1
Position (µm) k||
(µm-1
)
r-space k-space
0.64
0.36
0.16
0.04
E1
E2
E3
c
P = 0.8 Pth
P = 1.3 Pth
d
2.3 meV
1.40
1.41
Energy(ev)
P = 0.8 Pth
P = 1.3 Pth
e f
-8
8
0
-8
8
0
Pump
PL
a
b
0
1
0 8-8
Position (µm)
Figure 4: Visualization of the macroscopic harmonic states: (a) Intensity image of
the ring-shaped pump laser beam. (b) Photoluminescence (PL) image under a pump flux
of about 1.3 Pth, where the threshold pump flux Pth = 1.8 × 10⁸
photons per pulse. The
white dashed line represents the intensity peak of the pump. PL emerges at the center with
a minimal overlap with the annular pump laser beam. (c–d) r-space imaging spectra at P =
0.8 Pth and 1.3 Pth. The black dashed line represents the harmonic confining potential V (x),
whereas the white lines represent the spatial probability distributions of the lowest three
states of a corresponding harmonic oscillator. (e–f) k-space imaging spectra. The energy
splitting is ¯hω ≈ 2 meV, consistent with the quantized energy of a quantum oscillator for
a particle with mass m∗
= 3 × 10⁻⁵
me, as determined by the E vs. k dispersion (doted
grey line). The quantized modes spectrally blue shift about 1 meV from P = 0.8 to 1.3
Pth, whereas the quantized energy splitting remains the same. The potential and spectral
shifts are due to a density-dependent increase in the chemical potential of the high-density
e-h plasma in the reservoir.
6. 0 50 100 50 100 50 100 50 100
1.402
1.406
1.410
Time (ps)
Energy(eV)
0
1
0.25
0
1
0.5
P = 1.1 Pth
P = 1.2 Pth
P = 1.6 Pth
P = 1 Ptha
b
0-2 2 0-2 0 2 0 2
k||
(µm-1
)
0
50
100
Time(ps)
2 -2 -2
Figure 5: Dynamics of harmonic states: (a) Time-dependent luminescence in k-space
at P = 1.0, 1.1, 1.2 and 1.6 Pth. The E3, E2 and E1 states appear sequentially with the
increasing pump flux. The rise times decrease with the increasing pump flux for all states.
(b) Time-dependent spectra in r-space. The false color represents normalized intensities.
1 . 4 0 0 1 . 4 0 5 1 . 4 1 0 1 . 4 1 5
- 0 . 4
- 0 . 2
0 . 0
0 . 2
0 . 4
0 . 6
0 . 8
1 . 0
DR/R(w)
E n e r g y ( e V )
0 . 8 P t h
1 . 0 P t h
t ~ 7 p s
1 . 4 0 0 1 . 4 0 5 1 . 4 1 0 1 . 4 1 5
- 1
0
1
2
3
4
5
6
7
8
1 . 1 P t h
6 6 7 p s
3 3 3 p s
6 7 p s
3 3 p s
1 3 p s
7 p s
DR/R(w)
E n e r g y ( e V )
- 2 0 0 p s
ba
Figure 6: Optically induced resonance (a) Calculated differential reflectance ∆R/R =
(R −R)/R of pump-probe spectroscopy at 7 ps after excitation with pump flux 0.8 Pth (black)
and 1.0 Pth (red). R and R’ are the reflectance under no pump and pump, respectively. The
figure indicate a presence of large resonance under high electron-hole plasma density.(b)
Time evolution of differential reflectance change at pump flux 1.1 Pth. The energy shift of
lasing gain and the resonance are different.