Sustainable and Resilient Playground_FinalReport_5-11-2016 (1)
1. 1
Sustainable and Resilient
Playground
Final Report
Date: May 11, 2016
Section: CE-423-X1
Team: E10-PowerPlay
Mechanical: Tyler Brown, Michael Fasulo, Evan Katzen, Caroline Niezelski
Civil: Christopher Cutri, Sean Dirscherl, Batu Hofer, Mieszko Strozek
Advisors: Professor Leslie Brunell (CE), Professor Maxine Fontaine (ME)
“We pledge our honor that we abided by the Stevens Honor System.”
2. 2
Contents
Section – I: Project Definition, Plan, and Requirements...............................................................................6
1. Mission Statement................................................................................................................................6
2. Background ...........................................................................................................................................6
3. Analysis of Stakeholder Needs..............................................................................................................7
4. Project Scope and Resources................................................................................................................9
5. Project Plan.........................................................................................................................................10
i. Research...........................................................................................................................................10
ii. Design of Full Scale..........................................................................................................................10
iii. Prototyping.....................................................................................................................................10
iv. Testing............................................................................................................................................11
6. Requirements for the Proposed Design..............................................................................................11
7. Constraints and Assumptions .............................................................................................................11
i. Constraints .......................................................................................................................................11
ii. Assumption and Dependencies.......................................................................................................12
8. Applicable Codes/Standards/Regulations...........................................................................................13
i. Codes Relevant to Roundabout Design Criteria...............................................................................13
ii. Codes Relevant to Water Retention System...................................................................................15
Section – II: Playground Equipment Design & Optimization ......................................................................16
9. Concept Development and Selection..................................................................................................17
i. Energy Converting Mechanism Concepts and Selection..................................................................17
ii. Roundabout Equipment Concepts ..................................................................................................19
ii. Roundabout Equipment Decision Matrix........................................................................................22
10. Preliminary and Detailed Design.......................................................................................................23
i. Preliminary Roundabout Design Description...................................................................................23
ii. Electrical Design ..............................................................................................................................27
iii. Gear Train.......................................................................................................................................31
iv. Electrical and Mechanical Integration............................................................................................32
v. Manufacturing Process....................................................................................................................33
vi. Footing Design................................................................................................................................33
11. Design Evaluation Methods ..............................................................................................................35
i. Force Gauge Data Collection............................................................................................................35
3. 3
ii. Start-Up Torque Criteria..................................................................................................................35
iii. Stress Analysis ................................................................................................................................37
iv. Battery Charging and Discharging..................................................................................................39
12. Physical Prototyping..........................................................................................................................41
i. Prototype Purpose ...........................................................................................................................41
ii. Prototype Plan.................................................................................................................................41
iii. Budget ............................................................................................................................................42
13. Prototyping and Testing....................................................................................................................44
i. Mechanical System ..........................................................................................................................44
ii. Electrical System .............................................................................................................................45
iii. Fabrication......................................................................................................................................46
iv. Testing............................................................................................................................................47
14. Design Revision and Optimization ....................................................................................................53
i. Verification.......................................................................................................................................53
ii. Revision ...........................................................................................................................................54
iii. Optimization...................................................................................................................................54
15. Prototype Refinement and Performance Testing.............................................................................54
16. Final Design Specification with BOM ................................................................................................57
Section – III: Northwest Resiliency Park Design and Optimization.............................................................58
17. Site Layout.........................................................................................................................................58
i. Property Overview ...........................................................................................................................58
ii. Lot 1, Ball Fields and Green Space ..................................................................................................59
iii. Lot 2, Playground and Rain Garden................................................................................................60
18. Stormwater Detention System .........................................................................................................61
i. Detention System Layout.................................................................................................................61
ii. Elevation Design..............................................................................................................................62
iii. Dewatering Plan .............................................................................................................................63
iv. Runoff Capacity Analysis ................................................................................................................64
19. Elevated Playground Structure .........................................................................................................64
i. Structural Overview and Loading.....................................................................................................64
ii. Beam and Column Types.................................................................................................................65
iii. Structural Analysis and Member Selection ....................................................................................65
iv. Architectural Considerations..........................................................................................................66
4. 4
20. Rain Garden.......................................................................................................................................67
i. Layout...............................................................................................................................................67
ii. Soil Profile .......................................................................................................................................67
iii. Retentive Capacity..........................................................................................................................68
Section – IV: Entrepreneurship & Business Development..........................................................................68
21. Competitive Intelligence: Market Analysis .......................................................................................68
22. Lean Canvas Business Model ............................................................................................................68
23. Financial Analysis ..............................................................................................................................69
24. Intellectual Property .........................................................................................................................69
25. Innovation Expo ................................................................................................................................69
i. Elevator Pitch ...................................................................................................................................69
Section – V: Appendices........................................................................................................................73
A. Team organization chart.................................................................................................................73
B. Project Gantt Chart.........................................................................................................................74
C. Mechanical System Component Description .................................................................................74
D. Electrical System Component Description .....................................................................................77
E. Shaft Design ....................................................................................................................................80
F. Bracket Design.................................................................................................................................81
G. Meeting Minutes ............................................................................................................................82
H. Footing Design Calculations............................................................................................................97
J. East Detention Basin Elevations ....................................................................................................104
K. Playground Structure....................................................................................................................107
L. Playground Structure Member Selection .................................................................................109
M. Robot Structural Analysis Results .........................................................................................110
N. Lot 1 Area Plan Views................................................................................................................112
O. Raingarden Cost Analysis..........................................................................................................115
Tables
Table 1-Stakeholder Needs...........................................................................................................................7
Table 2-Voice of Customer............................................................................................................................8
Table 3-Project Scope ...................................................................................................................................9
Table 4-Simplified Project Plan...................................................................................................................10
Table 5-Requirement Rating.......................................................................................................................11
Table 6-Constraints.....................................................................................................................................12
5. 5
Table 7-Assumptions & Dependencies .......................................................................................................13
Table 8-Description of Energy Converting Mechanisms.............................................................................17
Table 9-Pugh Matrix for Energy Converting Mechanisms ..........................................................................18
Table 10-Roundabout Concept: Tornado ...................................................................................................19
Table 11-Roundabout Concept: Double Decker .........................................................................................20
Table 12-Roundabout Concept: Planetary Gear.........................................................................................21
Table 13-Roundabout Concept: Cyclone ....................................................................................................22
Table 14-Pugh Matrix for Roundabout Designs..........................................................................................22
Table 15-Power Output Specifications .......................................................................................................28
Table 16-Permanent Magnet Alternator Specifications.............................................................................30
Table 17-Gear Costs....................................................................................................................................32
Table 18-Start-up Torque............................................................................................................................36
Table 19-Input Force Calculations ..............................................................................................................36
Table 20-Power Requirements ...................................................................................................................40
Table 21-Battery Charge Times: Full Battery ..............................................................................................40
Table 22-Battery Charge Times: LED Requirements...................................................................................41
Table 23-Discharge Calculations.................................................................................................................41
Table 24-Prototype BOM............................................................................................................................43
Table 25-Full-Scale BOM.............................................................................................................................57
Table 26 - Detention basin size and capacity summary..............................................................................62
Table 27 - Runoff Analysis Results ..............................................................................................................64
Figures
Figure 1-Front View of Full Scale Roundabout with Code Dimensions ......................................................14
Figure 2-Top View of Full Scale Roundabout with User Zone Dimension ..................................................15
Figure 3-Front view of the selected roundabout design ............................................................................23
Figure 4-Roundabout Design: Front View...................................................................................................24
Figure 5-Roundabout Design: Top View .....................................................................................................24
Figure 6- Protective Casing .........................................................................................................................25
Figure 7-Roundabout Exploded View Parts and Materials List...................................................................26
Figure 8-LED Specifications.........................................................................................................................27
Figure 9-Boost Converter............................................................................................................................28
Figure 10-Battery Selected (12V)................................................................................................................29
Figure 11-Gear Train ...................................................................................................................................31
Figure 12-Electrical Placement ...................................................................................................................33
Figure 13-Pull Force v. Age..........................................................................................................................35
Figure 14-Stress Analysis: Evenly Distributed 800 lbf Load ........................................................................38
Figure 15-Deformation Analysis: Evenly Distributed 800 lbf Load .............................................................38
Figure 16-Stress Analysis: Concentrated 800 lbf Load................................................................................39
Figure 17-Deformation Analysis: Concentrated 800 lbf Load.....................................................................39
Figure 18-Flow Diagram..............................................................................................................................42
Figure 19-Prototype Mechanical System....................................................................................................44
Figure 20-Slip Ring Attachment ..................................................................................................................46
6. 6
Figure 21-Prototype Completed Assembly.................................................................................................47
Figure 22-Initial Alternator Test..................................................................................................................48
Figure 23-Battery to Slip Ring .....................................................................................................................49
Figure 24-Charge Control Testing ...............................................................................................................50
Figure 25-Complete System Testing ...........................................................................................................51
Figure 26-Power v. RPM..............................................................................................................................52
Figure 27-Current v. RPM............................................................................................................................52
Figure 28-Full-Scale Current v. RPM ...........................................................................................................53
Figure 29-Full-Scale Power v. RPM .............................................................................................................53
Figure 30-Extended Paddle Current v. RPM ...............................................................................................55
Figure 31-Extended Paddle Power v. RPM .................................................................................................55
Figure 32-Final Prototype ...........................................................................................................................56
Figure 33 Final Roundabout Design............................................................................................................57
Figure 34 - Site Overview............................................................................................................................58
Figure 35 - Topographic Survey, 13th & Adams .........................................................................................58
Figure 36 - Lot 1 Plan View..........................................................................................................................59
Figure 37- Dewatering Elevation View........................................................................................................64
Figure 38- Slab Rebar Detail........................................................................................................................65
Figure 39 - Playground Structure Plan View ...............................................................................................66
Figure 40-Playground Structure with Multi-Level Pavilion Architectural Concept.....................................67
Figure 41-Rain Garden Soil Profile..............................................................................................................67
Figure 42-Sean Dirscherl Pitch Presentation ..............................................................................................70
Figure 43-Team at Design Expo ..................................................................................................................70
Figure 44-Satisfied Customer......................................................................................................................71
Figure 45-Design Expo Poster .....................................................................................................................72
Section – I: Project Definition, Plan, and Requirements
1. Mission Statement
PowerPlay’s mission is to design an energy producing roundabout for parks, communities, and
residential homes to use anywhere in the world. This not only includes the design of the individual piece
of equipment but also the surrounding area which includes surface and subsurface design to provide a
safe, resilient, and sustainable area for decades of use. The energy that is produced by the roundabout,
used by children and adults throughout the day, could be used to store energy, power street lights, park
lights, water pumps, and other equipment as needed.
2. Background
7. 7
It is the intent of Team PowerPlay to harness the power of play to power electrical equipment. The
kinetic energy of the kids playing on the playground equipment will be transferred into electrical energy
using a mechanical system of gears and a generator. PowerPlay will design a roundabout park
equipment that will convert the kinetic energy produced by rotational motion of the roundabout. The
roundabout will be designed with the capability to store energy by means of a battery to power LEDs or
any electrical equipment within the vicinity of the park.
The playground will be part of a larger park concept for the City of Hoboken. Given a six acre plot of land
in the northwest corner of Hoboken, referred to herein as the Northwest Resiliency Park. The land,
currently owned by BASF but in the process of being procured by the city, is required to meet a number
of goals, some of which will be met by the park concept produced as a result of this project. The two
goals within scope of this project include stormwater runoff retention to protect the surrounding area
from local flooding, and internal protections in accordance with FEMA guidelines.
Research has proved that playground designs that convert kinetic energy into electrical energy do exist.
However, there are currently no commercialized playgrounds that utilize this technology. Empower
Playgrounds is a nonprofit organization that gives roundabouts (merry-go-rounds) to schools in Ghana
that can generate and store electricity. According to Empower Playgrounds, ‘A healthy 8- to 12-year-old
generates about 150 Watts of energy per hour using their equipment.’ Empower Playgrounds then
stores this energy in battery packs to be used in portable LED lanterns for children to take home and use
after dark. Empower Playground uses solar energy to supplement their energy production. Another
existing energy converting piece of equipment is a power generator that includes a rope for skipping
rope. The skipping rope equipment can produce 31.5 Watts per hour of play. The source that is powered
with the rope skipping equipment are school lights. This project will include designing equipment that
will have similar power outputs to those of the existing equipment previously described. The major
difference will be the source that PowerPlay will be powering, mainly being the playground itself to
provide a sustainable, resilient, and user-friendly playground.
3. Analysis of Stakeholder Needs
Table 1-Stakeholder Needs
Stakeholder Major Benefits Attitudes Win Conditions Constraints
Tax Payers Aesthetically pleasing
area to relax in
Likely
positive
Well maintained park
used frequently by the
community
Must be low cost
Children New playground to
play in
Positive Park is fun and
enjoyable
Must be for all age
groups
Parents -Charging stations -
Safe playground with
desired type of
flooring
-Good learning
environment for
children
Positive Park has charging
stations and teaches
their children about
sustainability
Must be safe and
made of material
that minimizes
germs
8. 8
City Workers -Job Security
-Easily maintainable
playground
Likely
positive
-Provides work
-Playground is
sustainable and
resilient
Must be easy to
assemble and
minimal
maintenance
Investors- Stevens
and Department
of Recreation
Giving back to the
community and
environment
Positive -Park generates
enough energy to
sustain
-Made valuable
investment into green
technology
Must function as
designed
To generate the stakeholder needs, an interview was conducted with various parents and their children
at local parks throughout Hoboken (Stevens Park and 10th and Hudson Park). The children were
identified as two groups, younger (2-5) or older (6-12) kids. The questions asked during the interview
included:
1. What is the most important aspect of the playground?
2. What is your child’s favorite playground equipment?
3. How often do you go to the playground?
4. What aspects of a playground make you want to return to it as opposed to others?
5. What equipment is most important to power (i.e., charging stations, overhead lights)?
From the interviews it was concluded that children of all ages enjoyed equipment they could climb on.
Most parents requested shade as it allowed the children and the playground equipment to remain cool
in the hot sun. The parents also requested benches close to the park equipment so that they could
supervise their children while relaxing. Majority of the parents wanted to see the power generated
from the playground equipment go towards lighting the park and walkways. The following Customer
Voice Table highlights some of the responses PowerPlay received during the interview and how the
necessary requirements were derived.
Table 2-Voice of Customer
Verbatim (VOC)
Restated as
customer need
Derived Requirement
“On hot days we normally stay at
the park for about an hour,
however if there is enough shade
we normally stay all day.”
Shade for both
parents watching
and children playing
The park needs to have a sufficient
amount of shade to ensure that users
can enjoy the park even on hot or
uncomfortable days.
9. 9
“There should be separate areas
for younger and older children to
prevent the older kids from
trampling the younger ones.”
Safe play
environment for
children of all ages
There should be distinct separation
between the areas that the younger
children play (2-6 years old) and the
older kids play (7-12 years old).
“I really like the playgrounds with
the soft plastic ground.”
Safe surface to
reduce injury from
falls
The ground that the children play on
should be soft to ensure that the
children will not hurt themselves upon
falling.
4. Project Scope and Resources
Table 3-Project Scope
10. 10
5. Project Plan
The project had two clear parts of the playground design that were completed by the two subgroups of
the project, being the Mechanical Engineer Team and Civil Engineer Team. The two parts of the project
in simplified form consists of:
Table 4-Simplified Project Plan
Project Team Responsibilities
Mechanical
Engineering Team
Design an energy converting roundabout equipment with:
Battery storage
LEDs to be placed as desired
Civil Engineering
Team
Design a green infrastructure with water storage in addition to foundations and
supporting structures that will be implemented.
A more thorough breakdown of tasks can be found in the Appendix (IV.A.Team Organization
Chart/Project Milestones and IV.B. Project Gantt Chart/WBS). The project plan consisted of four stages:
research, design of full scale roundabout and water retention system, prototyping, and testing.
i. Research
The first months of the project were dedicated to researching the energy converting system.
The selected energy converting system included a gear train connected in series with a
permanent magnet alternator (PMA). Piezoelectric technology and a reverse feed motor were
also considered for the project but were not selected due to their inability to produce enough
energy for the realm of the project. Through research, it was found that PMAs have “high
efficiency, simplicity, and reliability of construction” according to the Riga Technical University.
The efficiency of said alternators can be as high as 95% which is dependent on the number of
coil windings and magnet quality. This research confirmed the feasibility of PMA technology for
the application of this project. Besides the PMA, the codes and standards for playgrounds and
the electrical components were also researched and selected. The electrical components include
the battery and LEDs.
ii. Design of Full Scale
After research was performed on the energy converting system and electrical components,
design concepts were generated for the full scale roundabout design. A design was selected
based on a weighted Pugh matrix. A full scale roundabout design was created and refined
throughout the remainder of the first semester.
iii. Prototyping
A small scale prototype of the full scale design was designed and manufactured during the
second semester of the project. The prototype was a 3 foot diameter roundabout with a PMA,
bike chain sprocket system, charge controllers, LED strip, and battery.
11. 11
iv. Testing
After the prototype was constructed, testing was performed to evaluate the feasibility of the
project. The prototype was able to produce 20 W at a comfortable roundabout rpm of 18. This is
enough wattage to charge 7 cell phones.
6. Requirements for the Proposed Design
The requirements that drove the project were directly formed from the stakeholder needs as well as
from technical calculations to determine the power requirements for the full scale electrical
components. The following table includes the stakeholder requirements that were considered
throughout the lifetime of the project:
Table 5-Requirement Rating
Stakeholder Requirements
Requirement Importance
(1=Low/5=High)
Difficulty
(1=Low/5High)
1 Park is Safe. 5 3
2 Park is Enjoyable. 2 2
3 Equipment creates sufficient energy. 5 5
4 Surface has Storm Water Retention. 5 5
5 Park has sufficient shading. 3 2
6 Equipment requires minimal
maintenance.
3 4
7. Constraints and Assumptions
i. Constraints
The following table describes the constraints that affected the project. Along with these constraints,
further codes and regulations that influenced the project design will be discussed in Section 8.
12. 12
Table 6-Constraints
Dimension
Constraint
(state limits)
Driver
(state objective)
Degree of Freedom
(state allowable range)
Features High Factor of Safety -Equipment must be able to
handle proper stresses and
loads without yielding
-Equipment must meet
proper safety codes and
construction standards
Will be the primary factor in our
design; Factor of Safety>4
Quality -Joints and
attachments must have
no pinch points
-Material needs to
have high yield
strength
-Efficient drainage
surface
-Abide by codes by
eliminating pinch points or by
covering pinch points with a
gate
-High strength material for
durability and long life cycle
-Park is resilient
-Design concepts to eliminate
all pinch points that are
reachable by children or adults
-Steel infrastructure
-Surface Permeability greater or
equal to 0.4gal/yd^2/s
Cost Budget cannot exceed
$700 without sponsor
Budget limits supplies and
size of park
Budget overrun up to 15%
acceptable without executive
review
Schedule -Winter break will
cause the team to
separate for 1 month
-Team must follow
critical path to stay on
track
The Work Breakdown
Schedule must be followed in
order to prevent delays
The production and assembly of
the project will be completed
one month before the Senior
Design Expo
Staff Maximum team size is
4 MEs and 4 CEs, plus
an ME and CE advisor
MEs design energy efficient
mechanisms and CEs design
drainage system
8 students needed plus
professional consulting if
needed
Users -Playground use should
not exceed 10
allowable users
-Equipment designed
for ages 6-12.
-Too many people playing on
equipment at once can
damage the equipment
and/or themselves
-Children must use age
appropriate equipment to
avoid injury or death
Playground equipment will have
FOS>4 and very high tensile
strength.
Weather Cold winter months
and rainy days
Bad weather will hinder the
amount of visitors in the park
The amount of visitors is
proportional to the
temperature and weather
ii. Assumption and Dependencies
13. 13
Table 7-Assumptions & Dependencies
Assumptions/Dependency
1. The number of visitors attending the park will remain constant throughout the year. It is
expected that 100-200 children will play on the playground weekly.
2. All wiring and electronic circuitry will be locked and covered so it is non-accessible to children.
3. The park will have a life cycle of 20+ years with proper maintenance and inspection by the
Hoboken Parks Department.
4. All safety codes will be met and accounted for.
5. Energy produced will be stored in a battery when lights are not on.
6. Parents or guardians will be supervising children to prevent injury on the equipment.
One of the most important constraints for the roundabout is the requirement for a high factor of safety.
The roundabout needs to handle a load of at least 1080 pounds and have a FOS greater than 4 to ensure
the safety of the children at play. The equipment will be designed for a specific age group, mainly ages 5
to 12, with a maximum number of allowable users being 10. The FOS greater than 4 and high tensile
strength is factored in just in case the users exceed the maximum allowed on the equipment.
Another important design consideration is pinch points. Any part of the design and structure that has
any joints and attachments must not have any pinch points. Eliminating or concealing pinch points
reduces children and parents from getting hurt. Similarly, all circuitry must be hidden and out of reach
to prevent children from injuring oneself. In order to withstand high loading and varying weather, the
roundabout design will be made of a high strength material. A steel infrastructure is optimal as it will be
able to handle large loads while quality plastics can be used on the outside of the structure to handle
child loads and weather conditions.
To reduce flooding in harsh areas such as Hoboken, the surface needs to drain and house enough water
underneath. The permeability of the surface should be greater than 0.4 gal/yd^2/s to effectively collect
and store flood water. Weather causes less people to attend the park and therefore, less people to play
on the roundabout, thus producing less energy to power sources such as overhead lights, charging
stations, etc. Proper battery storage will be used to enable the LEDs to light up when it is
dusk. However, as long as there is nice weather, the park attendance will remain constant.
8. Applicable Codes/Standards/Regulations
i. Codes Relevant to Roundabout Design Criteria
The requirements that must be implemented into the roundabout design are from the U.S. Consumer
Product Safety Commission. Such requirements include:
14. 14
1. The underside of the round platform should be no less than 9 inches above the level of the
protective surfacing beneath it.
2. The User Zone should extend a minimum of 6 feet beyond the perimeter of the platform in all
directions.
3. The standing/sitting surface of the platform should have a maximum height of 18 inches above
the protective surface (ages 6+).
4. The fall height should be below 8 feet.
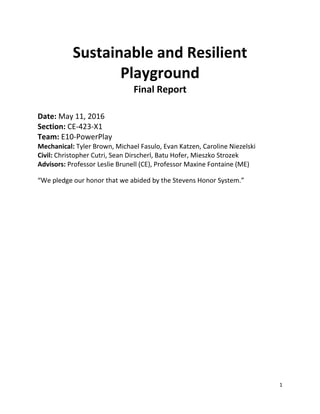
Figure 1-Front View of Full Scale Roundabout with Code Dimensions
Figure 1 illustrates the code dimension requirements. According to the U.S. Consumer Product
Safety Commission the fall height is a measurement defined as the “vertical distance between
the highest parts of the equipment intended for foot support to the protective surfacing
beneath it.” This should not exceed 8 feet. The bottom surface of the platform should not be
more than 9 inches off the ground. This is to ensure that the children that play on the
equipment cannot crawl underneath and get stuck. Figure 2 below shows the top view of the
roundabout with the User Zone dimension specified. This dimension should be at least 6 feet
beyond the perimeter of the roundabout in all directions. This means that no other playground
equipment or light fixtures can be placed within this region. This is important because if a child
is thrown off the roundabout, the child should not be in danger of hitting any surrounding
objects.
15. 15
Figure 2-Top View of Full Scale Roundabout with User Zone Dimension
ii. Codes Relevant to Water Retention System
While codes relevant to the environmental implications of potential for storing raw sewage proved
generally elusive, a number of regulations for the detention system overall were provided by the
manufacturer and North Hudson Sewerage Authority that factored into the design.
Relevant requirements from the pipe manufacturer, ADS, include:
i. 36 through 60-inch pipe shall have a smooth interior and annular exterior corrugations and
meet or exceed ASTM F2881 and AASHTO M330.
ii. Manning’s “n” value for use in design shall be 0.012.
iii. Installation shall be in accordance with ASTM D2321 and ADS recommended installation
guidelines, with the exception that minimum cover in traffic areas for 12 through 48-inch
diameters shall be one foot. Backfill for minimum cover situations shall consist of Class 1,
Class 2 (minimum 90% SPD) or Class 3 (minimum 95%) material.
Relevant requirements from the North Hudson Sewerage Authority – Connection Review Checklist
regarding new connections to storm sewers include:
i. Laterals should be connected to the sewer with a tee connection if the lateral is less than or
equal to 18 inches in diameter. If the lateral is greater than 18 inches in diameter, then the
connection should be made using a doghouse manhole.
ii. Storm sewer laterals must have adequate capacity to handle drainage from property during
a 2-year storm event. Sizing calculations should be submitted by the Applicant, signed and
sealed by a Licensed Professional Engineer.
Relevant requirements from the North Hudson Sewerage Authority – Connection Review Checklist
regarding detention systems include:
16. 16
i. The detention system must be designed to retain to the 10-year storm event and must
satisfy at least one of the following conditions: 1) If the impervious area of the post-
developed site is greater than the impervious area of the pre-developed site then the post-
development site will generate no greater peak runoff from the site than prior to
development. This includes for two-year and 10-year storm conditions, considered
individually, or 2) If the impervious area of the post-developed site is less than or equal to
the impervious area of the pre-developed site then the post-development outflow over a
30-miute period of a 10-year storm will be the same as that of a two-year storm during the
same time period.
ii. The design storms shall be defined as either the estimated maximum rainfall for the
estimated time of concentration of the runoff at the site when using a design method such
as the Modified Rational Method, or a 24-hour storm using the rainfall distribution
recommended by the US Soil Conservation Service procedures.
iii. The Storage Indication Method (also known as the modified Puls method) will be used as
recommended in Chapter 6 of the New York Department Guidance Manual.
Relevant Requirements from Hoboken City Code, Chapter 104: Flood Damage Prevention, include:
i. All new construction and substantial improvements shall be anchored to prevent flotation,
collapse, or lateral movement of the structure.
ii. All new construction and substantial improvements shall be constructed using methods and
practices that minimize flood damage.
iii. New and replacement sanitary sewage systems and waste lines shall be designed to
minimize or eliminate infiltration of floodwaters into the systems and discharge from the
systems into floodwaters, either by elevation or by installation of check valves and backflow
preventers.
iv. Freeboard. All new construction and substantially improved residential and nonresidential
structures located in an area of special flood hazard shall have the lowest floor elevated to
the base flood elevation or advisory base flood elevation, whichever is applicable, plus
freeboard as specified in Table I below. Enclosed areas that are used solely for parking,
building access, or storage are not the lowest floor and shall be allowed below the
BFE/ABFE, provided the enclosed areas meet the requirement set forth in § 104-16E above.
For all zones within the City of Hoboken, freeboard shall be measured from the bottom of
the lowest horizontal structural member. In the case of this property, Freeboard
requirements list a minimum of 1ft above the Base Flood Elevation.
v. Fill. Fill shall not be used to elevate structures or for structural support.
While some of the finer points of design, most notably a connection to the existing sewer, would only be
included in this report with greater cooperation and information sharing from the North Hudson
Sewerage Authority, these minimum requirements were often well exceeded by the detention system
proposed, particularly requirements for a 10-year storm.
Section – II: Playground Equipment Design &
Optimization
17. 17
9. Concept Development and Selection
The team utilized the pre-development time to generate alternatives for some of the larger decisions
that would go into the design of the energy producing park equipment. The two main aspects of the
project that were focused on most heavily were the energy converting mechanism that would be
utilized and the form that the roundabout equipment would take. To assist in the decision making
process, weighted Pugh matrixes were generated for each.
i. Energy Converting Mechanism Concepts and Selection
The Energy Converting Mechanism was the primary component for this project. It must be able to
convert the rotational kinetic energy from the children playing on the roundabout into usable electrical
energy to power the overhead LED lighting system. After performing research, three energy converting
mechanisms were chosen and considered for the roundabout design. Such mechanisms include
piezoelectric, reverse feed motor, and permanent magnet alternator (PMA) technologies. The following
table describes each mechanism and the pros and cons associated with said mechanisms.
Table 8-Description of Energy Converting Mechanisms
Energy Converting Mechanisms
1. Piezoelectric
How it works: Voltage was
created across the sides of
crystal in the piezo sensor
when subjected to mechanical
stress (squeezing it)
2. Reverse Feed Motor
How it works: Motor was altered
to allow backfeed. Backfeed
produces a single AC current which
induces a current toward the
power source when the voltage
was positive. If the voltage was
negative, the motor would induce a
current to flow out of the power
source to the motor.
3. Permanent Magnet
Alternator (PMA)
How it works: It was a modified
car alternator where the
electro-magnet in the rotor has
been replaced with a strong
Neodymium magnet. As the
rotor spins, it energizes the
magnet to induce a magnetic
field to create energy. PMAs
were specifically designed to
generate more voltage at low
RPMs compared to car
alternators.
Pros: Pros: Pros:
18. 18
Very small mechanism
Very inexpensive: $13
Easily altered to allow
backfeed
Inexpensive: $18
Can produce adequate
energy: 14 W at 60 RPM
Long life cycle: up to 50
years if brushless
Can produce as much as
100 W at 60 RPMs
Little to no
maintenance
High efficiency: up to
95%
Cons:
Not well developed for
rotational motion
Very short life cycle (1
year)
Produces very little
energy: 0.92 mW at 60
RPM
Cons:
Current could flow toward
the motor from the power
source if voltage was
negative; required extra
circuitry to prevent this.
Very inefficient: as low as
60%
Requires frequent
maintenance: greasing
Cons:
Becomes harder to spin
as the loading size
(battery) increases
Very expensive: $200
There was no way to
regulate the output
power so this must be
accomplished by
external circuitry; dump
load and charge
controllers required
The energy converting mechanism was chosen by means of a weighted Pugh Matrix. The
selection criteria included affordability, size of device, safety, power generation, and life cycle.
The highest weighted selection criteria included power generation with 50%, safety with 20%,
and life cycle with 15%. These weights were selected based on the project stakeholder
requirements.
Table 9-Pugh Matrix for Energy Converting Mechanisms
From the Pugh Matrix it can be seen that PMA was the top rated mechanism. It ranked 10 out of
10 in both the life cycle and power generation categories. Although it was the most expensive
mechanism by far, it made up for this by having a very long life cycle of about 50 years. The
19. 19
reverse feed motor would accumulate a cost of about $300 over the course of 50 years so the
upfront cost of the PMA was reasonable.
ii. Roundabout Equipment Concepts
Four roundabout design concepts were created based on stakeholder requirements. All
concepts utilize PMA(s). The concepts were ranked based on a weighted Pugh Matrix where the
selection criteria consisted of customer approval, life cycle, affordability, safety, and power
generation. The weights of the selection criteria were based on the project requirements. The
four concepts were Concept 1: Tornado, Concept 2: Double Decker Roundabout, Concept 3:
Planetary Gear, Concept 4: Cyclone. The following section would describe each roundabout
design concept.
1. Roundabout Concept: Tornado
Table 10-Roundabout Concept: Tornado
23. 23
For the Pugh Matrix above, it was assumed that all roundabout concepts would have the same gear
ratios so therefore, the PMAs would generate the same amount of power for each. Based on the results
of the Pugh Matrix, the top rated roundabout design was Concept 4: Cyclone. The Cyclone Design was
the top rated design in the customer approval category and tied in the power generation category.
Although the Cyclone design scored the lowest in the safety category, there were existing roundabouts
on the market that have similar climbing features. Therefore, safety should not be a large concern.
Figure 3 shows a front view of the selected roundabout design.
Figure 3-Front view of the selected roundabout design
10. Preliminary and Detailed Design
i. Preliminary Roundabout Design Description
Solidworks was used to create a 3D model and 2D drawings of the preliminary Roundabout design. The
major dimensions of the Roundabout are a height of 8’4.7” with a maximum diameter of 8”. The
Roundabout was also designed with a maximum fall height of 5’10” which was well below the Customer
Safety Code maximum fall height requirement which was to be less than 8’.
24. 24
Figure 4-Roundabout Design: Front View
Figure 5-Roundabout Design: Top View
The platform itself was 3” thick with a diameter of 8’. In addition, the platform was designed with 8
handles spread out evenly around the edge of the platform. These handles were included in the design
in order to give the users something to grab to help them maintain a strong grip while playing. These
handles were also designed with a large fillet to create a smooth surface that allowed the users to easily
slide their hands in and out of the handles to prevent injury. The hollow box sitting under the
Roundabout pictured in Figure 6 below is the protective casing that houses the gear train along with the
PMA. The gear train was the components that would act as the transferring mode of the kinetic energy
from the roundabout spinning to the alternator. The dimensions of the box were 1’6” x 2’1”x 0’7” with a
thickness of 4 inches. It was important that the protective box was designed with durability and
sturdiness in mind as it would protect the most sensitive elements of the project.
25. 25
Figure 6- Protective Casing
The preliminary Roundabout Design consists of 8 parts/subsystems. These parts/subsystems along with
the materials can be seen in the following figure. The materials that were used were galvanized steel,
polyethylene, 52100 steel, and steel. Galvanized steel was chosen due to its long life cycle and strength.
Similarly, high density polyethylene was chosen due to its high tensile strength, scratch/crack resistance
and ability to withstand high temperatures.
27. 27
ii. Electrical Design
a. Power Requirements
Figure 8-LED Specifications
The power requirements were approached at a modular level. It was researched that for a living area,
5,000 lumens per 250 square feet was sufficient to light the area. The preliminary Roundabout design
covers approximately 400 square feet; this accounts for the 8 foot diameter of the round platform and
the additional surrounding 6 foot User Zone. With this data, the required lumens for the roundabout
space was 8,000 lumens. It was assumed that a deviation of 20% from the target lumens would be
sufficient for the application because the area being lit was outdoors whereas the research was based
on the lumens required for indoor lighting. The LED that was chosen that best meets these lumen
requirement has a luminous efficiency of 105.26 lm/W. The LED specifications can be seen in Figure 8
Another assumption made was that the roundabout area was required to be lit for 5 hours out of the
day, because typical residential codes require lights to be off after 10 PM. With these known variables,
the required power output per hour was calculated by dividing the lumens by the efficiency. The
required power output per day was calculated by multiplying the required power output by the 5 hour
lighting time. The following table shows the power output specification range that was calculated by
means of the modular approach. The minimum required Amp hours (AH) were calculated for both a 12V
and 24V battery. Both batteries are viable in the system, so cost and output needs would dictate which
battery would be selected on a case-by-case basis. The minimum AH was calculated by dividing the
power output per day by the voltage of the battery.
28. 28
Table 15-Power Output Specifications
Minimum
Lighting
Target
Lighting
Maximum
Lighting
Required Lumens 6,400 lumens 8,000 lumens 9,600 lumens
Required Power Output 60 Watts 76 Watts 91 Watts
Required Power Output per Day 300 W*hr 380 W*hr 456 W*hr
Minimum Required Amp hours (AH) for 12 V
Battery
25 AH 32 AH 38 AH
Minimum Required Amp hours (AH) for 24 V
Battery
13 AH 16 AH 19 AH
Based on these lighting requirements, two of the chosen 4,000 lumen LEDs would be used to produce
the target 8,000 lumens. In order to power the 120V LEDs, a boost converter would be required to be
in the circuit to boost the voltage of the battery (either 12V or 24V) to 120V. An efficient DC-DC Boost
Converter was chosen that can convert 10-48V to 120V and can be seen in Figure 9. This Boost
Converter only requires 80 mA of current. This would affect the previously calculated required AH very
minimally. To account for this, 1 AH would be added to each calculation.
Figure 9-Boost Converter
29. 29
b. Battery
The battery was selected based on the required AH and cost. It was determined that a Lead Acid
Battery would be the best type for this application due to its relatively low cost, reliability, long
life cycle, and robustness. A 12V 55 AH Lead Acid battery was chosen because it satisfied the
corrected minimum AH requirements of 33 AH. A 55 AH Lead Acid battery was chosen to
compensate for the inefficiencies associated batteries. Compared to the 24V 34AH battery, the
12V battery was much more inexpensive. This battery would store the power generated by the
Roundabout. This power would be used to power the two LED lights.
Figure 10-Battery Selected (12V)
c. Alternator
The permanent magnet alternator (PMA) was chosen based on the power requirements and
achieving those power requirements at low RPMs. It was determined that a 12V 3 Phase AC
Wind Turbine Permanent Magnet Alternator was the best PMA for this application because it
was designed for varying wind speeds. The 12V 3 Phase AC current was converted to DC by
means of a 6 Bridge Rectifier. This alternator must be spun at least 60 RPM to start producing
power. The chosen PMA specifications and parts can be seen in the following Table 16.
30. 30
Table 16-Permanent Magnet Alternator Specifications
This PMA worked on the premise that excitation current determines the strength of the magnetic field
of the coil along with the speed of the rotor. This magnetic field then induced voltage at the alternator
terminals. If the alternator was not connected to the load (or anything), there was no power flow, but
instead, voltage was established with this magnetic field. The voltage would be strictly a function of the
rotor speed and excitation current and voltage. For this project, a 12V 55AH Lead Acid battery (load)
would be attached to the alternator terminals. With this load applied on the alternator, the magnetic
field would induce voltage and current and thus, power would flow to the battery. The amount of
voltage produced would be closely matched to the 12V load that was attached. The current produced
would be a function of the load size and the RPMs of the alternator. From the Power Curve Graph in
Table 16 it can be seen that if the alternator spins at 100 RPM, approximately 100 W of power was
produced. With the power requirements per day being 380 W*h, this means that the Roundabout would
have to spin at this RPM for about 4 hours to achieve the daily power requirements. With this data, the
gear train can be designed to have the proper gear ratio to achieve the power requirements with the
lowest feasible alternator RPM.
31. 31
iii. Gear Train
In order to design the gear train, research was performed to determine what a comfortable RPM was for
spinning a roundabout. Based on existing roundabout statistics, a comfortable RPM was between 15 and
30 rpm. A gear train was designed to increase the angular velocity of the output gear that was attached
to the alternator because 30 RPMs wasn’t nearly enough to produce sufficient energy. The gear train
was designed to achieve a minimum output RPM to the alternator of 60 RPM based on the alternator
specifications. The designed gear train can be seen in Figure 11 below. The gear train uses a ring gear as
an input gear that was mounted around the spinning shaft of the roundabout. The ring gear has teeth
around the outside to connect with the other gears in the gear train. The ring gear has 100 teeth and it
was connected to a smaller gear that has a radius of 1.26 inches and 30 teeth. The smaller gear was an
idler gear that would just transition the input ring gear to the output gear with a common teeth ratio.
The first idler gear would be attached to two other idler gears that have a radius of 1.02 inches and 24
teeth each. The last two idler gears were just put in place to provide spacing for the large alternator
inside the casing.
Figure 11-Gear Train
The reason three smaller idler gears were chosen was because larger gears are more expensive than the
smaller gears. This can be seen in the table below. After a cost analysis, it was determined that three
smaller idler gears would be more cost efficient.
32. 32
Table 17-Gear Costs
The last idler gear is connected to the output gear which also has 24 teeth. This output gear would spin
at a range of 62.5 to 125 rpm ideally. This was calculated using the following equation:
Where:
ω= Angular Velocity
N= Number of Teeth
A= Ring Gear (input)
B= Idler Gear(s) - Used for Spacing
C= Small Gear (output)
iv. Electrical and Mechanical Integration
Figure 12, below, shows the electrical placement compared to the mechanical system. The two LEDs
would be placed 6 feet from the outer edge of the Roundabout on both sides. The conduit from the
alternator would be fed underground to an electrical cabinet where the boost converter and battery
would be stored. A different section of conduit would be fed underground from the electrical cabinet to
the two LEDs in the system.
33. 33
Figure 12-Electrical Placement
v. Manufacturing Process
The round platform was designed to be manufactured by means of injection molding in pieces using
high density polyethylene. The platform would be bolted together using male and female fitted pieces.
The spinning shaft would be made of galvanized steel and mounted in the ground through concrete.
There were two bracket designs, both of which were constructed of galvanized steel and both have 4
arms connected to the platform via bolts. One of the brackets was designed to lay flat under the
platform while the other bracket was designed with an upward angle with the arms connected near the
edges of the platform. Each of these brackets consist of two symmetrical pieces holding two arms each.
These sections would be held together via bolts to tightly grasp the shaft. In order to keep the brackets
in their proper positions on the shaft, small indents would be made in the shaft where the brackets
would be fitted, thus preventing the brackets from sliding along the shaft.
vi. Footing Design
In the idea for modular deployment of this roundabout, a generic implementation a footing must
be designed for installation in various types of soil. The below footing is designed for safe use in
any soil type, with the weakest type, clay, used as a benchmark. Because clay has an allowable
soil pressure of 1,500 pounds per square foot, the footing should be over designed in all other
types. Loading patterns were accounted for by combining vertical loads from standing children
as well as horizontal loads from pushing and pulling from the highest point on the roundabout.
Analysis yielded a dead load of 1,200 pounds, live load of 350 points, and wind load of 620
34. 34
pounds. These over designed values were derived from the centripetal force that the center
point of the structure would experience if the structure was rotating at the stated maximum
speed (30 rpm) with a design capacity of 5 children each weighing 100 pounds. Applying the
factors of safety per the LRFD method, a total factored load of 2782 pounds was used the
design the roundabout footing.
The minimum area required for the footing without factored loading was determined to be 1.09
square feet. The team chose the dimension to be 2 feet by 2 feet, well beyond the minimum
area requirement. It was determined, through required checks, that the length of the critical
perimeter of puncture would be 26 inches. The shear force acting on the perimeter was
calculated to be 2,609 pounds while the nominal shear strength was to be 19,733 pounds. The
bending moment experienced by the footing was calculated to be 33,384 lb-in. Assuming 60 ksi
steel, the minimum steel reinforcement area would be 0.578 square inches. Given the potential
irregular and unpredictable forces that would be encountered from the roundabout, a greater
amount of rebar was designed for safety. 16 #3 bars were chosen. There are 2 layers of rebar:
the anchor bolts go through one layer plane of reinforcement bars as recommended. Each bar
has at least 3 inches of cover. This arrangement results in a steel reinforcement area of 1.76
square inches.
The connection of the roundabout to the foundation can be done in several ways. After
conducting research, it was determined that the best method of connecting the roundabout to
the foundation would be through the use of anchor bolts. The team chose to use 4 A36 ½ inch
anchor bolts to fasten the structure. The bolts can be attached to a steel plate via drilling or
casting in place, depending on the way it would be attached to the base pole of the
roundabout. In accordance with the playground code in most states, the top of the foundation is
4 inches below the ground, as it must be completely covered in order to avoid tripping hazard.
See Appendix H for more information.
35. 35
11. Design Evaluation Methods
i. Force Gauge Data Collection
The torque requirements of the selected PMA were investigated to ensure that the target customer can
use the Roundabout successfully and produce enough power. A group of 5 to 6 year old girls and boys
were asked to perform testing to see how much lbf they could pull. A force gauge was used to collect
this data. The force gauge was simply a strain gauge with a hook on one end and a digital display to
show the force applied to the gauge. The average force produced from the 5 to 6 year olds was 27 lbf.
After researching the push to pull ratio of the humans it was discovered that the average push to pull
ratio was roughly 1.5. Given this ratio, the average push force of a 5 to 6 year old was calculated to be
40.5 lbf. Because the target age group of the Roundabout was 6 to 12 years old, an assumption was
made that the children within this age group would be stronger than the 5 to 6 year olds that were used
to collect the data. A chart showing the spread of pull force vs age was shown below.
Figure 13-Pull Force v. Age
ii. Start-Up Torque Criteria
In order to begin rotating the Roundabout starting at rest, a start-up torque must be overcome. In order
to begin spinning the generator the start-up torque of the generator must be surpassed, therefore a
torque of 28.28 lbf*ft must be overcome. In addition, the generator needs to rotate at a minimum
speed of 60 RPM to generate power. The Roundabout must spin at 15 RPM in order to create an output
of 60 RPM on the generator based on the designed gear train. Using the Mechanical Advantage (Gear
Teeth Ratio) along with the lever arm length, the input force that was required to overcome the torque
requirements created from the gear train and alternator was calculated to be 29.46 lbf. The calculations
can be seen below:
36. 36
Table 18-Start-up Torque
In addition to the force requirements created from the gear train and alternator, the force required to
rotate the Roundabout based on its moment of inertia need to be considered. To start, the approximate
weight of the HDPE platform from the SolidWorks model which was found to be approximately 807 lbs.
The weight of the children sitting on the platform was also accounted for. After performing research, the
average weight of children between the ages of 6 and 8 was found to be 45 lbs. An assumption was
made that on average, 4 children would be riding the Roundabout at a time. The total weight of 4
children and the platform was 987 lbs. From there, the weight was converted to mass and the moment
of inertia of the Roundabout was calculated using the mass and lever arm of the platform (4 ft radius).
Now that the moment of inertia was calculated, the angular acceleration needed to solve for in order to
bring the Roundabout from rest to 15 RPM (the required input speed to reach the requirement 60 RPM
output). A time of 8 seconds was assumed to get the platform from rest to 15 RPM. With these
variables, the angular acceleration was calculated to be 0.20 rad/s^2. Using the moment of inertia, the
angular acceleration, and the lever arm, an applied force of 12.04 lbf was calculated as the requirement
to get the platform from rest to the required speed of 15 RPM. See calculations below:
Table 19-Input Force Calculations
37. 37
Based on the calculated force requirements, to overcome the start-up torque from the gear train and
alternator as well as the moment of inertia of the platform, an inputted force of 41.5 lbf on the platform
is required. From the force gauge testing that was conducted on grade school children (Section Force
Gauge Data Collection), the average push force of a 6 year old child was approximately 40 lbf. This
would mean that it would be very difficult for a 6 – 8 year old child to operate the Roundabout alone
and would need to be operated by 2+ users. However, the average strength of children 8 - 12 years of
age can be assumed to be higher and therefore would be able to be operated individually by the older
users.
iii. Stress Analysis
Stress Analysis: Evenly Distributed 800 lbf Load
The Roundabout was designed to handle 10 riders. It was assumed that the heaviest Roundabout users
would be approximately 80 lb. Utilizing the Finite Element Analysis feature in Solidworks, a static
analysis was created to confirm that the design was capable of holding 10 riders. With this data, a 800
lbf was applied pushing down evenly throughout the top of the roundabout in the static analysis. The
analysis showed that the galvanized steel beams had a maximum von Mises stress of 9.07+06 N/m^2
which was noted around the ring of the flat brackets. The yield strength of galvanized steel was
20.4e+07. Since the yield strength was much higher than the maximum von Mises stress, the galvanized
steel would not see plastic deformation, nor would it fail. The deformation caused by the applied force
was then analyzed and the maximum deformation was found to be 0.42mm around the edges of the
platform above the flat brackets. Lastly the factor of safety of the Roundabout was analyzed and found
to be 5.99. This means that the Roundabout would be able to withstand an evenly distributed load of
4790 lbf, which well surpasses the maximum load needs. See von Mises Stress and Displacement
Analysis below:
38. 38
Figure 14-Stress Analysis: Evenly Distributed 800 lbf Load
Figure 15-Deformation Analysis: Evenly Distributed 800 lbf Load
Stress Analysis: Concentrated 800 lbf Load
A different scenario was analyzed where all the users would be piled on one side of the platform. The
static analysis was designed to hold the same weight used in the evenly distributed analysis of 800 lbf,
but instead of evenly distributing the load, the load was concentrated on a 2 foot diameter section
above the support beams. This was done because from the previous static analysis, the maximum
deformations were along these beams. From the analysis, a maximum von Mises stress of 4.432e+07
was calculated along the face of the galvanized steel beam facing the applied load. As stated previously,
the yield strength of galvanized steel was 20.4e+07, denoting that the beam would not plastically
deform nor fail from the current load. Next, the maximum deformation of the Roundabout was analyzed
and found to be 3.47mm along the edge of the platform where the load was applied. Lastly, the factor of
safety was found to be 1.19. This denotes that the beam would be able to withstand a concentrated
force of 952 lbf before breaking. This fits the project requirements as it was extremely unlikely that such
a high load be applied to such a concentrated area along the platform. See the von Mises Stress and
Displacement Analysis below:
39. 39
Figure 16-Stress Analysis: Concentrated 800 lbf Load
Figure 17-Deformation Analysis: Concentrated 800 lbf Load
iv. Battery Charging and Discharging
The 12V 55 AH Battery charging and discharging times were calculated for the alternator RPM upper
(125 RPM) and lower (62.5) range values that correspond to the Roundabout being spun at 30 RPM and
15 RPM. The following table shows all the specifications that were used to calculate the charging and
discharging.
40. 40
Table 20-Power Requirements
The calculations for charging the battery fully can be seen in the following table. The ideal charging time
when the alternator was spinning at 62.5 RPM was about 20 hours and about 7 hours at 125 RPM. This,
of course, was the ideal case and does not account for the inefficiencies that pertain to Lead Acid
batteries. A 40% efficiency loss was typical for Lead Acid Batteries. This means that a 55 AH battery
really requires 77 AH to be fully charged. As a result, the actual full charging times were calculated to be
about 28 hours at 62.5 RPM and 9 hours at 125 RPM.
Table 21-Battery Charge Times: Full Battery
Charging Times for Full Battery
The charging times for charging the battery to meet the LED power requirements was also calculated.
This describes the worst case scenario that would need to be achieved daily. The actual battery charging
times were found to be about 17 hours at 62.5 RPM and about 6 hours at 125 RPM.
41. 41
Table 22-Battery Charge Times: LED Requirements
Charging Times for Battery Charged to LED Power Requirements
When the battery was fully charged, the battery would power the 2 LEDs for about 9 hours. If the
battery was only charged to the LED power requirements, the battery would power the 2 LEDs for 5
hours. Both scenarios meet the requirement to power the 2 LEDs for 5 hours.
Table 23-Discharge Calculations
12. Physical Prototyping
i. Prototype Purpose
A small scale Roundabout was designed and built during the second semester of the project. The intent
of the prototype was to collect data on the power generated at varying RPMs of the alternator that
would be scaled proportionally to the full scale Roundabout design. From this scaled data, it would be
determined how long it would take to charge the 12V 55AH battery being used for the full scale
Roundabout. This actual data would be compared to the previously calculated theoretical battery
charging time.
ii. Prototype Plan
The following flow diagram shows the prototyping plan that will be completed from Feb-Apr 2016.
42. 42
Figure 18-Flow Diagram
iii. Budget
The group was allotted $700 to construct the prototype. However, after discussing the prototype with
Professor Fisher from the Mechanical Engineering Department, the group was given the extra $140 to
complete the prototype.
44. 44
13. Prototyping and Testing
i. Mechanical System
Figure 19-Prototype Mechanical System
The prototype, much like the full scale Roundabout design, consists of two systems, the mechanical and
the electrical. The Mechanical System can be seen in Figure 19 above. The system consists of four
subsystems, mainly the Platform/PVC Pipe/Slap Paddles, Bracket/Large Sprocket/Shaft/Base/Bike Chain,
Generator Riser, and Casing. The casing houses the electrical components and raises the prototype to a
comfortable spinning height. The user pushes against the slap paddles to spin the platform. The shaft is
the component that does the actual spinning as it sits freely in the base. The shaft and large sprocket
that is attached to the shaft is the component that transfers the kinetic energy from the user pushing
the slap paddles to the bike chain. The bike chain is attached around the two sprockets in the system.
The bike chain transfers the kinetic energy to the small sprocket and alternator. Rather than using a gear
train in the prototype, a bike chain was used instead. This is because of its lower cost compared to a
gear train. A gear train is more appropriate for the full scale Roundabout design due to its reliability and
life cycle. This criteria was not as crucial for the prototype design. A detailed description of the
Mechanical System Components can be found in the Appendix V Section C.
45. 45
ii. Electrical System
Electrical System
The Electrical System consists of the Permanent Magnet Alternator (PMA) that will be used in the full
46. 46
scale Roundabout Design. As the PMA is spun, a 3 Phase AC current is generated. The rectifier converts
this AC current to a usable DC current for the battery. A 12V 12 AH battery was used to satisfy the
current requirements for LED Strip that will be powered by the system. Two Charge Controller, Tristar
and SunSaver, are attached to the battery. The Tristar is used to monitor the charging of the battery.
Once the battery is fully charged or the current exceeds the set limit for the Tristar, the Tristar will divert
the load to the Dump Load. The SunSaver monitors the discharging of the battery to prevent over
discharging of the battery. Two 5 Amp fuses are used in the system to protect the battery and the 6 Amp
rated Sunsaver. The slip ring is used between the SunSaver and the RGB LED strip to prevent the
spinning wires from tangling. A more detailed description of each of the components in the Electrical
System can be found in Appendix V Section D .
iii. Fabrication
The prototype was constructed in the Griffith Building from March-April 2016. A bandsaw and power
drill were the major tools used to construct the prototype. The casing, generator riser, slap paddles, and
a wooden platform to connect the slip ring to the casing as seen in Figure 20 were the only components
that were made from scratch. The bracket and shaft were both designed by the team and fabricated in
the Machine Shop. The platform and base were both salvaged for spare parts. The PVC pipe, Small and
Large Sprocket, Bike Chain, Alternator, and all Electrical Components were purchased. The Mechanical
System of the prototype was the first subsystem to be fabricated. After this was completed, the
Electrical System was slowly integrated into the prototype. The prototype was completely assembled on
April 13, 2016.
Figure 20-Slip Ring Attachment
47. 47
Figure 21-Prototype Completed Assembly
iv. Testing
After the Mechanical System was fabricated, the Electric Subsystem was slowly integrated into the
system. The electric circuit was tested in various steps before wiring the entire system. The testing
outline was as follows: LED Current Draw, Initial Alternator Test.
a. LED Current Draw
First, the group determined how much current was needed for the individual LED colors (red, blue,
green, and white). Collecting this data was necessary in order to determine how each color scheme of
the LEDs affects the discharge of the battery. This data will be used towards the end of testing to keep
track of the discharge rate compared to the charge rate. The original AC/DC power supply for the LED
tape lights were stripped and multimeter was used to measure the current needed for the individual
LED colors. The amount of current for each color is:
Red=1.2 A
Green=1.2 A
Blue=1.02 A
White =2.6 A
48. 48
b. Initial Alternator Test
Next, the alternator was wired with the rectifier, fuse, slip ring, and tape lights as shown in Figure 22 to
test if the alternator was producing power. The roundabout was spun at a low rpm to prevent exceeding
the 12V tape light voltage rating. The Alternator was able to power the LEDs at very low RPMs. This
portion of testing was successful and the alternator was determined to be functioning properly.
Figure 22-Initial Alternator Test
49. 49
c. Battery to LED Test
Next, the 12V battery with the 12V tape lights was tested to ensure that a 12 AH battery could
efficiently power the LEDs. Based on theoretical calculations, the battery should have no issue powering
the 5A rated LED lights, but this testing was performed as a precaution. This portion of testing was
successful. The 12 AH battery was able to power all the color schemes for the LED lights.
Figure 23-Battery to Slip Ring
50. 50
d. Charge Controller Testing
Both Charge Controllers, the Tristar and SunSaver, were tested individually before being integrated into
the system. The Tristar Charge Controller was programmed and installed to perform in Diversion Load.
In Diversion Load, the Tristar would divert any excess current to the Dump Load. The Tristar was initially
tested by being connected to the battery only. The Tristar was able to detect that the battery was fully
charged (LED is green). In order to determine the validity of the TriStar reading, a RS-232 Serial cable
was connected to the Tristar and a computer. From the program provided by the supplier of the Tristar,
the group was able to display the voltage that the TriStar was detecting. This voltage was compared to
the voltage of the battery determined by means of a voltmeter. From this portion of testing, it was
verified that the TriStar was functioning properly.
Similarly, the SunSaver was tested by connecting the battery, fuse, SunSaver, and LED lights. When
connected, the SunSaver displayed that the battery was fully charged (LED is green) and the LED lights
were successfully lit. From this portion of testing, it was determined that the SunSaver was functioning
properly.
Figure 24-Charge Control Testing
51. 51
e. Complete Electrical Integration Testing
After confirming that all the components of the Electrical System were functioning properly, the entire
electric circuit was integrated into the Mechanical System. A multimeter was inserted between the
rectifier and the battery to measure how much current was being produced at varying RPMs. The
voltage was monitored by means of the RS-232 serial connection with the TriStar that was previously
mentioned. The voltage produced by a PMA closely matches the load that is attached to it (12V battery).
The voltage produced during testing fluctuated between 12.3V and 13.3V. This is favorable because in
order to charge a 12V battery, a voltage between 12.2V and 14V is desired. The following graphs display
the current and power produced at varying alternator speeds.
Figure 25-Complete System Testing
52. 52
Figure 26-Power v. RPM
Figure 27-Current v. RPM
Additionally, the TriStar LED display was monitored during testing to verify that, in fact, the battery was
charging. During two hours of testing, the LED display of the Tristar went from yellow and red (0-35%
battery capacitance) to yellow (35%-60% battery capacitance). This was proved to be realistic as the
alternator was producing 1 A on average. Over two hours this amounts to 2 AH or 17% capacitance of a
12 AH battery. It was assumed that the battery was closer to 35% battery capacitance than 0% battery
capacitance so an addition of 17% of the battery capacitance would easily allow the battery to be in the
35%-60% battery capacitance region.
53. 53
14. Design Revision and Optimization
i. Verification
Based on the initial prototype testing, the Current and Power v. Alternator RPM line graphs were
extended based on a linear regression to predict the power generation for the full scale Roundabout
Design. The linear regression predictions were extended to 125 RPM based on the calculation that a
comfortable speed to spin the Roundabout would be 15-30 RPM which corresponds to an alternator
RPM range of 62.5-125 RPM. The following graphs show the current and power generation for the full
scale Roundabout Design.
.
Figure 28-Full-Scale Current v. RPM
Figure 29-Full-Scale Power v. RPM
The power generated at 62.5 and 125 RPM is about 26 and 50 W. This is roughly 50% of the predicted
power generation and therefore it would take twice as long as expected to charge the battery. It was
54. 54
predicted that at 62.5 and 125 RPM the alternator would produce 32.5 and 98 W. This suggests that at
higher RPMs, the efficiency of the system is greatly reduced. This could be partly attributed to the
inefficiency of bike chains due to friction loss. It is typical in a powertrains for the system to be 85-93%
efficient. This means that if the Roundabout is transferring 100 W of energy to the bike chain, the bike
chain may consume 7-15% of that energy. The rest of the error between the predicted and actual model
could be attributed to analyzing the alternator specifications wrong. The specification graphs supplied
by the alternator supplier were based on an unspecified load size that could have varied from the 12V
12AH battery that was used in the prototype design. As previously discussed, a permanent magnet
alternator’s power generation is based on the load that is applied to it. Due to this variation, the power
generation could have been predicted incorrectly.
ii. Revision
After fabricating and testing the prototype, it was determined that charge controllers would also need
to incorporate into the full scale Roundabout design. It is important that the charging and discharging of
the 12V 55AH battery be monitored for the safety of the children at play and to maintain a good battery
life cycle. The same Tristar used in the prototype will be included in the full scale Roundabout Design as
it is rated for a 45 Amp current which well exceeds the predicted power generation. The SunSaver that
will be included in the prototype will have to be one generation higher than the one used in the
prototype. This SunSaver will be rated for 10 A rather than 6 A to comply with the current required for
the two LED lamps. Both the Tristar and the SunSaver will be stored in the electrical panel with the
battery and the boost converter.
iii. Optimization
Some options to improve the mechanical design would be to increase the diameter of the roundabout
and use a light metal, such as aluminum, to decrease the torque needed to spin the roundabout. Also,
the shaft should be properly lubricated so it can spin more smoothly. For the electrical system, a series
of supercapacitors could be used to increase the current being produced by the alternator. Additionally,
another alternator could be added to the gear train to increase the power production.
15. Prototype Refinement and Performance Testing
After testing the prototype with the two slap paddles, the team determined a need to extend the slap
paddles to increase the lever arm of the system design as it was difficult to spin the prototype fast.
Additionally, two more extended slap paddles were added to the system in order to more easily spin the
prototype. Since the alternator used in the prototype would also be used in the full-scale product, the
torque required to rotate the prototype was slightly too high. By increasing the length of the lever arm,
the force required to reach the same torque was decreased to a more suitable range. The group
extended the four slap paddles by one foot. The following graphs show the Current and Power v.
Alternator RPM line graphs. It can be seen that the maximum RPM increased by roughly 33 RPM
compared to the original slap paddles as a result of decreasing the force required to spin the prototype.
55. 55
Figure 30-Extended Paddle Current v. RPM
Figure 31-Extended Paddle Power v. RPM
Another refinement the team included in the alpha prototype was adding an inverter to allow for outlet
plugs to be utilized in the system. By adding the inverter, the prototype was able to represent how the
concept can do more than just power lights, but also be used for charging stations to power phones,
tablets, etc. Additionally, for the Innovation Expo, an RPM Display and Power Display were added to the
prototype to display the RPM the user was spinning the prototype as well as the alternator voltage,
current, and power production. A detailed description of the inverter, RPM Encoder, and Power Display
can be found in Appendix V Section D. The following Figure 32 is the final Prototype.
57. 57
16. Final Design Specification with BOM
Figure 33 Final Roundabout Design
Figure 33 shows the final Roundabout model. The
mechanical model itself has the same dimensions
and components as the initial design concept. The
final revisions in the design pertain to the electrical
components. The Tristar and Sunsaver Charge
Controller as well as the protective fuses have been
added to the final design. The following table
shows the final design BOM. The final part cost is
roughly $3,000.
Table 25-Full-Scale BOM
58. 58
Section – III: Northwest Resiliency Park Design and
Optimization
17. Site Layout
i. Property Overview
The property for the Northwest Resiliency Park is broken up into three separate lots totaling
approximately six acres. The first and largest lot, about 4 acres in size, is bounded by 12th, 13th, Adams,
and Madison Streets (Figure 34). The lot, herein referred to as “Lot 1,” will feature the ball fields, green
space, and underground detention system detailed below. This lot was previously divided in two by
Jefferson Street, but the portion of Jefferson Street between 12th and 13th Streets was removed at
some point and converted to property. Our second lot for planned development, herein referred to as
“Lot 2” is to the north, bounded by Adams, Jefferson, and 13th Streets; the lot only takes up a portion of
the block, with property to the north. This smaller property will be the site of a playground elevated on a
concrete structure with a rain garden at ground level. A third lot to the south exists, but as current city
plans involve the construction of a parking garage, it is out of the current scope for our proposal. From
topographic surveys of the area (Figure 35), a design ground elevation was determined of EL 6.
Figure 34 - Site Overview
Figure 35 - Topographic Survey, 13th & Adams
59. 59
ii. Lot 1, Ball Fields and Green Space
Lot 1 features a combination of ball fields and green space for use by the public. After conducting a
survey of the lot to determine size, enough space was available to lay out a soccer field with two
configurations on the eastern half of the lot with ample room for small bleachers, netting for loose balls,
and rest space for players. The first, more conventional configuration is an adult-size soccer field with a
north-south orientation. The second configuration is two youth-size soccer fields with an east-west
orientation. While this layout would present a challenge as permanent infrastructure could not be built
between the youth fields without obstructing the adult-size field, temporary bleachers could provide
rest and vigilant staff would serve the same purpose as a ball net. The second half of Lot 1 will feature a
Little League baseball field, complete with the requisite fencing and ball nets required for safety
reasons, and bleachers for parents to watch play. While there isn’t enough room for two baseball fields
on this half of the property without requiring adjustable configurations, the northwest corner of Lot 1
will feature green space and grassy seating areas.
For surface material, natural grass and artificial grass were considered for the ball fields, but ultimately
rubber turf was favored for its lower maintenance cost than real grass but relatively similar feel
compared to simple artificial grass. Artificial grass, however, was selected for the green space / lawn
area in the northwest corner of the property.
Figure 36 - Lot 1 Plan View
60. 60
iii. Lot 2, Playground and Rain Garden
Lot 2 will feature our combination playground / rain garden. The rain garden itself will be bounded by a
concrete parapet wall such that the public can observe the various flora and fauna within the rain
garden without having expressed access. Initial safety concerns were raised about a resident’s ability to
bypass safety measures and access the rain garden, but one solution proposed was a raising of the
parapet wall at the street level and introduction of glass panels so viewing would still be possible. At the
northern corners of Lot 2, access ramps grant access to the raised playground structure above the 100-
year flood elevation of EL7 in accordance with FEMA standards.
Figure 37 – Isometric Playground & Retaining Wall Structure View
61. 61
18. Stormwater Detention System
i. Detention System Layout
The primary component of the stormwater mitigation system at the Northwest Resiliency Park is the use
of an underground detention basin composed of large-diameter high density polyethylene pipes
connecting to the existing combined sewer. The system is constructed in two independents portions.
The eastern half of the Lot 1, below the soccer fields, will feature a grid approximately 360ft by 200ft of
36 inch outer diameter (30 inch inner diameter) pipes, with the shorter 200ft pipes spanning east-west
and the longer pipes spanning a north-south direction, linking the shorter pipes into a single grid. The
eastern grid will drain into the combined sewer at 13th and Adams. A grid of similar layout will be
installed below the western half of the Lot 1, but the grid will span 180ft and drain into the combined
sewer at 13th and Madison. Reasoning for the two separate basins comes down to two factors. First, the
portion of property through which Jefferson Street used to run was left out of the plan in case the street
were to ever reopen or any in use utility lines happen to run through the space. Second, a single basin
would have required too great an elevation change between the outlet (originally only 13th Adams) and
farthest point (12th and Madison). With two basins, the required elevation differential for either is
reduced as the distance between the outlet and farthest point is shortened. The storage capacities of
each system are detailed below, but through the use of two detention basins, the minimum goal of 1
million gallons is easily met.
Figure 38- Detention Basin Layout within Lot 1. West Basin on left, East Basin on right.
62. 62
Table 26 - Detention basin size and capacity summary.
Basin East Basin West Basin
Grid Size (ft x ft) 360 x 200 360 x 180
Total Pipe (LF) 16,920 15,300
Pipe Capacity (cf/ft)
**for 36” OD pipe, 2.5” wall
4.94 4.94
System Capacity (gal) 625,240 565,377
ii. Elevation Design
A full summary of elevations and layouts for the detention system are available in Appendices I and J,
but to summarize the design, a few assumptions were made given limited access to municipal resources.
First, an invert elevation of EL -1.125 was obtained from the North Hudson Sewerage Authority (NHSA)
for a manhole box just north of 13th and Adams. For the system to drain passively, it would have to be
entirely above the elevation. For a conservative design, the system was designed with an outlet
elevation of EL -0.50. Similar conditions were assumed at 13th and Madison for the line running along
Madison Street; efforts were made to confirm this elevation but to no avail pending response from
NHSA. In accordance with manufacturer recommendations, a minimum slope of 0.5% was used
throughout both basins. From the outlet, elevations were backed up using predetermined grid lengths
and a minimum slope.
Figure 39- Detention Basin Construction Profile
For construction, a similar process was used. Basing a construction profile off a similar project in
southwest Hoboken, a profile was recommended to include excavation to 6 inches below the pipe’s
bottom, fill of gravel to 6 inches above top of the pipe, a layer of filter fabric, and backfill to target
elevation. An initial installation plan sought to simply excavate the entire property out to the lowest
pipe elevation and vary gravel thickness with pipe elevation, but given the significant costs associated
with excavating contaminated soil, excavation was minimized through the proposed profile plan
detailed in Appendices I and J, in which excavation depth is varied and gravel layer held constant.
Through this construction plan and a rough elevation survey of the site, there is sufficient elevation
63. 63
differential between the existing combined sewer invert and the high elevation of construction to avoid
raising the profile of the site above existing grade and street level.
iii. Dewatering Plan
Due to the relatively high water table at the site, prior to construction of the detention system and
excavation, dewatering must draw the water table down enough to conduct safe operations. From prior
construction planning, the water table must be drawn down approximately 10 feet throughout the site.
Assuming a drawdown angle of 10% (meaning 10 vertical feet for every 100 horizontal feet) based on
basic soil conditions as provided by the United States Geological Survey, approximately four drawdown
wells located centrally in the below figure must be drilled 30ft down from current ground surface, and
water extraction operations performed on a regular basis to prevent the site from flooding out. With
more wells on a less central spacing, each wouldn’t have to be drilled as deep for a similar effect to be
achieved, but local regulations dictate dewatering operations are not allowed to reduce the water table
significantly beyond the boundaries of the existing lot. Given the proposed arrangement, water table
reduction is minimized beyond the property in question.
Figure 40 - Dewatering Plan View
64. 64
Figure 37- Dewatering Elevation View
iv. Runoff Capacity Analysis
This particular system will serve two purposes. First, it will be capable of capturing the runoff from the
100-year storm event on the property. Given a high water table at the site, a runoff analysis assumes all
precipitation on the site would flow into the detention basin. With a capacity of 1.1 million gallons and
runoff results shown below, this pair of basins will be more than sufficient to handle the 100-year runoff
event.
Table 27 - Runoff Analysis Results
Storm Type 100-year, 24-hour 50-year, 24-hour 25-year, 24-hour
Rainfall (in) 7.3 6.5 5.7
Runoff (in) 7.061 6.261 5.462
Runoff Volume (cf) 116,602 103,402 90,205
Runoff Volume (gal) 872,183 773,447 674,733
Second, and more uniquely, it will tie into the existing combined sewer system, providing excess
capacity and allowing the combined sewer to overflow into the basin before other outlets in nearby
streets, basements, and storm drains. Even in the event of a 100-year storm, the system will have
capacity to handle both runoff and stormwater overflow.
19. Elevated Playground Structure
i. Structural Overview and Loading
The elevated playground structure will be composed primarily of a reinforced integrated slab and beam
concrete deck, supported by reinforced concrete columns. Slabs are two-way reinforced and beams
include positive bending reinforcement. For the most part, beams tie directly into columns given a
relatively simple floor plan. In four cases, however, because columns would have been impractically
close together, beams tie in to other beams, making them effectively concrete girders. Loading for the
system included the dead weight of a 6 inch concrete deck and 100psf live load as required by ASCE 7-10
65. 65
for a gymnasium or elevated playspace. Factoring using LRFD results in a factored design load of 259
pounds per square foot.
ii. Beam and Column Types
Before evaluating the members for a system as designed in Revit structural modeling, design-type
members were developed. This served a couple chief purposes, first and foremost for each of
construction. Instead of developing a series of members custom-designed for each case, a couple
different options would ease the design process and make for quicker assembly. Based on rounded
measurements, three types of beam and two types of column were developed.
Beams
Type 1: 8 inch width, 2 #9 bars, Capacity = 160 k-ft
Type 2: 12 inch width, 4 #9 bars, Capacity = 307 k-ft
Type 3: 18 inch width, 6 #9 bars, Capacity = 460 k-ft
Columns
Type 1: 9in x 9in, 4 #5 bars, Capacity = 180 k
Type 2: 12in x 12in, 4 #9 bars, Capacity = 372 k
iii. Structural Analysis and Member Selection
Moving into structural analysis, span length and tributary width were determined for each beam using
Revit; because the structure is symmetrical in one axis, a design of half the beams and columns holds for
those on the other side of the plane of symmetry. Due to the nature of two-way span load distribution,
each beam faces a triangular load pattern with a peak near the center of the span equivalent to the
tributary width multiplied by the factored loading per square foot.
Figure 38- Slab Rebar Detail