May 2013 Monthly Multi-family Housing Activity Report – Boston Real Estate
•
0 likes•303 views

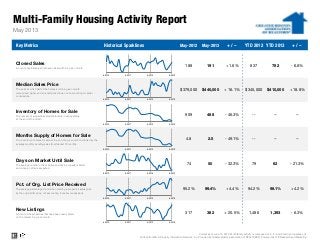
Here’s the Multi-Family Housing Activity Report, May 2013 from the Greater Boston Association of Realtors®. What’s this month’s bottom-line takeaway? Multifamily home prices are up +16% while their inventory is down -46.3% and months supply is down -49.1% over last year's month over month levels.

Recommended
Recommended
More Related Content
More from Unit Realty Group
More from Unit Realty Group (20)
Recently uploaded
Recently uploaded (20)
May 2013 Monthly Multi-family Housing Activity Report – Boston Real Estate
- 1. Multi-Family Housing Activity Report Key Metrics Historical Sparklines May-2012 May-2013 + / – YTD 2012 YTD 2013 + / – 782 - 6.6% Median Sales Price The point at which half of the homes sold in a given month were priced higher and one half priced lower, not accounting for seller concessions. $379,000 837 May 2013 Closed Sales A count of actual sales that have closed within a given month. 188 191 + 1.6% -- $440,000 + 16.1% $345,000 $410,000 + 18.8% -- -- --- 49.1% Inventory of Homes for Sale The number of properties available for sale in active status at the end of the month. 909 488 - 46.3% -- Days on Market Until Sale The average number of days between when a property is listed and when an offer is accepted. 74 50 - 32.3% 79 62 98.1% Current as of June 16, 2013. Multi-family activity is comprised of 2-, 3- and 4-family properties only. All data from MLS Property Information Network, Inc. Provided by Greater Boston Association of REALTORS®. Powered by 10K Research and Marketing. -- + 4.2% New Listings A count of the properties that have been newly listed on the market in a given month. 317 382 + 20.5% 1,486 1,393 - 6.3% - 21.3% Months Supply of Homes for Sale The inventory of homes for sale at the end of a given month, divided by the average monthly pending sales from the last 12 months. 4.8 2.5 Pct. of Org. List Price Received The average percentage found when dividing a property's sales price by the original list price, not accounting for seller concessions. 95.2% 99.4% + 4.4% 94.2% 5-2010 5-2011 5-2012 5-2013 5-2010 5-2011 5-2012 5-2013 5-2010 5-2011 5-2012 5-2013 5-2010 5-2011 5-2012 5-2013 5-2010 5-2011 5-2012 5-2013 5-2010 5-2011 5-2012 5-2013 5-2010 5-2011 5-2012 5-2013 5B5B
- 2. All data from MLS Property Information Network, Inc. Provided by Greater Boston Association of REALTORS®. Powered by 10K Research and Marketing. Multi-Family Housing Activity Report – 2-Family Properties 5-2012 5-2013 + / – 5-2012 5-2013 + / – 5-2012 5-2013 + / – 5-2012 5-2013 + / – Acton 0 0 -- $0 $0 -- 0 0 -- 0 3 -- Arlington 3 5 + 66.7% $445,000 $605,000 + 36.0% 40 47 + 17.5% 4 3 - 25.0% Ashland 0 1 -- $0 $307,000 -- 0 787 -- 2 1 - 50.0% Attleboro 1 2 + 100.0% $129,500 $179,500 + 38.6% 279 321 + 14.9% 20 10 - 50.0% Bedford 0 0 -- $0 $0 -- 0 0 -- 1 0 - 100.0% Bellingham 0 0 -- $0 $0 -- 0 0 -- 3 1 - 66.7% Belmont 3 2 - 33.3% $571,000 $699,000 + 22.4% 9 11 + 21.2% 4 2 - 50.0% Boston 32 34 + 6.3% $270,000 $427,500 + 58.3% 76 37 - 51.2% 135 70 - 48.1% Boxborough 0 0 -- $0 $0 -- 0 0 -- 0 0 -- Brookline 0 1 -- $0 $950,000 -- 0 5 -- 7 6 - 14.3% Burlington 0 0 -- $0 $0 -- 0 0 -- 0 0 -- Cambridge 6 4 - 33.3% $689,500 $1,142,500 + 65.7% 17 13 - 25.7% 9 8 - 11.1% Canton 0 1 -- $0 $245,000 -- 0 7 -- 0 3 -- Carlisle 0 0 -- $0 $0 -- 0 0 -- 1 0 - 100.0% Chelsea 3 3 0.0% $299,000 $320,000 + 7.0% 28 26 - 8.2% 16 7 - 56.3% Concord 0 1 -- $0 $626,000 -- 0 6 -- 6 5 - 16.7% Dedham 0 2 -- $0 $461,667 -- 0 160 -- 13 8 - 38.5% Dover 0 0 -- $0 $0 -- 0 0 -- 0 1 -- Everett 6 5 - 16.7% $270,250 $370,507 + 37.1% 48 11 - 77.3% 15 16 + 6.7% Foxborough 0 0 -- $0 $0 -- 0 0 -- 2 1 - 50.0% Framingham 3 1 - 66.7% $196,500 $325,000 + 65.4% 164 110 - 33.1% 12 5 - 58.3% Franklin 1 1 0.0% $250,000 $250,000 0.0% 244 19 - 92.2% 6 2 - 66.7% Holliston 0 0 -- $0 $0 -- 0 0 -- 1 1 0.0% Hopkinton 0 0 -- $0 $0 -- 0 0 -- 0 0 -- Hudson 0 1 -- $0 $288,000 -- 0 58 -- 7 6 - 14.3% Lexington 0 1 -- $0 $495,000 -- 0 52 -- 1 3 + 200.0% Lincoln 0 0 -- $0 $0 -- 0 0 -- 2 0 - 100.0% Malden 12 6 - 50.0% $341,000 $411,500 + 20.7% 82 85 + 3.6% 35 20 - 42.9% Mansfield 0 2 -- $0 $283,250 -- 0 52 -- 0 4 -- Marlborough 5 5 0.0% $175,000 $195,000 + 11.4% 55 17 - 68.6% 15 4 - 73.3% Maynard 1 0 - 100.0% $250,000 $0 - 100.0% 242 0 - 100.0% 4 5 + 25.0% Medfield 0 1 -- $0 $265,000 -- 0 197 -- 2 2 0.0% Medford 7 5 - 28.6% $390,000 $500,000 + 28.2% 31 17 - 46.9% 23 15 - 34.8% Medway 0 0 -- $0 $0 -- 0 0 -- 4 0 - 100.0% Milford 1 2 + 100.0% $161,000 $228,250 + 41.8% 25 53 + 112.0% 14 9 - 35.7% Millis 0 0 -- $0 $0 -- 0 0 -- 1 1 0.0% Milton 0 1 -- $0 $430,000 -- 0 80 -- 8 2 - 75.0% Natick 0 0 -- $0 $0 -- 0 0 -- 7 6 - 14.3% Needham 0 1 -- $0 $438,000 -- 0 5 -- 4 1 - 75.0% Newton 6 9 + 50.0% $648,000 $675,000 + 4.2% 47 12 - 74.2% 28 13 - 53.6% May 2013 InventoryClosed Sales Days on MarketMedian Sales Price
- 3. All data from MLS Property Information Network, Inc. Provided by Greater Boston Association of REALTORS®. Powered by 10K Research and Marketing. Multi-Family Housing Activity Report – 2-Family Properties (cont.) 5-2012 5-2013 + / – 5-2012 5-2013 + / – 5-2012 5-2013 + / – 5-2012 5-2013 + / – Norfolk 0 0 -- $0 $0 -- 0 0 -- 2 0 - 100.0% North Attleboro 0 2 -- $0 $262,750 -- 0 78 -- 9 6 - 33.3% Norwood 5 4 - 20.0% $290,000 $408,750 + 40.9% 27 15 - 47.1% 5 4 - 20.0% Plainville 0 0 -- $0 $0 -- 0 0 -- 3 0 - 100.0% Quincy 6 6 0.0% $390,000 $377,000 - 3.3% 23 21 - 7.9% 31 17 - 45.2% Revere 5 7 + 40.0% $280,000 $332,000 + 18.6% 114 51 - 55.8% 34 21 - 38.2% Saugus 0 0 -- $0 $0 -- 0 0 -- 7 2 - 71.4% Sharon 0 0 -- $0 $0 -- 0 0 -- 2 2 0.0% Sherborn 0 0 -- $0 $0 -- 0 0 -- 1 1 0.0% Somerville 10 9 - 10.0% $538,500 $685,000 + 27.2% 62 38 - 37.5% 35 15 - 57.1% Southborough 0 0 -- $0 $0 -- 0 0 -- 0 4 -- Stow 0 0 -- $0 $0 -- 0 0 -- 1 0 - 100.0% Sudbury 0 0 -- $0 $0 -- 0 0 -- 0 1 -- Walpole 0 2 -- $0 $359,950 -- 0 60 -- 3 4 + 33.3% Waltham 4 1 - 75.0% $390,825 $506,000 + 29.5% 53 43 - 18.5% 9 6 - 33.3% Watertown 5 7 + 40.0% $587,500 $550,000 - 6.4% 15 42 + 180.0% 11 3 - 72.7% Wayland 1 0 - 100.0% $562,500 $0 - 100.0% 101 0 - 100.0% 2 1 - 50.0% Wellesley 0 0 -- $0 $0 -- 0 0 -- 1 0 - 100.0% Weston 0 0 -- $0 $0 -- 0 0 -- 1 0 - 100.0% Westwood 0 0 -- $0 $0 -- 0 0 -- 0 1 -- Winchester 1 0 - 100.0% $525,000 $0 - 100.0% 14 0 - 100.0% 7 2 - 71.4% Winthrop 1 2 + 100.0% $360,000 $309,225 - 14.1% 249 41 - 83.7% 8 4 - 50.0% Woburn 2 2 0.0% $305,000 $422,500 + 38.5% 124 48 - 61.7% 5 3 - 40.0% Wrentham 1 0 - 100.0% $85,000 $0 - 100.0% 476 0 - 100.0% 1 1 0.0% Greater Boston 131 139 +6.1% $360,000 $434,000 +20.6% 68 48 -29.8% 589 337 -42.8% Note: The "Greater Boston" figures are not a compilation or total of the individual areas. Days on Market Inventory May 2013 Closed Sales Median Sales Price
- 4. All data from MLS Property Information Network, Inc. Provided by Greater Boston Association of REALTORS®. Powered by 10K Research and Marketing. Multi-Family Housing Activity Report – 3-Family Properties 5-2012 5-2013 + / – 5-2012 5-2013 + / – 5-2012 5-2013 + / – 5-2012 5-2013 + / – Acton 0 0 -- $0 $0 -- 0 0 -- 0 0 -- Arlington 0 0 -- $0 $0 -- 0 0 -- 1 1 0.0% Ashland 0 1 -- $0 $161,000 -- 0 253 -- 5 2 - 60.0% Attleboro 2 0 - 100.0% $97,200 $0 - 100.0% 73 0 - 100.0% 10 4 - 60.0% Bedford 0 0 -- $0 $0 -- 0 0 -- 0 1 -- Bellingham 0 0 -- $0 $0 -- 0 0 -- 0 1 -- Belmont 0 0 -- $0 $0 -- 0 0 -- 0 0 -- Boston 27 24 - 11.1% $399,950 $473,000 + 18.3% 85 49 - 41.9% 137 56 - 59.1% Boxborough 0 0 -- $0 $0 -- 0 0 -- 0 0 -- Brookline 1 0 - 100.0% $980,000 $0 - 100.0% 8 0 - 100.0% 3 2 - 33.3% Burlington 0 0 -- $0 $0 -- 0 0 -- 1 0 - 100.0% Cambridge 0 1 -- $0 $1,000,000 -- 0 7 -- 6 5 - 16.7% Canton 0 0 -- $0 $0 -- 0 0 -- 0 1 -- Carlisle 0 0 -- $0 $0 -- 0 0 -- 0 0 -- Chelsea 1 1 0.0% $300,000 $399,900 + 33.3% 95 9 - 90.5% 11 4 - 63.6% Concord 0 0 -- $0 $0 -- 0 0 -- 0 0 -- Dedham 1 0 - 100.0% $334,900 $0 - 100.0% 14 0 - 100.0% 0 0 -- Dover 0 0 -- $0 $0 -- 0 0 -- 0 0 -- Everett 2 6 + 200.0% $374,500 $393,000 + 4.9% 57 132 + 133.6% 17 10 - 41.2% Foxborough 0 0 -- $0 $0 -- 0 0 -- 0 0 -- Framingham 1 0 - 100.0% $345,000 $0 - 100.0% 21 0 - 100.0% 5 1 - 80.0% Franklin 0 0 -- $0 $0 -- 0 0 -- 3 0 - 100.0% Holliston 0 0 -- $0 $0 -- 0 0 -- 1 1 0.0% Hopkinton 0 0 -- $0 $0 -- 0 0 -- 1 0 - 100.0% Hudson 0 1 -- $0 $265,000 -- 0 284 -- 3 3 0.0% Lexington 0 0 -- $0 $0 -- 0 0 -- 0 1 -- Lincoln 0 0 -- $0 $0 -- 0 0 -- 0 0 -- Malden 0 1 -- $0 $535,000 -- 0 41 -- 8 6 - 25.0% Mansfield 0 0 -- $0 $0 -- 0 0 -- 1 1 0.0% Marlborough 1 1 0.0% $289,000 $131,000 - 54.7% 22 35 + 59.1% 4 2 - 50.0% Maynard 0 0 -- $0 $0 -- 0 0 -- 0 0 -- Medfield 0 0 -- $0 $0 -- 0 0 -- 0 0 -- Medford 2 1 - 50.0% $573,750 $760,000 + 32.5% 353 6 - 98.3% 4 0 - 100.0% Medway 0 0 -- $0 $0 -- 0 0 -- 0 0 -- Milford 1 0 - 100.0% $138,000 $0 - 100.0% 295 0 - 100.0% 1 3 + 200.0% Millis 0 0 -- $0 $0 -- 0 0 -- 0 0 -- Milton 1 0 - 100.0% $345,000 $0 - 100.0% 290 0 - 100.0% 1 1 0.0% Natick 0 0 -- $0 $0 -- 0 0 -- 1 1 0.0% Needham 0 0 -- $0 $0 -- 0 0 -- 2 0 - 100.0% Newton 1 0 - 100.0% $1,275,000 $0 - 100.0% 91 0 - 100.0% 2 1 - 50.0% May 2013 Closed Sales Median Sales Price Days on Market Inventory
- 5. All data from MLS Property Information Network, Inc. Provided by Greater Boston Association of REALTORS®. Powered by 10K Research and Marketing. Multi-Family Housing Activity Report – 3-Family Properties (cont.) 5-2012 5-2013 + / – 5-2012 5-2013 + / – 5-2012 5-2013 + / – 5-2012 5-2013 + / – Norfolk 0 0 -- $0 $0 -- 0 0 -- 0 0 -- North Attleboro 0 1 -- $0 $312,000 -- 0 19 -- 7 3 -57.1% Norwood 0 0 -- $0 $0 -- 0 0 -- 1 1 0.0% Plainville 0 0 -- $0 $0 -- 0 0 -- 1 1 0.0% Quincy 1 0 -100.0% $439,000 $0 -100.0% 12 0 -100.0% 4 2 -50.0% Revere 1 0 -100.0% $349,900 $0 -100.0% 40 0 -100.0% 7 4 -42.9% Saugus 0 0 -- $0 $0 -- 0 0 -- 1 0 -100.0% Sharon 0 0 -- $0 $0 -- 0 0 -- 0 0 -- Sherborn 0 0 -- $0 $0 -- 0 0 -- 0 0 -- Somerville 3 4 +33.3% $465,000 $787,500 +69.4% 22 23 +6.2% 15 4 -73.3% Southborough 0 0 -- $0 $0 -- 0 0 -- 0 0 -- Stow 0 0 -- $0 $0 -- 0 0 -- 0 0 -- Sudbury 0 0 -- $0 $0 -- 0 0 -- 0 0 -- Walpole 0 0 -- $0 $0 -- 0 0 -- 0 1 -- Waltham 1 1 0.0% $460,000 $630,000 +37.0% 104 23 -77.9% 0 1 -- Watertown 0 2 -- $0 $689,000 -- 0 15 -- 1 2 +100.0% Wayland 0 0 -- $0 $0 -- 0 0 -- 0 0 -- Wellesley 0 0 -- $0 $0 -- 0 0 -- 0 1 -- Weston 0 0 -- $0 $0 -- 0 0 -- 0 0 -- Westwood 0 0 -- $0 $0 -- 0 0 -- 0 0 -- Winchester 0 0 -- $0 $0 -- 0 0 -- 0 0 -- Winthrop 1 0 -100.0% $408,500 $0 -100.0% 2 0 -100.0% 1 1 0.0% Woburn 0 0 -- $0 $0 -- 0 0 -- 2 0 -100.0% Wrentham 0 0 -- $0 $0 -- 0 0 -- 1 1 0.0% Greater Boston 48 45 -6.3% $397,675 $485,000 +22.0% 90 62 -31.4% 266 127 -52.3% Note: The "Greater Boston" figures are not a compilation or total of the individual areas. Closed Sales Median Sales Price Days on Market Inventory May 2013
- 6. All data from MLS Property Information Network, Inc. Provided by Greater Boston Association of REALTORS®. Powered by 10K Research and Marketing. Multi-Family Housing Activity Report – 4-Family Properties 5-2012 5-2013 + / – 5-2012 5-2013 + / – 5-2012 5-2013 + / – 5-2012 5-2013 + / – Acton 0 0 -- $0 $0 -- 0 0 -- 0 0 -- Arlington 1 0 - 100.0% $629,000 $0 - 100.0% 4 0 - 100.0% 0 0 -- Ashland 0 0 -- $0 $0 -- 0 0 -- 0 0 -- Attleboro 0 0 -- $0 $0 -- 0 0 -- 3 2 - 33.3% Bedford 0 0 -- $0 $0 -- 0 0 -- 0 0 -- Bellingham 0 0 -- $0 $0 -- 0 0 -- 0 0 -- Belmont 0 0 -- $0 $0 -- 0 0 -- 0 0 -- Boston 4 3 - 25.0% $1,185,500 $1,581,000 + 33.4% 76 13 - 82.4% 14 4 - 71.4% Boxborough 0 0 -- $0 $0 -- 0 0 -- 0 0 -- Brookline 0 0 -- $0 $0 -- 0 0 -- 0 0 -- Burlington 0 0 -- $0 $0 -- 0 0 -- 0 0 -- Cambridge 0 2 -- $0 $810,000 -- 0 16 -- 3 1 - 66.7% Canton 0 0 -- $0 $0 -- 0 0 -- 0 0 -- Carlisle 0 0 -- $0 $0 -- 0 0 -- 0 0 -- Chelsea 0 0 -- $0 $0 -- 0 0 -- 1 1 0.0% Concord 0 0 -- $0 $0 -- 0 0 -- 0 0 -- Dedham 0 0 -- $0 $0 -- 0 0 -- 0 0 -- Dover 0 0 -- $0 $0 -- 0 0 -- 0 0 -- Everett 0 0 -- $0 $0 -- 0 0 -- 1 1 0.0% Foxborough 0 0 -- $0 $0 -- 0 0 -- 0 0 -- Framingham 0 1 -- $0 $105,000 -- 0 9 -- 3 0 - 100.0% Franklin 0 0 -- $0 $0 -- 0 0 -- 0 1 -- Holliston 0 0 -- $0 $0 -- 0 0 -- 3 3 0.0% Hopkinton 0 0 -- $0 $0 -- 0 0 -- 0 1 -- Hudson 0 0 -- $0 $0 -- 0 0 -- 0 0 -- Lexington 0 0 -- $0 $0 -- 0 0 -- 0 0 -- Lincoln 0 0 -- $0 $0 -- 0 0 -- 1 0 - 100.0% Malden 0 0 -- $0 $0 -- 0 0 -- 0 0 -- Mansfield 0 0 -- $0 $0 -- 0 0 -- 0 2 -- Marlborough 1 0 - 100.0% $210,000 $0 - 100.0% 5 0 - 100.0% 4 2 - 50.0% Maynard 0 0 -- $0 $0 -- 0 0 -- 0 0 -- Medfield 0 0 -- $0 $0 -- 0 0 -- 0 1 -- Medford 1 0 - 100.0% $650,000 $0 - 100.0% 207 0 - 100.0% 1 0 - 100.0% Medway 0 0 -- $0 $0 -- 0 0 -- 0 0 -- Milford 0 0 -- $0 $0 -- 0 0 -- 2 1 - 50.0% Millis 0 0 -- $0 $0 -- 0 0 -- 0 0 -- Milton 0 0 -- $0 $0 -- 0 0 -- 0 0 -- Natick 0 0 -- $0 $0 -- 0 0 -- 0 0 -- Needham 0 0 -- $0 $0 -- 0 0 -- 0 0 -- Newton 1 0 - 100.0% $635,000 $0 - 100.0% 58 0 - 100.0% 2 1 - 50.0% May 2013 Closed Sales Median Sales Price Days on Market Inventory
- 7. All data from MLS Property Information Network, Inc. Provided by Greater Boston Association of REALTORS®. Powered by 10K Research and Marketing. Multi-Family Housing Activity Report – 4-Family Properties (cont.) 5-2012 5-2013 + / – 5-2012 5-2013 + / – 5-2012 5-2013 + / – 5-2012 5-2013 + / – Norfolk 0 0 -- $0 $0 -- 0 0 -- 0 1 -- North Attleboro 0 0 -- $0 $0 -- 0 0 -- 1 4 +300.0% Norwood 1 0 -100.0% $389,000 $0 -100.0% 34 0 -100.0% 0 0 -- Plainville 0 0 -- $0 $0 -- 0 0 -- 2 1 -50.0% Quincy 0 0 -- $0 $0 -- 0 0 -- 8 3 -62.5% Revere 0 0 -- $0 $0 -- 0 0 -- 1 1 0.0% Saugus 0 0 -- $0 $0 -- 0 0 -- 0 0 -- Sharon 0 0 -- $0 $0 -- 0 0 -- 0 0 -- Sherborn 0 0 -- $0 $0 -- 0 0 -- 0 0 -- Somerville 0 0 -- $0 $0 -- 0 0 -- 2 1 -50.0% Southborough 0 0 -- $0 $0 -- 0 0 -- 0 0 -- Stow 0 0 -- $0 $0 -- 0 0 -- 0 0 -- Sudbury 0 0 -- $0 $0 -- 0 0 -- 0 0 -- Walpole 0 0 -- $0 $0 -- 0 0 -- 0 0 -- Waltham 0 0 -- $0 $0 -- 0 0 -- 2 1 -50.0% Watertown 0 1 -- $0 $805,000 -- 0 13 -- 0 1 -- Wayland 0 0 -- $0 $0 -- 0 0 -- 0 0 -- Wellesley 0 0 -- $0 $0 -- 0 0 -- 0 0 -- Weston 0 0 -- $0 $0 -- 0 0 -- 0 0 -- Westwood 0 0 -- $0 $0 -- 0 0 -- 0 0 -- Winchester 0 0 -- $0 $0 -- 0 0 -- 0 0 -- Winthrop 0 0 -- $0 $0 -- 0 0 -- 0 0 -- Woburn 0 0 -- $0 $0 -- 0 0 -- 1 0 -100.0% Wrentham 0 0 -- $0 $0 -- 0 0 -- 0 0 -- Greater Boston 9 7 -22.2% $635,000 $805,000 +26.8% 68 13 -80.2% 54 24 -55.6% Note: The "Greater Boston" figures are not a compilation or total of the individual areas. Closed Sales Median Sales Price Days on Market Inventory May 2013