July 2014 Multi-family Housing Activity Report – Boston, MA Real Estate
•
2 likes•334 views

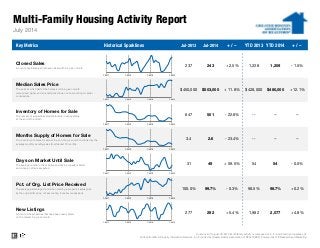
Here’s July 2014′s Monthly Multi-family Housing Activity Report from the Greater Boston Association of Realtors®. (Comparing July 2013 to July 2014) • Closed sales were up +2.5% • Median prices were up +11.8% • Inventory of Homes for Sale were down -22.6% • Months Supply of Home for Sale were down -23.4% • Days on market until sale were up +59.5% • Percentage of original list price received were down -0.3% • New Listings were up +5.4%

Recommended
Recommended
More Related Content
More from Unit Realty Group
More from Unit Realty Group (20)
Recently uploaded
Recently uploaded (20)
July 2014 Multi-family Housing Activity Report – Boston, MA Real Estate
- 1. Multi-Family Housing Activity Report Key Metrics Historical Sparklines Jul-2013 Jul-2014 + / – YTD 2013 YTD 2014 + / – 1,209 - 1.5% Median Sales Price The point at which half of the homes sold in a given month were priced higher and one half priced lower, not accounting for seller concessions. $450,000 1,228 July 2014 Closed Sales A count of actual sales that have closed within a given month. 237 243 + 2.5% -- $503,000 + 11.8% $428,000 $480,000 + 12.1% -- -- --- 23.4% Inventory of Homes for Sale The number of properties available for sale in active status at the end of the month. 647 501 - 22.6% -- Days on Market Until Sale The average number of days between when a property is listed and when an offer is accepted. 31 49 + 59.5% 54 54 98.7% Current as of August 18, 2014. Multi-family activity is comprised of 2-, 3- and 4-family properties only. All data from MLS Property Information Network, Inc. Provided by Greater Boston Association of REALTORS®. Powered by 10K Research and Marketing. -- + 0.2% New Listings A count of the properties that have been newly listed on the market in a given month. 277 292 + 5.4% 1,982 2,077 + 4.8% - 0.5% Months Supply of Homes for Sale The inventory of homes for sale at the end of a given month, divided by the average monthly pending sales from the last 12 months. 3.4 2.6 Pct. of Org. List Price Received The average percentage found when dividing a property's sales price by the original list price, not accounting for seller concessions. 100.0% 99.7% - 0.3% 98.5% 7-2011 7-2012 7-2013 7-2014 7-2011 7-2012 7-2013 7-2014 7-2011 7-2012 7-2013 7-2014 7-2011 7-2012 7-2013 7-2014 7-2011 7-2012 7-2013 7-2014 7-2011 7-2012 7-2013 7-2014 7-2011 7-2012 7-2013 7-2014 5B5B4B
- 2. All data from MLS Property Information Network, Inc. Provided by Greater Boston Association of REALTORS®. Powered by 10K Research and Marketing. Multi-Family Housing Activity Report – 2-Family Properties 7-2013 7-2014 + / – 7-2013 7-2014 + / – 7-2013 7-2014 + / – 7-2013 7-2014 + / – Acton 0 0 -- $0 $0 -- 0 0 -- 1 1 0.0% Arlington 10 1 - 90.0% $611,000 $580,000 - 5.1% 14 55 + 281.9% 2 3 + 50.0% Ashland 0 0 -- $0 $0 -- 0 0 -- 0 2 -- Attleboro 2 3 + 50.0% $201,250 $269,000 + 33.7% 71 46 - 35.7% 15 17 + 13.3% Bedford 0 0 -- $0 $0 -- 0 0 -- 0 2 -- Bellingham 1 0 - 100.0% $170,000 $0 - 100.0% 295 0 - 100.0% 2 2 0.0% Belmont 1 7 + 600.0% $710,000 $700,000 - 1.4% 5 28 + 462.9% 6 1 - 83.3% Boston 37 34 - 8.1% $455,000 $538,750 + 18.4% 26 58 + 127.2% 93 71 - 23.7% Boxborough 0 0 -- $0 $0 -- 0 0 -- 0 0 -- Brookline 3 1 - 66.7% $1,407,000 $1,450,000 + 3.1% 5 27 + 440.0% 9 0 - 100.0% Burlington 0 0 -- $0 $0 -- 0 0 -- 0 0 -- Cambridge 3 6 + 100.0% $1,030,000 $871,000 - 15.4% 6 15 + 136.8% 10 7 - 30.0% Canton 0 0 -- $0 $0 -- 0 0 -- 3 6 + 100.0% Carlisle 0 0 -- $0 $0 -- 0 0 -- 0 0 -- Chelsea 4 2 - 50.0% $365,000 $290,000 - 20.5% 19 122 + 531.2% 13 6 - 53.8% Concord 0 0 -- $0 $0 -- 0 0 -- 3 2 - 33.3% Dedham 3 2 - 33.3% $395,000 $490,500 + 24.2% 14 57 + 313.4% 6 3 - 50.0% Dover 0 0 -- $0 $0 -- 0 0 -- 0 0 -- Everett 8 11 + 37.5% $372,800 $395,000 + 6.0% 41 65 + 56.9% 29 15 - 48.3% Foxborough 0 1 -- $0 $386,000 -- 0 26 -- 1 2 + 100.0% Framingham 2 3 + 50.0% $276,000 $310,000 + 12.3% 6 46 + 736.4% 7 4 - 42.9% Franklin 2 2 0.0% $212,500 $279,000 + 31.3% 25 3 - 87.8% 3 2 - 33.3% Holliston 0 0 -- $0 $0 -- 0 0 -- 1 0 - 100.0% Hopkinton 0 0 -- $0 $0 -- 0 0 -- 1 0 - 100.0% Hudson 0 0 -- $0 $0 -- 0 0 -- 6 3 - 50.0% Lexington 0 0 -- $0 $0 -- 0 0 -- 2 1 - 50.0% Lincoln 0 0 -- $0 $0 -- 0 0 -- 0 0 -- Malden 11 19 + 72.7% $387,000 $459,000 + 18.6% 13 49 + 289.7% 18 23 + 27.8% Mansfield 0 1 -- $0 $256,000 -- 0 17 -- 3 2 - 33.3% Marlborough 4 1 - 75.0% $204,450 $208,000 + 1.7% 51 30 - 41.2% 5 5 0.0% Maynard 0 0 -- $0 $0 -- 0 0 -- 5 1 - 80.0% Medfield 0 1 -- $0 $377,500 -- 0 134 -- 0 0 -- Medford 11 18 + 63.6% $525,000 $565,500 + 7.7% 8 36 + 354.5% 13 8 - 38.5% Medway 0 0 -- $0 $0 -- 0 0 -- 0 2 -- Milford 0 2 -- $0 $215,750 -- 0 95 -- 9 3 - 66.7% Millis 0 0 -- $0 $0 -- 0 0 -- 1 0 - 100.0% Milton 1 3 + 200.0% $410,000 $375,000 - 8.5% 93 18 - 80.3% 4 6 + 50.0% Natick 2 2 0.0% $396,250 $425,000 + 7.3% 12 9 - 25.0% 4 3 - 25.0% Needham 1 0 - 100.0% $335,000 $0 - 100.0% 85 0 - 100.0% 2 2 0.0% Newton 7 8 + 14.3% $675,000 $890,000 + 31.9% 22 64 + 185.4% 14 12 - 14.3% July 2014 InventoryClosed Sales Days on MarketMedian Sales Price
- 3. All data from MLS Property Information Network, Inc. Provided by Greater Boston Association of REALTORS®. Powered by 10K Research and Marketing. Multi-Family Housing Activity Report – 2-Family Properties (cont.) 7-2013 7-2014 + / – 7-2013 7-2014 + / – 7-2013 7-2014 + / – 7-2013 7-2014 + / – Norfolk 0 1 -- $0 $320,000 -- 0 105 -- 1 1 0.0% North Attleboro 0 0 -- $0 $0 -- 0 0 -- 7 5 - 28.6% Norwood 2 0 - 100.0% $358,000 $0 - 100.0% 14 0 - 100.0% 7 2 - 71.4% Plainville 0 0 -- $0 $0 -- 0 0 -- 0 5 -- Quincy 9 11 + 22.2% $445,000 $503,000 + 13.0% 23 56 + 146.3% 21 15 - 28.6% Revere 12 9 - 25.0% $382,500 $388,500 + 1.6% 20 52 + 155.7% 22 22 0.0% Saugus 1 2 + 100.0% $305,000 $432,500 + 41.8% 41 121 + 195.1% 7 3 - 57.1% Sharon 0 0 -- $0 $0 -- 0 0 -- 3 1 - 66.7% Sherborn 0 0 -- $0 $0 -- 0 0 -- 0 0 -- Somerville 16 10 - 37.5% $723,500 $678,000 - 6.3% 55 54 - 2.1% 20 14 - 30.0% Southborough 0 0 -- $0 $0 -- 0 0 -- 2 4 + 100.0% Stow 0 0 -- $0 $0 -- 0 0 -- 0 1 -- Sudbury 1 0 - 100.0% $490,000 $0 - 100.0% 278 0 - 100.0% 0 0 -- Walpole 0 1 -- $0 $335,000 -- 0 8 -- 2 2 0.0% Waltham 5 5 0.0% $474,166 $455,000 - 4.0% 37 35 - 7.5% 4 8 + 100.0% Watertown 8 7 - 12.5% $568,250 $685,000 + 20.5% 16 27 + 66.6% 10 9 - 10.0% Wayland 0 0 -- $0 $0 -- 0 0 -- 1 0 - 100.0% Wellesley 1 0 - 100.0% $585,000 $0 - 100.0% 16 0 - 100.0% 0 0 -- Weston 0 0 -- $0 $0 -- 0 0 -- 0 0 -- Westwood 0 0 -- $0 $0 -- 0 0 -- 1 0 - 100.0% Winchester 1 0 - 100.0% $585,000 $0 - 100.0% 7 0 - 100.0% 2 3 + 50.0% Winthrop 1 1 0.0% $282,500 $565,000 + 100.0% 39 61 + 56.4% 7 8 + 14.3% Woburn 3 3 0.0% $418,000 $446,500 + 6.8% 5 114 + 2043.8% 7 6 - 14.3% Wrentham 0 0 -- $0 $0 -- 0 0 -- 1 0 - 100.0% Greater Boston 173 178 +2.9% $455,000 $481,500 +5.8% 28 50 +77.3% 416 326 -21.6% Note: The "Greater Boston" figures are not a compilation or total of the individual areas. Days on Market Inventory July 2014 Closed Sales Median Sales Price
- 4. All data from MLS Property Information Network, Inc. Provided by Greater Boston Association of REALTORS®. Powered by 10K Research and Marketing. Multi-Family Housing Activity Report – 3-Family Properties 7-2013 7-2014 + / – 7-2013 7-2014 + / – 7-2013 7-2014 + / – 7-2013 7-2014 + / – Acton 0 0 -- $0 $0 -- 0 0 -- 0 0 -- Arlington 0 1 -- $0 $790,000 -- 0 25 -- 0 1 -- Ashland 0 0 -- $0 $0 -- 0 0 -- 0 2 -- Attleboro 1 1 0.0% $230,000 $165,000 - 28.3% 14 41 + 192.9% 6 6 0.0% Bedford 0 0 -- $0 $0 -- 0 0 -- 0 0 -- Bellingham 0 1 -- $0 $232,000 -- 0 25 -- 1 1 0.0% Belmont 0 2 -- $0 $953,750 -- 0 3 -- 0 0 -- Boston 29 29 0.0% $440,000 $515,000 + 17.0% 25 45 + 78.7% 96 63 - 34.4% Boxborough 0 0 -- $0 $0 -- 0 0 -- 0 0 -- Brookline 0 2 -- $0 $2,062,500 -- 0 7 -- 4 0 - 100.0% Burlington 0 0 -- $0 $0 -- 0 0 -- 0 0 -- Cambridge 3 0 - 100.0% $1,260,000 $0 - 100.0% 22 0 - 100.0% 7 6 - 14.3% Canton 0 0 -- $0 $0 -- 0 0 -- 1 1 0.0% Carlisle 0 0 -- $0 $0 -- 0 0 -- 0 0 -- Chelsea 7 2 - 71.4% $285,000 $460,000 + 61.4% 48 16 - 67.4% 9 8 - 11.1% Concord 0 0 -- $0 $0 -- 0 0 -- 0 0 -- Dedham 0 0 -- $0 $0 -- 0 0 -- 0 1 -- Dover 0 0 -- $0 $0 -- 0 0 -- 0 0 -- Everett 4 1 - 75.0% $412,750 $508,620 + 23.2% 18 95 + 427.8% 12 4 - 66.7% Foxborough 0 0 -- $0 $0 -- 0 0 -- 0 1 -- Framingham 0 0 -- $0 $0 -- 0 0 -- 3 1 - 66.7% Franklin 0 1 -- $0 $342,500 -- 0 50 -- 0 1 -- Holliston 0 0 -- $0 $0 -- 0 0 -- 1 0 - 100.0% Hopkinton 0 0 -- $0 $0 -- 0 0 -- 1 0 - 100.0% Hudson 0 0 -- $0 $0 -- 0 0 -- 2 2 0.0% Lexington 0 0 -- $0 $0 -- 0 0 -- 1 0 - 100.0% Lincoln 0 0 -- $0 $0 -- 0 0 -- 0 0 -- Malden 3 4 + 33.3% $440,000 $487,500 + 10.8% 32 34 + 6.6% 6 9 + 50.0% Mansfield 0 1 -- $0 $388,000 -- 0 79 -- 1 0 - 100.0% Marlborough 2 0 - 100.0% $202,400 $0 - 100.0% 5 0 - 100.0% 2 2 0.0% Maynard 0 0 -- $0 $0 -- 0 0 -- 2 0 - 100.0% Medfield 0 0 -- $0 $0 -- 0 0 -- 0 0 -- Medford 0 1 -- $0 $902,000 -- 0 278 -- 3 2 - 33.3% Medway 0 0 -- $0 $0 -- 0 0 -- 1 0 - 100.0% Milford 0 0 -- $0 $0 -- 0 0 -- 2 1 - 50.0% Millis 0 0 -- $0 $0 -- 0 0 -- 0 0 -- Milton 0 0 -- $0 $0 -- 0 0 -- 2 0 - 100.0% Natick 0 0 -- $0 $0 -- 0 0 -- 0 0 -- Needham 0 0 -- $0 $0 -- 0 0 -- 0 0 -- Newton 0 0 -- $0 $0 -- 0 0 -- 0 0 -- July 2014 Closed Sales Median Sales Price Days on Market Inventory
- 5. All data from MLS Property Information Network, Inc. Provided by Greater Boston Association of REALTORS®. Powered by 10K Research and Marketing. Multi-Family Housing Activity Report – 3-Family Properties (cont.) 7-2013 7-2014 + / – 7-2013 7-2014 + / – 7-2013 7-2014 + / – 7-2013 7-2014 + / – Norfolk 0 0 -- $0 $0 -- 0 0 -- 0 1 -- North Attleboro 1 0 -100.0% $305,000 $0 -100.0% 29 0 -100.0% 3 7 +133.3% Norwood 0 0 -- $0 $0 -- 0 0 -- 1 2 +100.0% Plainville 0 0 -- $0 $0 -- 0 0 -- 0 1 -- Quincy 1 3 +200.0% $525,000 $499,900 -4.8% 9 18 +103.7% 7 6 -14.3% Revere 1 0 -100.0% $402,000 $0 -100.0% 24 0 -100.0% 4 2 -50.0% Saugus 0 1 -- $0 $472,000 -- 0 132 -- 0 0 -- Sharon 0 0 -- $0 $0 -- 0 0 -- 0 0 -- Sherborn 0 0 -- $0 $0 -- 0 0 -- 0 0 -- Somerville 2 6 +200.0% $729,000 $820,000 +12.5% 2 57 +3666.7% 7 11 +57.1% Southborough 0 0 -- $0 $0 -- 0 0 -- 0 0 -- Stow 0 0 -- $0 $0 -- 0 0 -- 0 0 -- Sudbury 0 0 -- $0 $0 -- 0 0 -- 0 0 -- Walpole 0 0 -- $0 $0 -- 0 0 -- 1 0 -100.0% Waltham 1 0 -100.0% $484,900 $0 -100.0% 88 0 -100.0% 2 2 0.0% Watertown 0 0 -- $0 $0 -- 0 0 -- 1 2 +100.0% Wayland 0 0 -- $0 $0 -- 0 0 -- 0 0 -- Wellesley 0 0 -- $0 $0 -- 0 0 -- 0 0 -- Weston 0 0 -- $0 $0 -- 0 0 -- 0 0 -- Westwood 0 0 -- $0 $0 -- 0 0 -- 0 0 -- Winchester 0 0 -- $0 $0 -- 0 0 -- 0 0 -- Winthrop 0 1 -- $0 $415,000 -- 0 56 -- 2 2 0.0% Woburn 0 1 -- $0 $450,000 -- 0 14 -- 0 1 -- Wrentham 0 0 -- $0 $0 -- 0 0 -- 0 0 -- Greater Boston 55 58 +5.5% $425,000 $517,500 +21.8% 27 46 +72.5% 191 149 -22.0% Note: The "Greater Boston" figures are not a compilation or total of the individual areas. Closed Sales Median Sales Price Days on Market Inventory July 2014
- 6. All data from MLS Property Information Network, Inc. Provided by Greater Boston Association of REALTORS®. Powered by 10K Research and Marketing. Multi-Family Housing Activity Report – 4-Family Properties 7-2013 7-2014 + / – 7-2013 7-2014 + / – 7-2013 7-2014 + / – 7-2013 7-2014 + / – Acton 0 0 -- $0 $0 -- 0 0 -- 0 0 -- Arlington 0 0 -- $0 $0 -- 0 0 -- 0 0 -- Ashland 0 0 -- $0 $0 -- 0 0 -- 0 0 -- Attleboro 0 0 -- $0 $0 -- 0 0 -- 2 3 + 50.0% Bedford 0 0 -- $0 $0 -- 0 0 -- 0 0 -- Bellingham 0 0 -- $0 $0 -- 0 0 -- 0 0 -- Belmont 0 0 -- $0 $0 -- 0 0 -- 0 0 -- Boston 4 2 - 50.0% $985,000 $1,700,000 + 72.6% 61 18 - 71.1% 10 4 - 60.0% Boxborough 0 0 -- $0 $0 -- 0 0 -- 0 0 -- Brookline 0 0 -- $0 $0 -- 0 0 -- 0 1 -- Burlington 0 0 -- $0 $0 -- 0 0 -- 0 0 -- Cambridge 1 0 - 100.0% $1,800,000 $0 - 100.0% 41 0 - 100.0% 1 0 - 100.0% Canton 0 0 -- $0 $0 -- 0 0 -- 0 0 -- Carlisle 0 0 -- $0 $0 -- 0 0 -- 0 0 -- Chelsea 0 0 -- $0 $0 -- 0 0 -- 3 2 - 33.3% Concord 0 0 -- $0 $0 -- 0 0 -- 0 0 -- Dedham 0 0 -- $0 $0 -- 0 0 -- 0 0 -- Dover 0 0 -- $0 $0 -- 0 0 -- 0 0 -- Everett 0 0 -- $0 $0 -- 0 0 -- 3 1 - 66.7% Foxborough 0 0 -- $0 $0 -- 0 0 -- 0 0 -- Framingham 0 1 -- $0 $420,000 -- 0 7 -- 1 1 0.0% Franklin 0 1 -- $0 $425,500 -- 0 42 -- 1 0 - 100.0% Holliston 0 0 -- $0 $0 -- 0 0 -- 0 0 -- Hopkinton 0 0 -- $0 $0 -- 0 0 -- 0 0 -- Hudson 0 0 -- $0 $0 -- 0 0 -- 0 0 -- Lexington 0 0 -- $0 $0 -- 0 0 -- 0 0 -- Lincoln 0 0 -- $0 $0 -- 0 0 -- 0 0 -- Malden 0 1 -- $0 $550,000 -- 0 187 -- 0 1 -- Mansfield 0 0 -- $0 $0 -- 0 0 -- 1 0 - 100.0% Marlborough 0 1 -- $0 $300,500 -- 0 0 -- 0 0 -- Maynard 0 0 -- $0 $0 -- 0 0 -- 0 0 -- Medfield 0 0 -- $0 $0 -- 0 0 -- 1 0 - 100.0% Medford 0 1 -- $0 $550,000 -- 0 11 -- 0 1 -- Medway 0 0 -- $0 $0 -- 0 0 -- 0 0 -- Milford 0 0 -- $0 $0 -- 0 0 -- 1 2 + 100.0% Millis 0 0 -- $0 $0 -- 0 0 -- 0 0 -- Milton 0 0 -- $0 $0 -- 0 0 -- 0 0 -- Natick 0 0 -- $0 $0 -- 0 0 -- 0 0 -- Needham 0 0 -- $0 $0 -- 0 0 -- 0 0 -- Newton 0 0 -- $0 $0 -- 0 0 -- 1 0 - 100.0% July 2014 Closed Sales Median Sales Price Days on Market Inventory
- 7. All data from MLS Property Information Network, Inc. Provided by Greater Boston Association of REALTORS®. Powered by 10K Research and Marketing. Multi-Family Housing Activity Report – 4-Family Properties (cont.) 7-2013 7-2014 + / – 7-2013 7-2014 + / – 7-2013 7-2014 + / – 7-2013 7-2014 + / – Norfolk 0 0 -- $0 $0 -- 0 0 -- 1 0 -100.0% North Attleboro 0 0 -- $0 $0 -- 0 0 -- 4 1 -75.0% Norwood 0 0 -- $0 $0 -- 0 0 -- 1 0 -100.0% Plainville 1 0 -100.0% $320,000 $0 -100.0% 607 0 -100.0% 0 0 -- Quincy 1 0 -100.0% $556,000 $0 -100.0% 5 0 -100.0% 3 4 +33.3% Revere 1 0 -100.0% $355,000 $0 -100.0% 20 0 -100.0% 2 0 -100.0% Saugus 0 0 -- $0 $0 -- 0 0 -- 0 0 -- Sharon 0 0 -- $0 $0 -- 0 0 -- 0 0 -- Sherborn 0 0 -- $0 $0 -- 0 0 -- 0 0 -- Somerville 0 0 -- $0 $0 -- 0 0 -- 2 2 0.0% Southborough 0 0 -- $0 $0 -- 0 0 -- 0 0 -- Stow 0 0 -- $0 $0 -- 0 0 -- 0 0 -- Sudbury 0 0 -- $0 $0 -- 0 0 -- 0 0 -- Walpole 0 0 -- $0 $0 -- 0 0 -- 0 0 -- Waltham 1 0 -100.0% $675,000 $0 -100.0% 23 0 -100.0% 1 1 0.0% Watertown 0 0 -- $0 $0 -- 0 0 -- 1 0 -100.0% Wayland 0 0 -- $0 $0 -- 0 0 -- 0 0 -- Wellesley 0 0 -- $0 $0 -- 0 0 -- 0 0 -- Weston 0 0 -- $0 $0 -- 0 0 -- 0 0 -- Westwood 0 0 -- $0 $0 -- 0 0 -- 0 0 -- Winchester 0 0 -- $0 $0 -- 0 0 -- 0 0 -- Winthrop 0 0 -- $0 $0 -- 0 0 -- 0 2 -- Woburn 0 0 -- $0 $0 -- 0 0 -- 0 0 -- Wrentham 0 0 -- $0 $0 -- 0 0 -- 0 0 -- Greater Boston 9 7 -22.2% $675,000 $550,000 -18.5% 104 47 -54.9% 40 26 -35.0% Note: The "Greater Boston" figures are not a compilation or total of the individual areas. Closed Sales Median Sales Price Days on Market Inventory July 2014