Equinox Gold Corporate Presentation
•
0 likes•757 views

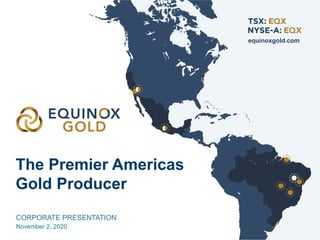
Equinox Gold is a Canadian mining company with seven operating gold mines, a multi-million-ounce gold reserve base and a clear path to achieve one million ounces of annual gold production from a pipeline of development and expansion projects. Equinox Gold operates entirely in the Americas, with two properties in the United States, one in Mexico and five in Brazil. Equinox Gold’s common shares are listed on the TSX and the NYSE American under the trading symbol EQX.

Recommended
More Related Content
What's hot
What's hot (20)
Similar to Equinox Gold Corporate Presentation
Similar to Equinox Gold Corporate Presentation (20)
More from Equinox Gold Corp.
More from Equinox Gold Corp. (20)
Recently uploaded
Recently uploaded (20)
Equinox Gold Corporate Presentation
- 1. The Premier Americas Gold Producer equinoxgold.com CORPORATE PRESENTATION November 2, 2020
- 2. 2 Cautionary Statements Forward-looking Statements This presentation contains certain forward-looking information and forward-looking statements within the meaning of applicable securities legislation and may include future-oriented financial information. Forward-looking statements and forward-looking information in this presentation relate to, among other things: the duration, extent and other implications of the novel coronavirus (COVID-19) and any related restrictions, regulations and suspensions with respect to the Company’s operations; the duration, extent and other implications of the community blockade at Los Filos; the strategic vision for the Company; expanding production capabilities and future financial or operational performance; Equinox Gold’s production and cost guidance; conversion of Mineral Resources to Mineral Reserves, and the Company’s ability to successfully advance its growth and development projects. Forward-looking statements or information generally identified by the use of the words “believe”, “will”, “advancing”, “strategy”, “plans”, “budget”, “anticipated”, “expected”, “estimated”, “target”, “objective” and similar expressions and phrases or statements that certain actions, events or results “may”, “could”, “should”, “will be taken” or “be achieved”, or the negative connotation of such terms, are intended to identify forward-looking statements and information. Although the Company believes that the expectations reflected in such forward-looking statements and information are reasonable, undue reliance should not be placed on forward-looking statements since the Company can give no assurance that such expectations will prove to be correct. The Company has based these forward-looking statements and information on the Company’s current expectations and projections about future events and these assumptions include: tonnage of ore to be mined and processed; ore grades and recoveries; prices for gold remaining as estimated; development at Los Filos, Castle Mountain, Santa Luz and Aurizona being completed and performed in accordance with current expectations; currency exchange rates remaining as estimated; availability of funds for the Company’s projects and future cash requirements; capital, decommissioning and reclamation estimates; the Company’s Mineral Reserve and Resource estimates and the assumptions on which they are based; prices for energy inputs, labour, materials, supplies and services; no labour-related disruptions and no unplanned delays or interruptions in scheduled development and production; that all necessary permits, licenses and regulatory approvals are received in a timely manner; and the Company’s ability to comply with environmental, health and safety laws. The Company's updated guidance included in this news release about its expectations for the remainder of 2020 is based on the Company’s current understanding of the pandemic and its impact on operations and may prove to be incorrect. While the Company considers these assumptions to be reasonable based on information currently available, they may prove to be incorrect. Accordingly, readers are cautioned not to put undue reliance on the forward-looking statements or information contained in this presentation. The Company cautions that forward-looking statements and information involve known and unknown risks, uncertainties and other factors that may cause actual results and developments to differ materially from those expressed or implied by such forward-looking statements and information contained in this and the Company has made assumptions and estimates based on or related to many of these factors. Such factors include, without limitation: fluctuations in gold prices; fluctuations in prices for energy inputs, labour, materials, supplies and services; fluctuations in currency markets; operational risks and hazards inherent with the business of mining (including environmental accidents and hazards, industrial accidents, equipment breakdown, unusual or unexpected geological or structural formations, cave-ins, flooding and severe weather); inadequate insurance, or inability to obtain insurance to cover these risks and hazards; employee relations; relationships with, and claims by, local communities and indigenous populations; the Company’s ability to obtain all necessary permits, licenses and regulatory approvals in a timely manner or at all; changes in laws, regulations and government practices, including environmental, export and import laws and regulations; legal restrictions relating to mining including those imposed in connection with COVID-19; risks relating to expropriation; increased competition in the mining industry; and those factors identified in the Company’s MD&A dated February 28, 2020 for the year-ended December 31, 2019 and its Annual Information Form dated May 13, 2020, which are available on SEDAR at www.sedar.com and on EDGAR at www.sec.gov/EDGAR. Forward-looking statements and information are designed to help readers understand management's views as of that time with respect to future events and speak only as of the date they are made. Except as required by applicable law, the Company assumes no obligation to update or to publicly announce the results of any change to any forward-looking statement or information contained or incorporated by reference to reflect actual results, future events or developments, changes in assumptions or changes in other factors affecting the forward-looking statements and information. If the Company updates any one or more forward- looking statements, no inference should be drawn that the Company will make additional updates with respect to those or other forward-looking statements. All forward-looking statements and information in this presentation are qualified in their entirety by this cautionary statement. Technical Information. The technical information in this document has been approved and verified by Doug Reddy, P.Geo., Equinox Gold’s COO; and Scott Heffernan, MSc, P.Geo., Equinox Gold’s EVP Exploration, who are the Qualified Persons under National Instrument 43- 101 for Equinox Gold. All technical information related to Equinox Gold’s properties and the Company’s mineral reserves and resources is available on Equinox Gold’s website at www.equinoxgold.com, on EDGAR at www.sec.gov and on SEDAR at www.sedar.com. Non-IFRS Measures. This document refers to mine cash costs/oz, all-in sustaining costs (“AISC”)/oz, adjusted EBITDA, adjusted net income, adjusted earnings per share, net debt and sustaining and expansion capital expenditures that are measures with no standardized meaning under International Financial Reporting Standards (“IFRS”) and may not be comparable to similar measures presented by other companies. Their measurement and presentation is intended to provide additional information and should not be considered in isolation or as a substitute for measures of performance prepared in accordance with IFRS. Non-IFRS measures are widely used in the mining industry as measurements of performance and the Company believes that they provide further transparency into costs associated with producing gold and will assist analysts, investors and other stakeholders of the Company in assessing its operating performance, its ability to generate free cash flow from current operations and its overall value. Refer to the “Non-IFRS measures” section of the Company’s Management’s Discussion and Analysis for the period ended June 30, 2020, for a more detailed discussion of these non-IFRS measures and their calculation. Combined AISC does not include corporate G&A. Cautionary Note to U.S. Investors Concerning Estimates of Reserves and Resources. These estimates have been prepared in accordance with the requirements of Canadian securities laws, which differ from the requirements of U.S. securities laws. The terms "mineral resource", "measured mineral resource", "indicated mineral resource" and "inferred mineral resource" are defined in NI 43-101 and recognized by Canadian securities laws but are not defined terms under the U.S. Securities and Exchange Commission ("SEC") Guide 7 ("SEC Guide 7") or recognized under U.S. securities laws. U.S. investors are cautioned not to assume that any part or all of mineral deposits in these categories will ever be upgraded to mineral reserves. While an “inferred mineral resource” has a great amount of uncertainty as to its existence and as to its economic and legal feasibility, it can be reasonably expected that the majority of “inferred mineral resources” could be upgraded to “indicated mineral resources” with continued exploration. Under Canadian securities laws, estimates of "inferred mineral resources" may not form the basis of feasibility or pre-feasibility studies. U.S. investors are cautioned not to assume that all or any part of an inferred mineral resource exists or is economically or legally mineable. In addition, the definitions of “proven mineral reserves” and “probable mineral reserves” under CIM standards differ in certain respects from the standards of the SEC. Accordingly, these mineral reserve and resource estimates and related information may not be comparable to similar information made public by U.S. companies subject to the reporting and disclosure requirements under the U.S. federal securities laws and the rules and regulations thereunder, including SEC Guide 7. Numbers may not add due to rounding. All dollar amounts in USD unless otherwise noted. 2
- 3. The Premier Americas Gold Producer ~500 Koz Gold Production in 20202 3 Growth Projects 7 Producing Mines 12.3 Moz P&P Gold Reserves 22.5 Moz M&I Gold Resources1 ~$1,000/oz All-in-Sustaining Costs in 20202 Fazenda 1 Moz Path to Gold Production >$500 M Total Liquidity To Fund Growth Los Filos / Expansion Aurizona RDM Santa Luz Pilar Castle Mountain Phase 1 & 2 Mesquite UNITED STATES MEXICO BRAZIL Gold Producing Assets Gold Development Site Fazenda 3 1. M&I Resources are inclusive of reserves. 2. Mid-point of updated 2020 production guidance of 470,000-530,000 oz of gold at AISC of $975-$1,025/oz. Guidance does not reflect the effect of potential future temporary mine suspensions, regulations and restrictions related to the COVID-19 pandemic, and the potential impact of the Los Filos blockade. The Company may revise guidance during the year to reflect changes to expected results, including from effects related to COVID-19.
- 4. 4 Peer-leading Growth per Share 0.2 2.1 2018 2020 E Production oz / 1000 shares 51.3 52.6 2018 2020 E Reserve oz / 1000 shares $8 $84 2018 2020 E Cash from Ops Before Changes in Working Capital ($M) $0.07 $0.35 2018 2020 E Cash Flow Per Share 5.7 12.7 2018 2020 E Mineral Reserves (Moz Gold) 26 500 2018 2020 E Gold Production (000 oz) + 1,850% + 125% + 660% + 795% + 3% + 250% Rapid growth through asset development and accretive M&A H1 2020 H1 2020
- 5. 1. Market cap calculated using average daily TSX C$ closing price for the month multiplied by average outstanding shares (basic basis) for the month. Trading value calculated by adding daily TSX and NYSE-A trading value and converting to C$. 5 Peer-leading Capital Markets Growth Nearly C$70 M recent daily trading liquidity 8% 0.5% 7% 49% 17% 18% Ross Beaty Other Insiders Corporate Institutional High Net Worth Retail/Other Capital Markets Growth Broadened Shareholder Base $10 $20 $30 $40 $50 $60 $70 $0 $1,000 $2,000 $3,000 $4,000 $5,000 Jan 20 Feb 20 Mar 20 Apr 20 May 20 Jun 20 Jul 20 Aug 20 Sep 20 Avg.DailyTradingValue(C$M)1 Avg.MarketCap(C$M)1 Avg. Market Cap Avg. Daily Trading Value
- 6. -25% -15% -5% 5% 15% 25% Equinox Regis Alamos Evolution Northern Star Eldorado OceanaGold St Barbara Centerra IAMGOLD Yamana Sibanye-Stillwater Pretium Saracen B2Gold SSR Mining Endeavour Mining Torex 0 200,000 400,000 600,000 800,000 1,000,000 1,200,000 AnnualGoldProduction(oz) Source: Street research, FactSet. Wood Mackenzie. 1. Consensus estimates on annual production collected from FactSet. 2. Guidance incorporates production from the Leagold assets after March 10, 2020, the closing date of the merger. Guidance does not reflect the effect of potential future temporary mine suspensions, regulations and restrictions related to the COVID-19 pandemic, and the potential impact of the Los Filos blockade. The Company may revise guidance during the year to reflect changes to expected results, including from effects related to COVID-19. 3. Analyst consensus estimates for production from growth projects. 4. Assuming existing assets are retained in the Company’s portfolio and continue to produce at current rates, and that development and expansion projects achieve production at the production rates and timelines envisioned at the date of this presentation. 6 Peer-leading Fully-funded Growth Pipeline Fully funded organic growth towards 1 Moz annual production Castle Mtn – Phase 1 Los Filos – Expansion Santa Luz – Restart Castle Mtn – Phase 2 2021E-2023E % Production Growth1 2018 EQX Production 2019 EQX Production 2020 Full-year Guidance2 + In-progress Growth Projects3 + Future Growth Projects3,4 Anticipated Production Growth from Current Assets Equinox Gold
- 7. Current Expansion 350,000+ oz/yr Production 3.2 Moz life-of-mine production2 1. Los Filos guidance was updated on August 10, 2020 to 90,000-110,000 oz of gold at AISC of $850-$950/oz to reflect that mining and development activities were suspended for the majority of Q2 2020 to comply with Mexican Federal restrictions related to COVID-19. Mining and development activities have been suspended again since September 3, 2020 as the result of a blockade. Guidance does not reflect the results of this suspension. 2. As estimated in Leagold’s March 2019 feasibility study, available on www.equinoxgold.com. 7 Los Filos: Expansion Project Underway • 4.5 Moz Reserves with upside • Open-pit and underground mining • Heap leach processing • Guidance reduced to ~100,000 oz in 2020 as a result of COVID-191 • Expansion project underway - Additional open-pit and underground mines - New upsized CIL plant - Potential to increase reserves ~180,000 oz/yr Avg. annual production
- 8. 1. Guidance does not reflect the effect of potential future temporary mine suspensions and restrictions related to the COVID-19 pandemic. The Company may revise guidance during the year to reflect changes to expected results, including from effects related to COVID-19. 8 Aurizona: Potential for Expansion and Mine Life Extension • ~1 Moz Reserves with upside • Replaced 2019 mining depletion • New Tatajuba resource Current 120-130,000 oz 2020 production1 Expansion Upside Potential Mine life, production, underground • Near-mine extension along strike • Regional targets • Positive study for underground mine
- 9. 1. Guidance does not reflect the effect of potential future temporary mine suspensions, regulations and restrictions related to the COVID-19 pandemic. The Company may revise guidance during the year to reflect changes to expected results, including from effects related to COVID-19. 9 Mesquite: Outperforming Expectations • Open-pit heap leach since 1985 • Replacing mining depletion with exploration success and stacking ore from historical dumps Current 130-140,000 oz 2020 production1 Extension Upside Potential Historical dumps, new deposits • Significant ore-grade oxide material remaining in historical dumps • New targets around pits • Permitting to drill new zones
- 10. 1. Based on the July 2018 prefeasibility study. The Phase 2 feasibility study is targeted for completion around the end of 2020. The Phase 2 expansion will be contained within the existing permitted mine boundary. 10 Castle Mountain: Long-life Low-Cost Mine • First gold pour October 15, 2020 • Phase 1 mine: ~12,700 t/d run of mine heap leach operation Phase 1 ~45,000 oz Avg. annual production1 Phase 2 ~200,000 oz Avg. annual production1 • Phase 2 feasibility targeted for end of 2020 • Phase 2 mine: ~41,000 t/d run of mine heap leach operation with a new CIL milling circuit for higher-grade ore 3.6 Moz gold reserves, average AISC ~$763/oz over initial 16-year mine life1
- 11. 1. As per Leagold’s October 2018 feasibility study, available at www.equinoxgold.com. 11 Santa Luz: Restart Plan1 Restart Plan 1.3 Moz Gold Reserves ~100,000 oz Avg. Annual Production $856/oz Avg. Life-of-Mine AISC 11-yr Mine Life <$100 M Capex ~1 Moz Life-of-Mine Production • Past-producing mine with permits in place • Refurbish and retrofit existing infrastructure • Early works underway • Updated capex and economics in Q4 2020 • Upside potential on surface and underground
- 12. 12 Other Assets in the Americas RDM (Brazil) • Avg. 75,000 oz/year gold, operating since 2014 • 2020 guidance: 50-55,000 oz at AISC of $1,000-1,050/oz1,2 • Conventional open-pit mine with carbon-in-leach plant • Pit extension once permit received to access higher-grade ore Fazenda (Brazil) • Avg. 75,000 oz/year gold, operating since 1990s • 2020 guidance: 50-55,000 oz at AISC of $925-$975/oz1,2 • Primarily underground operation with some small open pits • Consistent reserve replacement with exploration success • District potential with Santa Luz project Pilar (Brazil) • Avg. 40,000 oz/year gold, operating since 2014 • 2020 guidance: 25-30,000 oz at $1,200-$1,300/oz1,2 • Two underground mines feeding a carbon-in-pulp plant • Extension potential from new Três Buracos deposit 1. Gold production attributable to Equinox Gold after March 10, 2020, the closing date of the Leagold Merger. 2. Guidance does not reflect the effect of potential future temporary mine suspensions and restrictions related to the COVID-19 pandemic. The Company may revise guidance during the year to reflect changes to expected results, including from effects related to COVID-19.
- 13. 1. Cash and equivalents of $494 M at June 30, 2020. Repaid $200 on Revolving Credit Facility on August 24, 2020. 2. Potential proceeds from in-the-money warrants. Average exercise price C$13.94. The majority of warrants expire on October 6, 2021 with an exercise price of C$15. 3. Face value of the convertible notes held by Mubadala Investment Company and Pacific Road Resources Fund. Mubadala holds notes of $130M and Pacific Road of $9.7 M convertible at a fixed US$ price of $5.25 per share at the holders’ option. Mubadala also holds a second $130 M note and Pacific Road a $9.3 M note convertible at a fixed US$ price of $7.80 per share at the holder’s option. If both notes were fully converted, the Company would issue 44.5 M shares. 13 Strong Balance Sheet Capital Structure at June 30, 2020 Cash & Equivalents1 $300 M Potential Proceeds from ITM Warrants2 $200 M Undrawn from Revolving Credit Facility $200 M Drawn from Revolving Credit Facility $200 M Amortizing Credit Facility – fully drawn $100 M Total Bank Debt $300 M ITM Convertible Notes @ avg US$6.503 $253 M $300 M Cash on Hand >$500 M Total Liquidity $200 M Undrawn Revolver Positive net cash position $200 M Potential Warrant Proceeds2
- 14. 14 Aligned with Shareholders Performance Stock Units 20% Restricted Stock Units 20% Base Salary 30% Bonus 30% Source: Company filings, FactSet, street research, Wood Mackenzie. 1. Insider ownership considers only Executives and Directors who have personally invested to hold shares in the company and does not include corporate shareholders. 24.1% 8.5% 1.8% 1.0% 0.9% 0.7% 0.7% 0.6% 0.5% 0.4% 0.4% 0.4% 0.4% 0.3% 0.3% 0.2% 0.2% 0.1% 0.0% Endeavour Mining Equinox B2Gold Evolution Northern Star IAMGOLD OceanaGold Torex Eldorado Alamos Pretium Yamana Saracen Sibanye-Stillwater St Barbara SSR Mining Centerra Regis Kirkland Lake Insider Ownership1 Equinox Gold Incentive to Outperform CEO Pay Structure Executive Compensation • CEO and Executive compensation heavily weighted toward corporate and market performance • Individual and corporate objectives with defined targets • Minimum ownership of 3x base salary for CEO & President • Minimum ownership of 1x base salary for CFO and COO • Implementing employee share ownership program • Low corporate G&A < $50/oz
- 15. $0 $100 $200 $300 $400 B2Gold Saracen Northern Star Evolution Regis Endeavour Mining Alamos Intermediate Average Torex St Barbara SSR Mining Yamana OceanaGold Equinox Gold Centerra Pretium IAMGOLD Eldorado 0.5x 1.0x 1.5x Evolution B2Gold Yamana Senior Average Saracen Northern Star Pretium Endeavour Mining Intermediate Average SSR Mining Regis Sibayne-Stillwater Centerra St. Barbara Alamos Equinox Gold Torex OceanaGold Eldorado IAMGOLD 0 400 800 1,200 Endeavour Mining Northern Star Sibanye-Stillwater B2Gold Yamana Centerra Equinox IAMGOLD Evolution Saracen SSR Mining Alamos OceanaGold Torex Eldorado St Barbara Regis Pretium EQX EV/Resource (22 Moz) undervalued compared to peers EV/AuEq Resources ($/oz) Source: FactSet, analyst consensus estimates, street research, Wood Mackenzie. 15 Compelling Valuation 2021E Au Production (koz) 2021E gold production at higher end of peers Equinox Gold Equinox Gold Equinox Gold Valuation does not reflect asset base or growth profile Consensus P/NAV
- 16. Torex Northern Star Evolution St Barbara Kirkland Lake Alamos OceanaGold IAMGOLD Eldorado Pretium Centerra Yamana Endeavour Mining B2Gold SSR Mining Regis Saracen Sibanye- Stillwater 0.25x 0.50x 0.75x 1.00x 1.25x 1.50x 1.75x 2.00x 250 500 750 1,000 1,250 P/NAV(ratio) 2021E Au Production (koz) Market cap: US$1 B Source: Company filings, FactSet, street research. SSR Mining is shown proforma the merger with Alacer Gold. 16 Enhanced Scale Creates Re-rate Opportunity Potential for further re-rate as production continues to grow Equinox Gold (before Leagold merger) Equinox Gold (Current valuation) Equinox Gold (Future production with growth projects)
- 17. 17 Fully Funded for Growth 2020 Catalysts Operations & Development • Los Filos expansion and CIL construction start • Santa Luz construction start Castle Mountain Phase 1 gold pour • Castle Mountain Phase 2 feasibility study • Commence Aurizona underground prefeasibility study Exploration • Extend mine life at Aurizona, Fazenda, Los Filos and Mesquite • Upgrade Aurizona underground resources Corporate Complete Leagold merger and integration GDX and GDXJ ETF inclusion S&P/TSX index inclusion Sustainability reporting on website • Re-rate potential with increased scale • Accretive M&A
- 18. 1818 Appendix
- 19. 19 Equinox Gold: Corporate Summary 1.Basic basis when Q2 2020 results were announced on August 10, 2020. 2.Following the August 20, 2019 5:1 share consolidation, each EQX warrant and option exercises into 0.20 EQX shares and 0.05 Solaris Resources shares, and five warrants or options must be exercised to get one full EQX share. As a result, weighted average warrant and option exercise prices are shown at the price that would be paid to Equinox Gold to receive one full EQX share. Following the March 10, 2020 merger with Leagold, each LMC warrant exercises into 0.331 EQX shares. Warrant and option numbers are shown as the number of common shares that would be issued upon exercise of the securities. 3.Restricted Share Units are shares committed to management and directors that are issued subject to time-based and performance-based vesting terms, as part of equity-based compensation. 4.Fully diluted shares outstanding includes the Mubadala and Pacific Road convertible notes, which are in the money. See footnote 7. 5.Average daily trading value since January 1, 2020. 6.Cash as at June 30, 2020. Drawn debt comprises $400M from the senior revolving credit facility and $100M from the senior amortizing credit facility, both of which are fully drawn, and excludes equity settled notes. 7.Face value of the convertible notes held by Mubadala Investment Company and Pacific Road Resources Fund. Mubadala holds notes of $130M and Pacific Road of $9.7M, convertible at a fixed US$ price of $5.25 per share at the holders’ option. Mubadala also holds a second $130M note and Pacific Road a $9.3M note convertible at a fixed US$ price of $7.80 per share at the holder’s option. If both notes were fully converted, the Company would issue 44,458,207 shares. 8.Calculated using the October 30, 2020 closing price for EQX. Common Shares 1 241.1 M Fully Diluted Shares 4 310.6 M Listed Warrants @ C$15.00 2 16.1 M Avg. Daily Trading Value 5 ~ C$22.6 M + US$14.1 M Unlisted Warrants @ avg C$8.84 1,2 3.3 M Cash / Net Debt 6 $494 M / $244 M Options @ avg C$6.80 1,2 3.7 M Convertible Notes @ avg. $6.50 7 $253 M Restricted Share Units 3 2.1 M Market Cap (basic) 8 ~ C$3.4 B / US$2.6 B ANALYST COVERAGE BMO Capital Markets, Canaccord Genuity, CIBC World Markets, Cormark Securities, Haywood Securities, National Bank Financial, Scotiabank, SmithWeekly, Stifel GMP, TD Securities
- 20. 1. Production costs and capital attributable to Equinox Gold post merger completion on March 10, 2020. 3. Exchange rates used to forecast 2020 AISC include a rate of BRL 4.75 to USD 1 and MXN 21.0 to USD 1. 4. Los Filos mining and development activities were temporarily suspended on September 3, 2020 as the result of a blockade. This suspension is not reflected in guidance, which was updated on August 10, 2020. 2. AISC/oz sold, sustaining capital and expansion capital are non-IFRS measures. See Cautionary Statements. 20 Updated 2020 Production and Cost Guidance 1 Production (oz) AISC2,3 ($/oz) Sustaining Capital1 Expansion Capital1 Los Filos1,4 90,000 - 110,000 $850 - $950 $21 $58 Aurizona 120,000 - 130,000 $1,000 - $1,050 $36 $3 Mesquite 130,000 - 140,000 $975 - $1,025 $12 $11 Fazenda1 50,000 - 55,000 $925 - $975 $7 $4 RDM1 50,000 - 55,000 $1,000 - $1,050 $9 $4 Pilar1 25,000 - 30,000 $1,200 - $1,300 $5 $2 Castle Mountain 5,000 - 10,000 $750 - $800 - $52 Santa Luz1 - - - $10 Total – Updated 470,000 - 530,000 $975 - $1,025 $90 $144 Total – Pre-COVID 540,000 - 600,000 $1,000 - $1,060 $88 $143 Attributable to Equinox Gold after March 10, 2020, the closing date of the Leagold merger Guidance updated to reflect strong performance at Mesquite and Aurizona, lower production at Los Filos related to COVID-19 restrictions4, and strong first half cost performance across the mines
- 21. 1. Consolidated mine AISC/oz sold excludes corporate general and administration expenses. 2. Cash cost/oz, AISC/oz, adjusted EBITDA, adjusted net income, adjusted EPS, and net debt are non-IFRS measures. See Non-IFRS Measures and Cautionary Statements. 2. During the three months ended December 31, 2019, the Company had only the Mesquite and Aurizona mines in operation. On March 10, 2020, four additional operating mines were acquired through the Leagold Merger. 21 Comparative Quarterly Highlights Three months ended Operating data Units June 30, 20202 March 31, 20202 December 31, 2019 Gold produced oz 127,016 88,951 80,176 Gold sold oz 125,824 82,629 80,330 Realized gold price $/oz 1,712 1,574 1,482 Mine AISC per oz sold (1,2) $/oz 900 968 848 Financial data Revenue M$ 215.4 130.0 119.0 Earnings from mine operations M$ 85.1 43.2 38.5 Net income (loss) M$ (58.7) 10.9 (8.5) Earnings (loss) per share $/share (0.26) 0.08 (0.08) Adjusted EBITDA (2) M$ 82.7 49.5 47.9 Adjusted net income (2) M$ 26.6 17.1 20.9 Adjusted EPS(2) $/share 0.12 0.12 0.18 Balance sheet and cash flow data Cash and equivalents (unrestricted) M$ 494.1 303.1 67.7 Net debt (2) M$ 244.3 446.8 196.3 Operating cash flow before changes in working capital M$ 61.0 23.2 38.9
- 22. 22 COVID-19 Response Health & Safety Business Continuity Workforce Support Travel restrictions Remote work policies Restrictions to site access Enhanced health checks Enhanced medical protocols Enforced physical distancing Increased cleaning, sanitizing Proactive testing, early isolation Government engagement Contingency plan with suppliers Alternate supply routes Stockpiling critical supplies Enforced safety protocols Fortified cash reserves Regular communication Job protection Protect high-risk personnel Mental health services Transition assistance Financial planning Protecting our workforce, our communities and our business Test – Trace – Isolate
- 23. 1. Combined Total Recordable Injury Frequency Rate for all sites year-to-date 2020. 23 Committed to Continuous Improvement and Responsible Mining Environment Social Governance Equinox Gold is a signatory to the International Cyanide Management Code; Mesquite and Los Filos are certified Aurizona received Excellence in Mining & Metallurgy Industry award in 2018 and 2019 Insiders have personally invested to own ~9% of combined company shares Independent oversight of tailings management at all sites Majority of workforce at all sites from local regions At-market merger aligned with prevailing market sentiment Site environmental management systems based on ISO:4001 TRIFR1 YTD 2020 of 3.77 per million hours worked Performance-based incentive compensation program Implementing SASB/TCFD based ESG reporting in 2020 Programs to increase skills capacity in local communities Strong corporate governance using industry best practices
- 24. 1. Proven and Probable Reserves with an effective date of October 31, 2018. See Technical Disclosure. 2. Based on 4,000 t/d CIL plant contemplated in March 2019 feasibility study. EQX reviewing the potential for a larger CIL plant. 24 Los Filos: Expansion Project Underway LOS FILOS OPEN PIT 7 years 26.9 Mt at 0.65 g/t; 0.558 Moz1 BERMEJAL OPEN PIT 5 years 34.6 Mt at 0.57 g/t; 0.631 Moz1 Crusher Uncrushed Leach Pad #1 Crush Leach Pad #2 Offices & Workshops Sur Underground MineNorte Underground Mine ADR Plant LOS FILOS UNDERGROUND 3 years 1.9 Mt at 5.50 g/t; 0.338 Moz1 GUADALUPE OPEN PIT 9 years 34.5 Mt at 1.37 g/t; 1.520 Moz1 BERMEJAL UNDERGROUND 9 years 6.4 Mt at 6.57 g/t; 1.348 Moz1 10 Year Mine life 4.5 Moz P&P Reserves1 $213 M Capex2
- 25. 1. Exploration composites are calculated on uncapped assay values. The samples are from the saprolite zone where surficial processes can significantly enrich gold content. Applying the 40 g/t Au cap that was used for saprolitic material in the Piaba resource estimate would change the interval to 5.29 g/t Au over 21.0 m. 25 Aurizona: Mine Life Extension Along Strike High-grade near-surface discoveries east of Piaba: • 1.18 g/t Au/ 60 m • 1.89 g/t Au/ 13 m • 3.28 g/t Au/ 9 m • 84.3 g/t Au/ 21 m1 Tatajuba grades similar or higher than Piaba: • 13.74 g/t Au/ 35 m • 2.71 g/t Au/ 56 m • 2.47 g/t Au/ 69 m • 1.42 g/t Au/ 34 m • 1.14 g/t Au/ 120 m PIABA TATAJUBA PIABA NORTH TREND GENIPAPO MESTRE CHICO MICOTE 0 1 km Near-mine targets within ~1,100 km2 land package BOA ESPERANÇAPIABA TREND
- 26. 26 Aurizona: PEA Results for Underground Mine1 2.8 g/t AVG. GOLD GRADE $925/oz ALL-IN-SUSTAINING COSTS2 741 Koz GOLD PRODUCTION $228 M NPV5% at $1,620/oz 38% IRR At $1,620/oz 2,800 t/d UNDERGROUND MILL FEED $70 M INITIAL CAPEX $1.2 B REVENUE at $1,620/oz 2. All-in-sustaining costs is a non-IFRS measures. See Cautionary Statements. 1. The PEA is included in Section 24 of the “Technical Report on the Aurizona Gold Mine, Brazil” dated April 27, 2020 that is available for download at www.equinoxgold.com. The PEA is preliminary in nature and includes Inferred Mineral Resources that are considered too speculative geologically to have the economic considerations applied to them that would enable them to be categorized as mineral reserves. There is no certainty that the results contemplated in the PEA will be realized. Potential to increase production and extend mine life
- 27. 27 Aurizona: District-scale Potential on EQX Land Package Numerous regional targets within ~1,100 km2 land package
- 28. 28 Castle Mountain: Easy Site Access in Safe Jurisdiction Castle Mountain Mesquite
- 29. See Cautionary Statements and Technical Disclosure. 29 Proven & Probable Mineral Reserves Mine/Project Proven Probable Proven and Probable Tonnes (kt) Grade (g/t) Contained gold (koz) Tonnes (kt) Grade (g/t) Contained gold (koz) Tonnes (kt) Grade (g/t) Contained gold (koz) Aurizona 12,399 1.51 600 7,379 1.51 358 19,778 1.51 958 Castle Mountain 136,611 0.58 2,559 60,977 0.51 1,004 197,589 0.56 3,563 Mesquite 115 1.05 4 37,700 0.54 654 37,815 0.54 658 Los Filos 26,168 0.91 768 78,052 1.44 3,626 104,220 1.31 4,395 Leach pad inventory 114 114 RDM 5,647 0.73 133 19,079 1.08 656 24,726 0.99 789 Fazenda 2,632 1.77 150 2,756 1.91 169 5,387 1.84 319 Pilar 961 1.51 47 6,044 1.13 219 7,005 1.18 266 Santa Luz 25,000 1.43 1,153 3,200 1.03 106 28,200 1.39 1,259 Total Proven and Probable 5,414 6,906 12,321
- 30. Resources are inclusive of Reserves. See Cautionary Statements and Technical Disclosure. 30 Measured & Indicated Mineral Resources Mine Measured Indicated Measured and Indicated Tonnes (kt) Grade (g/t) Contained gold (koz) Tonnes (kt) Grade (g/t) Contained gold (koz) Tonnes (kt) Grade (g/t) Contained gold (koz) Aurizona 14,264 1.52 697 20,066 1.7 1,097 34,330 1.62 1,793 Castle Mountain 160,711 0.58 2,989 81,377 0.51 1,344 242,089 0.56 4,333 Mesquite 165 0.85 5 110,644 0.44 1,567 110,809 0.44 1,571 Los Filos 114,631 0.77 2,851 211,678 1.02 6,922 326,309 0.93 9,773 RDM 3,195 0.77 79 36,107 1.02 1,181 39,303 1.00 1,259 Fazenda 4,870 2.17 339 2,670 2.55 219 7,540 2.30 558 Pilar 2,389 3.50 269 13,479 2.13 922 15,868 2.33 1,191 Santa Luz 31,200 1.36 1,364 9,700 1.96 612 40,900 1.50 1,976 Total Measured and Indicated 331,425 8,593 485,721 13,864 817,148 22,454
- 31. See Cautionary Statements and Technical Disclosure. 31 Inferred Mineral Resources Mine Tonnes (kt) Grade (g/t) Contained Gold (koz) Aurizona 17,267 1.98 1,100 Castle Mountain 171,395 0.40 2,210 Mesquite 73,980 0.32 752 Los Filos 98,204 0.83 2,633 RDM 8,305 1.50 401 Fazenda 6,040 2.45 476 Pilar 20,399 3.21 2,108 Santa Luz 7,700 2.02 501 Total Inferred 403,290 10,181
- 32. 32 Technical Disclosure National Instrument 43-101 Unless otherwise stated, scientific and technical information concerning the Los Filos Mine Complex is summarized, derived, or extracted from the “Independent Technical Report for the Los Filos Mine Complex, Mexico” by SRK Consulting (Canada) Inc., dated March 11, 2019 with an effective date of October 31, 2018. The Los Filos technical report has been filed with Canadian securities regulatory authorities and is available for review on the Company’s website and on the profile of Leagold Mining Corporation on SEDAR at www.sedar.com. Unless otherwise stated, scientific and technical information concerning the Mesquite Mine is summarized, derived, or extracted from the “Technical Report on the Mesquite Gold Mine, Imperial County, California, U.S.A.” prepared by AGP Mining Consultants Inc. with an effective date of December 31, 2019. The Mesquite technical report has been filed with Canadian securities regulatory authorities and is available for review on the Company’s website and on the Equinox Gold profile on SEDAR at www.sedar.com. Mesquite Mineral Reserve and Mineral Resources were updated as at June 30, 2020 with the results announced in a press release dated October 8, 2020 which is available on Equinox Gold’s website and on SEDAR at www.sedar.com. Unless otherwise stated, scientific and technical information concerning the Aurizona Mine is summarized, derived, or extracted from the “Technical Report on the Aurizona Gold Mine” prepared by AGP Mining Consultants Inc. with an effective date of January 24, 2020. The Aurizona technical report has been filed with Canadian securities regulatory authorities and is available for review on the Company’s website and on the Equinox Gold profile on SEDAR at www.sedar.com. Unless otherwise stated, scientific and technical information concerning the Fazenda Mine is summarized, derived, or extracted from the “Technical Report on the Fazenda Brasileiro Mine, Bahia State, Brazil” by Roscoe Postle Associates Inc., dated November 26, 2018 with an effective date of May 31, 2018. The Fazenda technical report has been filed with Canadian securities regulatory authorities and is available for review on the Company’s website and on the Equinox Gold profile on SEDAR at www.sedar.com. Unless otherwise stated, scientific and technical information concerning the RDM Mine is summarized, derived, or extracted from the “Technical Report on the Riacho dos Machados Gold Mine, Minas Gerais, Brazil” by Roscoe Postle Associates Inc., dated November 20, 2018 with an effective date of May 31, 2018. The RDM technical report has been filed with Canadian securities regulatory authorities and is available for review on the Company’s website and on the Equinox Gold profile on SEDAR at www.sedar.com. Unless otherwise stated, scientific and technical information concerning the Pilar Mine is summarized, derived, or extracted from the “Technical Report on the Pilar Operations, Goiás State, Brazil” by Roscoe Postle Associates Inc., dated December 20, 2018 with an effective date of May 31, 2018. The Pilar technical report has been filed with Canadian securities regulatory authorities and is available for review on the Company’s website and on the Equinox Gold profile on SEDAR at www.sedar.com. Unless otherwise stated, scientific and technical information concerning the Castle Mountain Project is summarized, derived, or extracted from the “NI 43-101 Technical Report on the Preliminary Feasibility Study for the Castle Mountain Project” prepared by Kappes, Cassiday and Associates with an effective date of July 16, 2018. The Castle Mountain technical report has been filed with Canadian securities regulatory authorities and is available for review on the Company’s website and on the Equinox Gold profile on SEDAR at www.sedar.com. Unless otherwise stated, scientific and technical information concerning the Santa Luz Project is summarized, derived, or extracted from the “Technical Report on the Santa Luz Project, Bahia State, Brazil” by Roscoe Postle Associates Inc., dated November 14, 2018 with an effective date of October 22, 2018. The Santa Luz technical report has been filed with Canadian securities regulatory authorities and is available for review on the Company’s website and on the Equinox Gold profile on SEDAR at www.sedar.com. Readers are reminded that results outlined in the technical reports for each of these projects are preliminary in nature and may include inferred mineral resources that are considered too speculative geologically to have the economic considerations applied to them that would enable them to be categorized as mineral reserves. There is no certainty that the mine plans and economic models contained in any of the reports will be realized. Readers are further cautioned that mineral resources that are not mineral reserves do not have demonstrated economic viability. Readers are also advised to refer to the latest annual information form and technical reports of the Company as well as other continuous disclosure documents filed by the Company available at www.sedar.com, for detailed information (including qualifications, assumptions and notes set out accordingly) regarding the mineral reserve and mineral resource information contained on this document. Qualified Persons The technical information in this document has been reviewed by Doug Reddy, P.Geo., Equinox Gold’s COO and by Scott Heffernan, MSc, P.Geo., Equinox Gold’s EVP Exploration, who are the Qualified Persons under National Instrument 43-101 for Equinox Gold and have approved and verified the technical content of this document.
- 33. 33 +1 604.558.0560 ir@equinoxgold.com www.equinoxgold.com TSX: EQX | NYSE-A: EQX