1. Investment Thesis
BYD Company Limited (Strong Buy; Price target: HK$53.6)
BYD has three main business sectors, namely auto, handset components and assembly services, and batteries. In
addition, the auto and handset components are the main growth engines of BYD, accounting up to 90% of the
company revenue. As at 2014, the company owns 65% stake in BYD Electronics.
As one of the most prestigious manufacturers in rechargeable batteries, BSD has gained the largest market share
in nickel-cadmium batteries, handset Li-ion batteries, mobile chargers and keypads in a global context. We foresee
the business to grow more rapidly entailed by increasing demand both in battery storage and solar energy.
Meanwhile, the company can exploit cost advantages in manufacturing storage device given its availability to
utilize the recovery value of its previous automotive resources in battery production.
Its leading position is not confined only to the battery market. The company acquired Qinchuan Automobile to
tap in the automobile industry in 2002 and set range of policy goals in electric vehicles. As an early leader in the
automobile, the NEV business has experienced explosive growth in 2015H4 and is potentially the biggest revenue
driver amid ongoing R&D in NEV, shifted preference towards new energy and strengthened regulatory
requirement. BYD also produces mobile components and assembly services, servicing major smartphone brands.
Recently, the company’s metal casings production has gained popularity and we believe BYD is well positioned
to benefit from the proliferation of it amid competitions and premiumisation of tier two domestic handset brands.
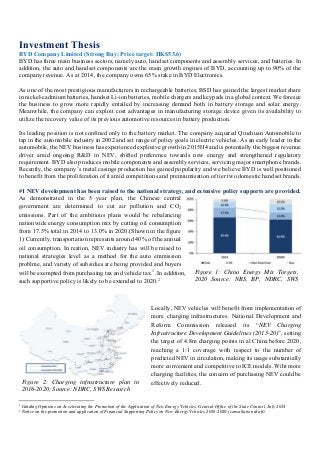
#1 NEV development has been raised to the national strategy, and extensive policy supports are provided.
As demonstrated in the 5 year plan, the Chinese central
government are determined to cut air pollution and CO2
emissions. Part of the ambitious plans would be rebalancing
nationwide energy consumption mix by cutting oil consumption
from 17.5% total in 2014 to 13.0% in 2020.(Shown in the figure
1) Currently, transportation represents around 40% of the annual
oil consumption. In reation, NEV industry has will be raised to
national strategies level as a method for the auto emmission
problme, and variety of subsidies are being provided and buyers
will be exempted from purchasing tax and vehicle tax.1
. In addition,
such supportive policy is likely to be extended to 2020.2
Locally, NEV vehicles will benefit from implementation of
more charging infrastructures. National Development and
Reform Commission released its “NEV Charging
Infrastructure Development Guidelines (2015-20)”, setting
the target of 4.8m charging points in al China before 2020,
reaching a 1:1 coverage with respect to the number of
predicted NEV in circulation, making its usage substantially
more convenient and competitive to ICE models. Wiht more
charging facilities, the concern of purchasing NEV could be
effectively reduced.
1 Guiding Opinions on Accelerating the Promotion of the Application of New Energy Vehicles, General Office of the State Council, July 2014
2 Notice on the promotion and application of Financial Supporting Policy on New Energy Vehicles 2016-2020 (consultation draft).
Figure 1: China Energy Mix Targets,
2020 Source: NBS, BP, NDRC, SWS
Figure 2: Charging infrastructure plan in
2016-2020; Source: NDRC, SWS Research
2. Moreover, the licence restrictions imposed in 7 of China’s tier-1
cities are also likely to boost demand for new NEVS, as the new-car
restrictions focus more on conventional cars at the moment. Even in
the cities,for intance Beijing, which posed a restriction on NEVs, the
quota is still more than sufficient to absord all current market
demand.(Please refer to the Figure 3) Also, in the four high tier cities:
Beijing, Shanghai, Shenzhen and Guangzhou: buying a NEV model
would skip the problem of obtaining a licence either by winning a
lottery or by paying a high price for one and the licenses are free of
charge.
Furthermore, Li Keqiang’s plan to phase out 6M units of the so-called “Yellow labeled” vehicles accounting for
at least 53% of auto emissions will be helpful for the public transportation elctrification. This results in local
governments’ plan of replacing public transportation vehicles like buses and taxis with new EV models. Recently,
the local protectionism are effectively reduced due to pressure from central government. As a result, local
governmet choose BYD instead of some local brands. In around 6 provience in China, K9 (bus) and E6 (taxi)
produced by BYD have already won its reputation.3
With such new demand for NEV, we believe that K9 and E6
will gain lion’s share of the public transportation marke tin China and BYD’s market leader position will be
further enhanced.
#2 Favorable Industry Situation
Due to increasing emphasis on China’s air pollution, the government has outlined long-term goals to shift China
into a non-oil dependent economy. Hence, the country’s NEV industry is fully backed by the government with
supporting schemes including plans to boost electric vehicles, hybrid electric vehicles and fuel-cell vehicles.
Based on the units sold in 2015, BYD has become the world’s largest NEV manufacturers. (Please refer to Figure
4.) Qin (Plug-in Hybrid Passenger Vehicles) and S7 (Plug-in Hybrid Sports Utility Vehicles) are the key drivers
for such achievement. With 878.1% increase in Plug-in Hybrid Vehicles in 2014, we project a 30% CAGR YoY
growth in domestic NEV sales during 2015-2020E. (Please refer to Figure 5.)
3 JPMorgan_BYD Company Limited Deep dive into NEV prospects Initiate with OW_Apr_28,_2014
Figure 3: Allocation of NEV license plates
in Beijing; Source: SWS Research
Figure 4:Cumulative global NEV sales by automaker,
Nov 2015; Source: CAAMS, SWS Research
Figure 5: China’s NEV sales volume forecast;
Source: SWS Research
3. #3 Cost advantages over its peers
Since BYD transfered from being a purely battery provider to auto mobile manufacture through agressively vertical
integration, it could be regarded as technology leader in battery field. As demonstrated in the Figure 6, battery costs represent
42% of total EV cost. With continuous input in the R&D and cut-edge techonology, BYD has significantly reduce the
battery cost while increasing its energy density. In addition, there is a predicted 50% decrease potential for this cost
component by 2020, which would certainly make NEV produced by BYD more price friendly to its customers. (Please refer
to Figure 7.) Taking “Qin” sedan model as an example, such cost saving on battery cost leads to 15% lower manufacturer’s
suggested retail price than BYD competitor, for example Roewe E550.4
Figure 6:NEV Cost Breakdown; Source: JP Morgan Figure 7: Automotive Battery Cost at Pack Level
Furthermore, the cost advantage of BYD’s car models is not limited to the initial purchasing cost, but includes
the fuel and maintenance costs as well. Compared to conventional vehicles, New Energy Vehicles come with
substantially lower fuel costs, because electricity is cheaper than gasoline all over the world, and its price is less
volatile than the latter. For instance, BYD’s E6 taxi has average daily cost of fuel which is only 20 to 25% that
of conventional taxis.5
Moreover, maintenance costs are also much lower in NEVs, which do not need some
regular services as traditional vehicles do, for instance lubricant change and cleaning filters. A E6 taxi requires
almost zero yearly maintenance cost, whereas conventional vehicles could require around 80%-90% of purchase
price throughout their lifetime. We believe that such cost advantages in terms of the initial purchasing costs and
follow up costs would provide incentive for the customer to choose NEV models over the conventional
automobiles.6
# 4 Weak competitive threats due to huge R&D input
Based on the current situation, BYD could be regarded as the market leader of Chinese NEV carmaker sector,
since no other producers own such developed proprietary systems for core parts of Electric Vehicles. Therefore,
the threat of future intense competition within New Energy Vehicle segment will come from foreign competitors
or the Sino-foreign Joint Ventures, which also have the expertise to develop NEV. As demonstrated in Figure
4, BYD, however, sold more NEV than the sales of BMW and Renault combined. BYD has sold 61.7 thousand
units in total, the second runner up being Nissan with 51.6 thousand, a remarkable 10 thousand gap between the
leader and the second. With first mover advantage, we estimate that the market leader position held by BYD
won’t be challenged by the late comers in the short run.
In addition, the continuous huge input R&D input would be the key to maintain competitiveness in the long run.
In terms of the absolute R&D input, BYD has surpassed Tesla, leader in luxury NEV market, from 2009 to 2011,
averaging early R&D expense of 5.84% revenues over the same period. Also, BYD has the highest R&D
expenditure as percentage of revenues among domestic OEMs (Original Equipment Manufacturers). Such
continuous input would be the key for product mix upgrade and crowding out potential competitors. Hence, we
believe the challenges from other players in NEV market are weak.
4
SWSResearchCo,Ltd_BYD(1211HK) Green lights ahead_Feb_22,_2016
5 MorganStanley_BYD Company Limited Long way to profitability Initiate A shares at UW_Dec_11,_2014
6 Ibid
4.
#5 Handset components: Moderate growth
With Samsung Electronics, Nokia and Huawei being BYD’s major customers, the company produces metal and
plastic casings, keypads, FPCBs and LCDs. We project the product mix of BYD to enhance amid intense
competitions of smartphone brands. In addition, major brands are differentiating their premium products by
installing metal casings, and it is of paramount beneficiary for BYD to move from a handset EMS to handset
metal casing supplier. Based on the observed transformation and development of the company, we believe the
stock price of which is severely undervalued.
Notwithstanding that, according to IDC, the growth of global smartphone shipments has gone down from 29% in
2014 to 10% in 2015, we project the growth of metal casings to be strong in the coming two years, and such
operation constitute the main revenue stream in BYD’s handset component, accounting up to 60.3% of the
company’s total revenue. BYD’s metal casing business will see an accelerated growth thanks to higher demand
of domestic mid-range handset model manufactures combining metal casings into their products. The success of
the move can be observed from two types of metal casings phones launched by Samsung in 2014, namely Galaxy
A5 and Galaxy A3 (Samsung’s units). We believe the impact of which would offset the negative impact from the
slowing growth of smartphone shipments since BYD can exploit the opportunity to fetch a larger market share
from intense competitions from major smartphone brands.
#6 Rechargeable energy: Large growing potential ahead
BYD’s rechargeable battery business is a supplement to the handsets and other portable device. The segment is
constantly developing techniques to recycle EV batteries for energy storage products. On top of the revenue
engendered from battery, the company also includes revenue from its photovoltaics business, including wafers
and assembly of cells and modules production for solar energy supply. The company is also backed by its strong
customer base from both the local and foreign clients in its energy storage (more elaboration needed, or it has to
be deleted).
Thanks to the advance development in the segment, BYD had won a contract in 2015 to supply a 31.5MW storage
project led by Invenergy in Illinois. This is the largest order in installed capacity for the company since established.
With rapidly expanding demand in energy storage, renewable energy installations become more popular and we
expect even larger projects will be placed on BYD.
Moreover, batteries previously employed by the company in automotive applications have recovery value for the
company’s storage batteries. The automotive batteries operating at 80% of designed capacity can still be used in
storage stations, entailing a cost advantage for the company for further development. Thus, we expect the growth
of BYD’s rechargeable battery business to be higher than expected due to wider GPM and will be reflected by a
higher share price of the company.
Figure 8: BYD and Tesla’s R&D expenditure
comparison; Source: J.P. Morgan estimates
Figure 9: BYD has the highest R&D % among
domestic OEMs; Source: J.P. Morgan estimates
5. Key assumptions
Valuation
BYD is valued at HKD$53.6 based on 46.72x P/E. WACC: 10.2%;
Terminal Value Multiples: 11x EV/Gross Profit
- Based on the current charging facilities in China and USA, we project that another 10 years are needed
for China to catch up with USA.
- Tesla Motors Inc (NASDAQ:TSLA) is traded at 33x EV/Gross Profit.(Tesla Motors has a negative
EBITDA right now, and we are using gross profit to rule out the gross margin effect on the EV/Revenue)
Based on the sensitivity test, our view on this stock doesn’t change even in the worst scenario.
Given the current market price (HK$ 40.95), 31% upside is expected.
(Please refer to the Appendix A and B for the details of valuation model and sensitivity test.)
Risks
Weaker than expected NEV sales
Stronger than expected competition with Sino-foreign joint venture
The subsidy reduction on NEV by central government
12.0%
13.0%
14.0%
15.0%
16.0%
17.0%
18.0%
19.0%
FY13 FY14 FY15E FY16E FY17E
Gross margin
0%
5%
10%
15%
20%
25%
30%
35%
40%
0
20000
40000
60000
80000
100000
FY13 FY14 FY15E FY16E FY17E
Revenue Stream
Rechargeable Battery and Photovoltaic
Handset and Assembly Service
Antomoblies
YoY Growth
Figure 10: The Projection about the Revenue Stream Figure 11: Change in Gross Margin
6. Appendix A: Summary of Financials
Appendix B: The Sensitivity Test: BYD’ Stock Price against the Terminal Multiple and WACC
Income Statement Ratio Analysis
Rmb in millions, year end Dec FY13 FY14 FY15E FY16E FY17E Rmb in millions, year end Dec FY13 FY14 FY15E FY16E FY17E
Revenues 49,768 55,366 72,744 81,960 90,078 Gross margin 13.1% 13.8% 15.5% 17.4% 18.0%
Cost of goods sold (43,252) (47,743) (61,490) (67,701) (73,826) EBITDA margin 11.1% 12.1% 13.5% 12.7% 13.2%
Gross Profit 6,516 7,623 11,254 14,260 16,251 Operating margin 3.8% 4.3% 7.7% 7.1% 7.8%
R&D expenses (1,279) (1,865) (2,485) (2,810) (3,102) R&D/sales 2.6% 3.4% 3.4% 3.4% 3.4%
SG&A expenses (458) (515) (2,317) (3,483) (3,994) SG&A/Sales 0.9% 0.9% 3.2% 4.3% 4.4%
Other income 746 1,464 3,400 2,483 2,715 Tax Rate 6.8% 15.3% 19.6% 17.3% 16.5%
Depr. & amortization (3,627) (4,315) (4,247) (4,630) (4,888)
Operating profit (EBIT) 1,898 2,393 5,605 5,819 6,982 Sales growth 12.1% 11.2% 31.4% 12.7% 9.9%
EBITDA 5,525 6,708 9,852 10,449 11,869 Operating profit growth 61.1% 26.1% 134.2% 3.8% 20.0%
Interest expense (1,066) (1,519) (1,509) (1,389) (1,273) Net profit growth 579.6% (21.6%) 555.3% 11.4% 34.8%
Earnings before tax 832 874 4,096 4,430 5,709 EPS (reported) growth 579.6% (23.9%) 541.9% 11.4% 34.8%
Tax (56) (134) (804) (766) (945)
Minority interest (223) (306) (451) (499) (497)
Net income (reported) 553 434 2,841 3,165 4,267
EPS (reported) 0.23 0.18 1.15 1.28 1.72
Shares outstanding 2,354 2,425 2,476 2,476 2,476
Revenue breakdown Dicounted Cash Flow
Rmb in millions, year end Dec FY13 FY14 FY15E FY16E FY17E Rmb in millions, year end Dec FY13 FY14 FY15E FY16E FY17E
Antomoblies 25382 26576 40137 46340 55580 Net income 553 434 2,841 3,165 4,267
YoY Growth 4.7% 51.0% 15.5% 19.9% Depr. & amortization (3,627) (4,315) (4,247) (4,630) (4,888)
BYD Conventional Car 23207 19520 22687 24500 25200 Change in working capital (1,744) (4,710) (2,192) (1,389) (2,204)
Units(K) 464 390 463 500 525 Cash flow from operations 2,436 38 4,895 6,405 6,951
ASP(RMB K) 50 50 49 49 48 Capex (5,808) (4,241) (9,000) (6,000) (5,000)
BYD Hybrid Car 135 1794 5330 6000 7700 Free cash flow (3,372) (4,203) (4,105) 405 1,951
Units(K) 1 13.8 41 50 70
ASP(RMB K) 135 130 130 120 110 WACC 10.2%
BYD Electric Car 510 672 3120 3840 5280 Discount PV (1,933)
Units(K) 1.7 2.4 12 16 22 Terminal Multiples 11.3027
ASP(RMB K) 300 280 260 240 240 Terminal Value 137,255
BYD Electric Bus 1530 4590 9000 12000 17400
Units(K) 1 3 6 8 12 Total EV 135,322
ASP(RMB K) 1530 1530 1500 1500 1450 Net Debt 26062.47
Handset and Assembly Service 19409 23808 28354 31380 29958 Equity Value 109259.2
YoY Growth 22.7% 19.1% 10.7% -4.5% Shares Outstanding 2,425
Rechargeable Battery and Photo 4977 4983 4253 4241 4539 Stock Price 45.1 RMB 53.611 HKD
YoY Growth 0.1% -14.6% -0.3% 7.0% Market Price 40.95 HKD
Total Revenue 49,768 55,366 72,744 81,960 90,078 Upside/Downside 31%
P/E Ratio 46.72
% of Total Revenue
Antomoblies 51% 48% 55% 57% 62%
Handset and Assembly Service 39% 43% 39% 38% 33%
Rechargeable Battery and Photovolt 10% 9% 6% 5% 5%
Total Revenue 100% 100% 100% 100% 100%
BYD Company Limited(HKG:1211) Summary of Financials
Terminal MultiplesWACC
76.4 9.50% 10.00% 10.20% 10.50% 11.00%
10.00 66.01 66.01 66.00 66.00 66.00
10.50 70.00 69.99 69.99 69.99 69.99
11.30 76.38 76.37 76.37 76.37 76.37
11.50 77.97 77.97 77.97 77.96 77.96
12.00 81.96 81.95 81.95 81.95 81.95