1. Ed McCabe
917-902-6814
efmccabe15@hotmail.com
March 13, 2014 1
National Oilwell Varco (NOV)Ma
Great Company, But Bad Stock at Top of Rig Construction Cycle
Offshore Rig Construction Cycle is Peaking Now
Stock Performance Correlates with Orders, Which Will Turn Negative for At
Least the Next Two Years
• Second biggest offshore rig construction cycle on record ends this year and NOV’s orders will turn
negative
o NOV’s stock performance correlates 76% with its Rig Tech orders
o Expect orders to decline 26% and 18% in 2014 and 2015, respectively, and that could be
generous
• Supply glut is here
o 145 of 222 (65%) offshore rigs to be delivered from shipyards between 2014 and 2020 are
uncontracted
• Supply glut is more acute near-term
o 111 of 153 (73%) offshore rigs to be delivered from shipyards between 2014 and 2015 are
currently uncontracted
• 60 of 254 (24%) active floating rigs are coming off contract and looking for customers in 2014
• The Petrobras tender, which generated 9 floater orders worth ~$2 billion for NOV in 2013, has
ended, making for tough comparisons in 2014
• NOV’s record of 67 jackup orders in 2013 may never be matched again, never mind in 2014, as
113 of 134 (84%) jackups to be delivered from shipyards between 2014 and 2020 are uncontracted
• NOV’s offshore driller customers are getting skittish as dayrates soften
• Majors are slowing offshore cap ex as they focus more on cash discipline and returns
• Shipyards offering “great” terms to undercapitalized “non-traditional” buyers likely marks the top
• NOV is a high-quality company but, with this rig construction cycle about to turn down, it’s
reasonable to believe that the stock at least revisits its 52-week low of $63. Depending on how this
cycle plays out it could go lower than that.
o Cyclical stocks almost always overshoot in both directions.
• In any event, I think upside is very limited given deteriorating industry fundamentals.
3. Ed McCabe
917-902-6814
efmccabe15@hotmail.com
March 13, 2014 3
• National Oil Well Varco is absolutely dominant in its key business, Rig Technology, with at least some piece of
its equipment on essentially every rig in the world. I’m not sure I’ve seen a business with a larger moat. It has
consolidated the industry and really has no competition. In fact, most drillers have standardized around NOV’s
technology.
• As the company converts backlog, which sat at an all-time high of $16.2 billion at the end of 2013, into revenue
it will post strong earnings and cash flow over the next three years.
• Based on my estimates, NOV is trading at a fairly reasonable valuation of 12x my 2015 EPS estimate. It’s also
trading at around a 10% free cash flow yield and I expect the dividend to triple to $3.20 by 2016 for a dividend
yield of 4% based on today’s stock price.
• However, Rig Tech accounts for ~60% of NOV’s operating income and the market is efficient enough to
discount the earnings and cash flow embedded in NOV’s backlog. As such, the stock is driven by order
growth for Rig Tech, which I expect to deteriorate markedly during 2014 and 2015, if not longer, as the
second biggest rig construction cycle of all time comes to an end.
• I think the cycle ends and NOV’s order growth turns negative this year because:
O There is too much speculative inventory at shipyards. Of the 222 offshore rigs to be delivered
between now and 2020, 145 (65%) have no contract.
O The speculative supply problem is even worse near-term. Of the 153 rigs scheduled for delivery in
2014 and 2015, 111 (73%) are looking for customers.
O Orders from Petrobras won’t repeat. In mid-2010 NOV tendered for 28 Petrobras rigs. Since that
time NOV has booked 25 orders totaling ~$5.5 billion related to the tender.
O Aside from what is coming out of the shipyards, 24% of the industry’s active floating fleet will come
off contract and be looking for work in 2014.
O NOV’s customers – the drilling contractors – are seeing dayrates start to soften and are generally
expecting a 12-18 month “pause” in the market. Their view is driven not only by what they’re seeing
in dayrates, but the looming supply glut and the fact that some of their customers, particularly the
majors, have recently indicated they’re slowing offshore cap ex spending. A “pause” may be possible,
but it also may be wishful thinking.
O A recent wave of demand for rigs from entrepreneurs taking advantage of generous shipyard terms
may be the strongest indication of a cycle top.
4. Ed McCabe
917-902-6814
efmccabe15@hotmail.com
March 13, 2014 4
IT’S ALL ABOUT THE ORDERS
NOV is an excellent company. Some piece of its rig equipment package, which includes derricks, drawworks, top
drives, mud pumps, control systems, fluids handling systems, blowout preventers, risers, pipe handling systems and
cranes, among many other components, sits on almost every rig in the world. In fact, most customers have
completely standardized around NOV’s rig package. NOV simply dominates this business. (It should also be noted
that NOV has a burgeoning FPSO (floating production, storage and offloading) business that posted over $1 billion
of NOV’s $13 billion in Rig Tech orders in 2013.)
Aside from Rig Tech, which accounts for ~60% of operating income before unallocated expenses, NOV has two
other businesses, which are primarily driven by rig count: Petroleum Solutions & Services (~30% of operating
income) and Distribution & Transmission, a marginal contributor to profits NOV intends to spin-off the first half of
this year.
The stock looks cheap. However, what has driven the stock historically has been Rig Tech orders. Orders for 2011,
2012, and 2013 were $10.8 billion (+186%), $9.4 billion (-14%) and $13.1 billion (+40%), respectively. Given the
issues mentioned earlier, particularly all the speculative rigs sitting in shipyards, I’m confident this rig construction
cycle has peaked and will break in the next quarter or two.
Bulls will point to the company’s dominant competitive position. They’ll point to record backlog converting into
~$3 billion of free cash flow and a free cash flow yield of ~10%. They’ll point to dividend increases and I have
NOV tripling its dividend to $3.20 by 2016 for a 4% dividend yield. They’ll point to a below-market PE multiple.
They’ll point to a balance sheet, which unlike some of NOV’s driller customers, is rock solid and will carry them
through any cyclical downturn – even an extended one.
They’re right on all of these counts. However, while the market isn’t as efficient as generally advertised it’s
efficient enough to discount a balance sheet and earnings and cash flow that can be reasonably forecasted from
current backlog on the back of a cocktail napkin. Orders drive this stock and orders are going down.
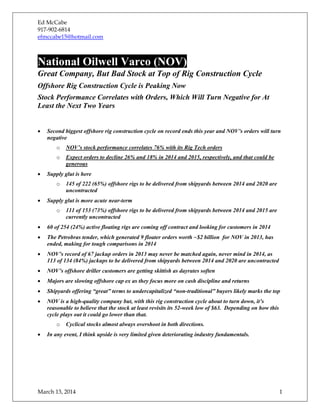
Obviously, orders, revenue and backlog are all related. All are fairly correlated to NOV’s stock performance. Since
2005 NOV’s stock performance has been 66% and 68% correlated to revenue and backlog, respectively. However,
at 76%, it has correlated most closely with orders, which makes sense since orders represent the future cash flows
the market needs to solve for.
5. Ed McCabe
917-902-6814
efmccabe15@hotmail.com
March 13, 2014 5
I’d also point out that while NOV is reasonably valued, it can get cheaper based on recent history. Since 2010,
NOV has traded at a low of 8x NTM earnings due to the Deep Horizon disaster and a high of 19x as the market
correctly anticipated the rig construction cycle that began in October of 2010. Over this period the average PE
multiple has been 13x, close to the 12x it trades at currently.
$0
$10
$20
$30
$40
$50
$60
$70
$80
$90
$0
$500
$1,000
$1,500
$2,000
$2,500
$3,000
$3,500
$4,000
$4,500
2/1/2005
5/1/2005
8/1/2005
11/1/2005
2/1/2006
5/1/2006
8/1/2006
11/1/2006
2/1/2007
5/1/2007
8/1/2007
11/1/2007
2/1/2008
5/1/2008
8/1/2008
11/1/2008
2/1/2009
5/1/2009
8/1/2009
11/1/2009
2/1/2010
5/1/2010
8/1/2010
11/1/2010
2/1/2011
5/1/2011
8/1/2011
11/1/2011
2/1/2012
5/1/2012
8/1/2012
11/1/2012
2/1/2013
5/1/2013
8/1/2013
11/1/2013
Quarterly Orders & Stock Performance
Orders
Price
5.0x
7.0x
9.0x
11.0x
13.0x
15.0x
17.0x
19.0x
21.0x
1/4/2010
3/4/2010
5/4/2010
7/4/2010
9/4/2010
11/4/2010
1/4/2011
3/4/2011
5/4/2011
7/4/2011
9/4/2011
11/4/2011
1/4/2012
3/4/2012
5/4/2012
7/4/2012
9/4/2012
11/4/2012
1/4/2013
3/4/2013
5/4/2013
7/4/2013
9/4/2013
11/4/2013
1/4/2014
NTM PE Multiple
Since 1/1/2010:
Average: 13.0x
Hi: 19.2x
Lo: 8.1x
6. Ed McCabe
917-902-6814
efmccabe15@hotmail.com
March 13, 2014 6
NOV’s ORDER HISTORY
As mentioned, the current rig construction cycle is generally considered to have begun in October of 2010.
However, I could argue it really began in 2005 and was only interrupted due to two extraordinary events – the
financial collapse and the Deepwater Horizon spill. Regardless, at $13.1 billion, NOV’s Rig Tech orders for 2013
were its best by a significant margin, at 21% above 2011’s record.
To forecast NOV’s orders I’ve tried to figure out primarily two things: 1) is what drove demand over the last several
years sustainable and 2) and what does the supply picture look like?
$2,932
$6,022
$7,080 $7,347
$1,587
$3,790
$10,849
$9,350
$13,115
$-
$2,000
$4,000
$6,000
$8,000
$10,000
$12,000
$14,000
2005 2006 2007 2008 2009 2010 2011 2012 2013
Order History
7. Ed McCabe
917-902-6814
efmccabe15@hotmail.com
March 13, 2014 7
THE DRIVERS OF NOV’S RECENT ORDERS DON’T LOOK SUSTAINABLE AND SPECULATIVE
SUPPLY IS ABOUT TO HIT THE MARKET
Highlighted in green are the key areas that have driven demand for NOV I believe are unsustainable.
NOV RIG TECH ORDERS
2010 2011 2012 2013
Floaters
Petrobras Floater Units 3 7 6 9
Other Floater Units 2 24 19 17
Ttl Floater Units 5 31 25 26
Avg Order 214$ 220$ 220$ 220$
Petrobras Order Value 642 1,540 1,320 1,980
Other Order Value 428 5,280 4,180 3,740
Floater Order Value 1,070$ 6,820$ 5,500$ 5,720$
Growth
Petrobras 140% ‐14% 50%
Other 1134% ‐21% ‐11%
Ttl Floaters 537% ‐19% 4%
Petrobas Mix 60% 23% 24% 35%
Jackups
Jackup Units 6 40 8 67
Avg Order 50$ 50$ 50$ 50$
Jackup Order Value 300$ 2,000$ 400$ 3,350$
Growth 567% ‐80% 738%
Total Offshore Rig Packages
Floaters + Jackups 11 71 33 93
Blended Avg Order 125$ 124$ 179$ 98$
Order Value 1,370$ 8,820$ 5,900$ 9,070$
Growth 544% ‐33% 54%
Offshore Rig Mix
Petrobras Floaters 47% 17% 22% 22%
Other Floaters 31% 60% 71% 41%
Jackups 22% 23% 7% 37%
FPSO
Order Value 250$ 200$ 771$ 1,150$
Growth ‐20% 286% 49%
Other Orders
Order Value 2,170$ 1,829$ 2,679$ 2,895$
Growth ‐16% 46% 8%
TOTAL ORDER VALUE 3,790$ 10,849$ 9,350$ 13,115$
Growth 186% ‐14% 40%
Total Order Mix
Petrobras Floaters 17% 14% 14% 15%
Other Floaters 11% 49% 45% 29%
Total Floaters 28% 63% 59% 44%
Jackups 8% 18% 4% 26%
Total Offshore Rig Packages 36% 81% 63% 69%
FPSO 7% 2% 8% 9%
Other 57% 17% 29% 22%
8. Ed McCabe
917-902-6814
efmccabe15@hotmail.com
March 13, 2014 8
Floaters
Floaters are, as the name indicates, rigs that float, highlighted by drillships and semisubmersibles that drill in water
depths of as much as 12,000 feet. Both go for $600 million or more. A full rig package on a drillship or a semi
generates ~$250 million for NOV. However, because some of NOV’s customers have standardized around
Cameron or GE for subsea BOPs, NOV’s average rig package order for a floater is ~$220 million. Needless to say,
these orders, at almost a quarter of a billion dollars a pop, can drive NOV’s order total up or down violently.
In mid-2010 NOV tendered for a 28-rig package from Petrobras. Unsurprisingly, NOV did quite well, booking 25
orders worth over $5 billion since 2010. 2013 was the strongest order year with Petrobras, with NOV booking 9
floaters worth ~$2 billion, which accounted for 35% of floater orders, 22% of all offshore rig orders and 15% of
total orders for NOV in 2013. Actually, the timing of the Petrobras orders was quite fortunate for NOV. Stripping
out Petrobras, floater orders would have been down 21% and 11% for 2012 and 2013, respectively. The Petrobras
tender was a boon for NOV, but it has passed and provides challenging comps going forward.
Petrobras aside, as mentioned, business from other floater customers has actually been down each of the last two
years and things are likely about to get worse for two major reasons: 1) the number of active floaters rolling off
contract and looking for work in 2014, a year where majors are slowing the pace of offshore cap ex spending and 2)
the significant number of floaters under construction without contracts.
Below, by quarter and by driller, are charts that show 60 floaters, or 24% of the active floating fleet, will be looking
for work this year. This is one component of supply about to hit the market.
2014 Contract Rollovers For Floating Rigs by Water Depth
Current Ttl
1Q14 2Q14 3Q14 4Q14 Total % Active Rigs
UDW 1 3 12 10 26 20% 133
DW 4 5 1 5 15 34% 44
MW 6 4 3 6 19 25% 77
Total Floaters 11 12 16 21 60 24% 254
Ultra‐deepwater 7,500’ or more
Deepwater 4,500’ to less than 7,500'
Midwater more than 400’ to less than 4,500’
9. Ed McCabe
917-902-6814
efmccabe15@hotmail.com
March 13, 2014 9
The other major component of supply is the number of floaters to be delivered this year through 2020 that are
without contracts. 32 of 88 (36%) floaters scheduled for delivery between now and 2020 are looking for work. The
issue is more severe near-term. Of 30 floaters scheduled for delivery in 2014, 12, or 40%, are not under contract. In
2015, 15 of 23 (65%) need a contract.
I think the day of reckoning for floaters is here with 27 of the 53 (51%) vessels scheduled for delivery between now
and the end of 2015 currently without customers. With that much uncontracted supply looming I think the newbuild
cycle for floaters is set to end, driving softness in NOV’s Rig Tech order book beginning this year.
2014 Contract Rollovers for Floating Rigs by Company 2014 Contract Rollovers for Floating Rigs by Company & Water Depth
1H14 2H14 Total % of Fleet UDW % DW % MW % Total
Transocean 8 15 23 42% Transocean 12 44% 7 70% 4 22% 23
Diamond Offshore 5 3 8 33% Diamond Offshore ‐ ‐ 2 29% 6 50% 8
Ensco 2 6 8 38% Ensco 6 46% 1 14% 1 100% 8
Noble 1 4 5 24% Noble 2 17% 3 50% ‐ ‐ 5
Pacific Drilling ‐ 2 2 40% Pacific Drilling 2 40% ‐ ‐ ‐ ‐ 2
Saipem 1 1 2 22% Saipem ‐ ‐ ‐ ‐ 2 67% 2
Seadrill ‐ 2 2 12% Seadrill 2 12% ‐ ‐ ‐ ‐ 2
Songa Offshore 2 ‐ 2 40% Songa Offshore ‐ ‐ ‐ ‐ 2 40% 2
Atwood 1 ‐ 1 20% Atwood ‐ ‐ 1 33% ‐ ‐ 1
Dolphin ‐ 1 1 17% Dolphin ‐ ‐ ‐ ‐ 1 20% 1
Ocean Rig ‐ 1 1 13% Ocean Rig 1 13% ‐ ‐ ‐ ‐ 1
Odfjell Drilling ‐ 1 1 17% Odfjell Drilling 1 25% ‐ ‐ ‐ ‐ 1
Stena ‐ 1 1 14% Stena ‐ ‐ ‐ ‐ 1 33% 1
Other 3 ‐ 3 75% Other ‐ ‐ 1 100% 2 100% 3
Total Floaters 23 37 60 24% Total Floaters 26 20% 15 34% 19 25% 60
Floaters
Floater Deliveries Uncontracted %
2014 30 12 40%
2015 23 15 65%
2016 15 5 33%
2017‐2020 20 ‐ ‐
88 32 36%
20 26 27 26 26 31 32 33
41
62
84
107
126
139
169
192
207
0
50
100
150
200
250
2000
2001
2002
2003
2004
2005
2006
2007
2008
2009
2010
2011
2012
2013
2014E
2015E
2016E
Ultra-Deepwater Rig Count
10. Ed McCabe
917-902-6814
efmccabe15@hotmail.com
March 13, 2014 10
Jackups
Jackups don’t float. They are used in relatively shallow water (generally 400 feet or less) and are “jacked up” off
the ocean floor. Jackup demand has been driven by the need to modernize an antiquated fleet, much of which is
incapable of handling today’s demanding drilling requirements. It is estimated that there are around 500 jackups
marketed worldwide and about half of these were built in the late 1970s and early 1980s.
Jackups currently being built generally go for $200 million or more. NOV content on these jackups averages around
$50 million. Jackup building can be rather volatile as indicated by NOV’s orders over the last four years. NOV had
orders for 6 (~$300 million), 40 (~$2 billion), and 8 (~$400 million) jackup rig packages in 2010, 2011, and 2012,
respectively. 2013 was a remarkable year for NOV with 67 jackup rig package orders, eclipsing the preceding three
years combined. The record jackup order total of ~$3.4 billion in 2013 accounted for 37% of offshore rig orders and
26% of NOV’s total Rig Tech orders of $13.1 billion.
NOV has taken orders for 121 jackups over the last four years, with more than half of those booked in 2013. So,
even allowing for the conventional wisdom that 50% of 500 marketed jackups, or ~250, are too old NOV has
grabbed a good chunk of the jackup modernization market.
To the extent “non-traditional” buyers taking advantage of generous shipyard terms have played in the offshore rig
market it is likely their participation was most impactful in the volatile jackup market and drove this unprecedented
boom year. I’d venture to guess that these poorly capitalized speculators will be first to exit the market. It’s likely
happening as we speak.
It seems the market is indicating that its jackup supply needs are more than being met. Of 40 jackups scheduled for
delivery in 2014, 28, or 70%, are not under contract. In 2015, 56 of 60 (93%) need a contract. Through the end of
2015, 100 deliveries are scheduled and 84 (84%) need work.
So there is clear overcapacity in the jackup market and I see this newbuild cycle ending as well. Frankly, given the
volatile nature of the jackup newbuild market, the likelihood that incremental demand was driven by “non-
traditional” (NOV’s words) buyers enjoying generous financing terms from their shipyard vendors, and the amount
of speculative inventory coming to market jackups are going to get crushed.
Jackups
Jackup Deliveries Uncontracted %
2014 40 28 70%
2015 60 56 93%
2016 31 27 87%
2017‐2020 3 2 67%
134 113 84%
12. Ed McCabe
917-902-6814
efmccabe15@hotmail.com
March 13, 2014 12
Order Forecast
It goes without saying that trying to forecast orders for $600 million floaters (~$220 million for NOV content) and
$200 million jackups (~$50 million to NOV) is far from an exact science in terms of both units and timing.
The key drivers of my order forecast, which has orders down 26% in 2014 and another 18% in 2015, are:
• No Petrobras floater orders over the forecast period and a continuation of the decline in floaters for
customers other than Petrobras that began in 2012.
• A decline in jackup orders that starts in 2014 and intensifies in 2015. (With an unprecedented 67 jackup
orders in 2013, my 50-order forecast for 2014 is likely on the aggressive side.)
• Strong growth in NOV’s burgeoning FPSO business.
• Decent growth for other Rig Tech equipment.
13. Ed McCabe
917-902-6814
efmccabe15@hotmail.com
March 13, 2014 13
NOV RIG TECH ORDERS
2010 2011 2012 2013 2014E 2015E 2016E
Floaters
Petrobras Floater Units 3 7 6 9 ‐ ‐ ‐
Other Floater Units 2 24 19 17 11 8 8
Ttl Floater Units 5 31 25 26 11 8 8
Avg Order 214$ 220$ 220$ 220$ 220$ 220$ 220$
Petrobras Order Value 642 1,540 1,320 1,980 ‐ ‐ ‐
Other Order Value 428 5,280 4,180 3,740 2,420 1,760 1,760
Floater Order Value 1,070$ 6,820$ 5,500$ 5,720$ 2,420$ 1,760$ 1,760$
Growth
Petrobras 140% ‐14% 50% ‐100% 0% 0%
Other 1134% ‐21% ‐11% ‐35% ‐27% 0%
Ttl Floaters 537% ‐19% 4% ‐58% ‐27% 0%
Petrobas Mix 60% 23% 24% 35% 0% 0% 0%
Jackups
Jackup Units 6 40 8 67 50 18 24
Avg Order 50$ 50$ 50$ 50$ 50$ 50$ 50$
Jackup Order Value 300$ 2,000$ 400$ 3,350$ 2,500$ 900$ 1,200$
Growth 567% ‐80% 738% ‐25% ‐64% 33%
Total Offshore Rig Packages
Floaters + Jackups 11 71 33 93 61 26 32
Blended Avg Order 125$ 124$ 179$ 98$ 81$ 102$ 93$
Order Value 1,370$ 8,820$ 5,900$ 9,070$ 4,920$ 2,660$ 2,960$
Growth 544% ‐33% 54% ‐46% ‐46% 11%
Offshore Rig Mix
Petrobras Floaters 47% 17% 22% 22% 0% 0% 0%
Other Floaters 31% 60% 71% 41% 49% 66% 59%
Jackups 22% 23% 7% 37% 51% 34% 41%
FPSO
Order Value 250$ 200$ 771$ 1,150$ 1,637$ 1,818$ 1,909$
Growth ‐20% 286% 49% 42% 11% 5%
Other Orders
Order Value 2,170$ 1,829$ 2,679$ 2,895$ 3,185$ 3,503$ 3,853$
Growth ‐16% 46% 8% 10% 10% 10%
TOTAL ORDER VALUE 3,790$ 10,849$ 9,350$ 13,115$ 9,742$ 7,981$ 8,722$
Growth 186% ‐14% 40% ‐26% ‐18% 9%
Total Order Mix
Petrobras Floaters 17% 14% 14% 15% 0% 0% 0%
Other Floaters 11% 49% 45% 29% 25% 22% 20%
Total Floaters 28% 63% 59% 44% 25% 22% 20%
Jackups 8% 18% 4% 26% 26% 11% 14%
Total Offshore Rig Packages 36% 81% 63% 69% 51% 33% 34%
FPSO 7% 2% 8% 9% 17% 23% 22%
Other 57% 17% 29% 22% 33% 44% 44%
14. Ed McCabe
917-902-6814
efmccabe15@hotmail.com
March 13, 2014 14
OFFSHORE RIG SUMMARY
• NOV’s floater orders have been driven by the Petrobras tender, which has ended. Beginning this year floater
supply will come in two forms: 1) active rigs coming off contract and 2) uncontracted newbuild deliveries.
• NOV’s jackup demand has been driven in part by a legitimate need to modernize the fleet, but a substantial
portion of this need has been met and the jackup market has a glut of speculative newbuilds that will begin to
hit the market this year.
• If you combine floaters and jackups under construction, 145 of 222 (65%) are looking for work.
• The problem is more acute near-term as 111 of 153 (73%) rigs to be delivered between now and 2015 are
currently uncontracted.
• In addition to what’s coming out of the shipyards, another 60 (24%) active floaters will roll off contracts in
2014 and are looking for work as well.
• NOV’s customers, the drillers, are getting skittish. See conference call excerpts later in this report.
• Management has indicated it is seeing some “non-traditional” demand. When I explored this comment further
with the company I learned that these buyers, which include entrepreneurs (some from the drilling industry and
some from other industries altogether) who have raised capital, are typically not well capitalized and are
attracted to “great” shipyard terms.
o Poorly capitalized customers getting “great” terms from vendors has often been the sign of a market
top in my experience.
• The rig construction cycle has peaked and will turn down this year. Rig Tech equipment orders will decline and
likely so will the stock. Bulls will argue an order decline is “priced in” the stock. Sometimes things are priced
in – usually not.
16. Ed McCabe
917-902-6814
efmccabe15@hotmail.com
March 13, 2014 16
Rig Tech Forecast
Rig Tech 2012 2013 2014E 2015E 2016E
Cap Equip 7,652$ 8,740$ 10,644$ 10,267$ 10,407$
Parts 2,455 2,874 3,454 4,079 4,816
Total Revenue 10,107 11,614 14,099 14,345 15,223
Growth 15% 21% 2% 6%
% of Revs 50% 51% 55% 55% 56%
Op Inc 2,380 2,447 3,070 3,228 3,501
Op Mar 23.5% 21.1% 21.8% 22.5% 23.0%
% of Op Inc before unallocated 57% 61% 64% 65% 66%
Orders & Backlog (Rig Tech Cap Equipment only)
Beg Backlog 10,164$ 11,862$ 16,237$ 15,334$ 13,049$
Cap Equip Revs 7,652 8,740 10,644 10,267 10,407
Orders 9,350 13,115 9,742 7,981 8,722
Ending Backlog 11,862$ 16,237$ 15,334$ 13,049$ 11,365$
Book‐to‐Bill 1.2x 1.5x 0.9x 0.8x 0.8x
Growth
Orders 40% ‐26% ‐18% 9%
Backlog 37% ‐6% ‐15% ‐13%
17. Ed McCabe
917-902-6814
efmccabe15@hotmail.com
March 13, 2014 17
NOV’s OTHER BUSINESSES
As mentioned, Rig Technology accounts for ~60% of NOV’s operating income and orders for this business drives
the stock. However, National Oilwell Varco has two other businesses, Petroleum Services & Supplies and
Distribution & Transmission, which the company plans to spin-off in the first half of this year. Both businesses are
fairly tied to rig count, which I expect to stay relatively flat over the next several years.
Petroleum Services & Supplies
PS&S manufactures rents and sells consumable goods such as drill pipe, pumps, valves, solids control systems,
drilling motors, drilling fluids, drill bits, downhole tools, among many other things, used in drilling operations.
At $7 billion of revenue and a segment operating margin of 18%, which was pressured last year due to the declining
rig count, this is a good business. I expect revenue to grow mid-single-digits over the forecast period and for
margins to creep toward 19% as North American customers work through consumable inventory and international
continues to grow.
Distribution & Transmission
D&T distributes pipe, maintenance, repair and operating (MRO) supplies and parts to well sites and production
locations, pipeline operations, processing plants as well as to industrial facilities (waste water treatment, chemical,
food and beverage, paper and pulp, mining, agriculture markets) and municipalities through a worldwide network of
~400 branches. 90% of what D&T sells is produced by third-parties.
D&T is a $5 billion business, but with a 5% operating margin it contributes little to NOV’s profitability. NOV plans
to spin this business off in the first half of this year. The spin-off ratio has not been announced yet and for purposes
of my analysis D&T is included in my forecast for NOV.
Average Active Drilling Rigs 2009 2010 2011 2012 2013 2014E 2015E 2016E
US 1,086 1,541 1,875 1,919 1,761 1,772 1,721 1,708
Canada 221 351 423 365 354 367 315 326
International 997 1,094 1,168 1,234 1,296 1,348 1,374 1,339
Worldwide 2,304 2,986 3,466 3,518 3,411 3,488 3,410 3,374
Growth
US 42% 22% 2% ‐8% 1% ‐3% ‐1%
Canada 59% 21% ‐14% ‐3% 4% ‐14% 4%
International 10% 7% 6% 5% 4% 2% ‐3%
Worldwide 30% 16% 2% ‐3% 2% ‐2% ‐1%
18. Ed McCabe
917-902-6814
efmccabe15@hotmail.com
March 13, 2014 18
CURRENT RIG CONSTRUCTION CYCLE VERSUS THOSE PAST
The current offshore rig building cycle, which began in October of 2010, is the fourth since 1972. The previous
three cycles lasted four to five years. The current cycle is in the middle of year four.
The first two cycles were driven by a rise in oil prices. The cycle that began in 1972 lasted four years and produced
203 rigs. The five-year cycle that began in 1977, the biggest boom of all time, produced 402 offshore rigs. Over
twenty years passed before the next four-year construction cycle, which spanned from 2005 to 2008, produced 210
rigs. That cycle was driven by the combination of strong oil prices and the need to modernize the world’s fleet.
The current cycle, which I estimate has already produced close to 160 rigs, is considered to be driven by what is
referred to in the industry as “bifurcation.” In other words, the market is bifurcated between older, less safe, and
most importantly, less capable rigs and new state-of-the art rigs, highlighted by ultra-deepwater floaters which can
drill in as much as 12,000 feet of water and high-specification jackups capable of drilling in over 350 feet of water
as well as in harsh environments.
While I do believe that this cycle has been driven by the “bifurcation” dynamic, I think a significantly oversupplied
market is upon us, as evidenced by dayrates that are softening for working rigs, the number of working rigs rolling
off contracts near-term, and, most importantly, the number of speculative rigs under construction in the world’s
shipyards.
Cycle Driver Rigs Ordered Avg Cost/Rig
1972‐75 Oil Prices 203
Jackups (mainly <=250') 90 $10‐$30M
Semisubmeribles 76
Drillships 37
Total Floaters (mainly <=2K') 113 $20‐$40M
Cycle Driver Rigs Ordered Avg Cost/Rig
1977‐81 Oil Prices 402
Jackups (mainly <400') 344 $20‐$55M
Semisubmeribles 51
Drillships 7
Total Floaters (mainly <=2K') 58 $70‐$90M
Cycle Driver Rigs Ordered Avg Cost/Rig
2005‐08 20 yr pause 210
Jackups (mainly =>300') 110 $150‐$200M
Semisubmeribles (mainly UDW) 44
Drillships (mainly UDW) 56
Total Floaters 100 $600‐$750M
Cycle Driver Rigs Ordered Avg Cost/Rig
2010‐Current Bifurcation 158
Jackups (mainly =>400') 98 $200M
Semisubmeribles (mainly UDW)
Drillships (mainly UDW)
Total Floaters 61 $600‐$650M
Total Rigs 158
19. Ed McCabe
917-902-6814
efmccabe15@hotmail.com
March 13, 2014 19
Rigs Under Construction
The chart below shows the number of rigs currently under construction, which stands at over 220. Combined with
the 158 offshore rigs I estimate have already been delivered in the current cycle this will be the second biggest
offshore rig construction cycle ever, totaling 380 rigs vs. the 1977-81 total of 402. Obviously, that assumes no one
starts another newbuild project. From past experience, I know that’s likely a dumb assumption. These bubbles
almost always run longer than logic would suggest – and the downturn is almost always more severe than people can
envision.
I could also argue that this cycle really began in 2005 and was only interrupted because of two extraordinary events
– the 2008/2009 financial collapse and the Deepwater Horizon oil spill of 2010. If I combine the current cycle with
the 2005-2008 cycle the industry will have produced 590 rigs if work does not begin on one more single rig. Again,
the “bifurcation” concept is a legitimate one and much of this cycle has occurred for good reason. For instance, it is
estimated that there are around 500 jackups marketed worldwide and about half of these were built in the late 1970s
and early 1980s. These older rigs are headed for the scrap heap. Similarly, due to fairly recent deepwater
discoveries, there has been legitimate demand for state-of-the art drillships and semisubmersibles. However, I think
we’ve now overbuilt as evidenced by the rigs currently under construction without contracts.
Any way you look at this cycle what is most striking is the number of rigs under construction without contracts. 145
of 222 rigs (65%) to be delivered between now and 2020 are without contracts, with 32 of 88 floaters (36%) and 113
of 134 jackups (84%) looking for customers.
The oversupply issue is most severe near-term. 12 of 30 (40%) and 15 of 23 (65%) floaters to be delivered in 2014
and 2015, respectively, are without contracts. 28 of 40 (70%) and 56 of 60 (93%) jackups to be delivered in 2014
and 2015, respectively, need work. Offshore rig building needs to stop so these rigs can be digested into the market.
With the issue of uncontracted rig deliveries upon us I think this cycle comes to an end this year. Company
managements will tell you that if there is a pause it will be temporary – measured in quarters, not years. My
experience has been that cycles like these take much longer hiatuses.
Offshore Rig Construction (floaters & jackups)
Floaters
Floater Deliveries Uncontracted %
2014 30 12 40%
2015 23 15 65%
2016 15 5 33%
2017‐2020 20 ‐ ‐
88 32 36%
Jackups
Jackup Deliveries Uncontracted %
2014 40 28 70%
2015 60 56 93%
2016 31 27 87%
2017‐2020 3 2 67%
134 113 84%
Combined
Deliveries Uncontracted %
2014 70 40 57%
2015 83 71 86%
2016 46 32 70%
2017‐2020 23 2 9%
222 145 65%
21. Ed McCabe
917-902-6814
efmccabe15@hotmail.com
March 13, 2014 21
NOV’s CUSTOMERS ARE GETTING SKITTISH
A review of the fourth quarter conference call transcripts for NOV’s major customers, the offshore drillers, indicates
they’re getting a bit nervous about market conditions. I’ve excerpted relevant parts of the calls later in this report,
but I think the quotes highlighted below pretty much sum up consensus thinking among the offshore drillers.
The short story is the drillers see a lot of newbuild capacity coming online and acknowledge a significant portion of
the active fleet is rolling off contract. They also acknowledge that their customers, E&Ps, are slowing offshore cap
ex spending. All of these dynamics are starting to reveal themselves in weakening dayrates.
However, essentially all of them believe (or at least say) that this period of softness will be a “pause” of 12-18
months and largely base this outlook on current oil prices. While this consensus (and at least slightly biased)
forecast could prove prescient it also could be a tough needle to thread in large part because E&Ps are slowing
offshore cap ex spending at current oil prices, the price drillers are counting on to work through current rig
oversupply. Arguably, you need higher oil prices to begin to work through this supply.
“The visibility in the floater segment has become less certain since our last earnings call. The
combination of a slowdown in announced fixtures near-term, uncontracted newbuild capacity and a
significant number of pending deepwater and ultra-deepwater rig contract rollovers, has clouded
our 12- to 18-month outlook. Adding to this has been a handful of unsuccessful appraisals of
previous discoveries and a nearly universal call by E&P operators to improve cash returns and cost
discipline in the wake of rising costs and low realized returns.”
“What we're seeing is an absence of demand increase to account for the continuing flow of
newbuilds…”
Atwood Oceanics CEO, Robert Saltiel
“As we have regularly reminded folks, offshore drilling is a cyclical business. At this point, while
commodity prices remain robust, there is a near-term increase in the supply of drilling rigs
concurrent with late demand for rig capacity on the part of our customers.”
Transocean CEO, Steven Newman
“The industry seems a little bit anxious about the recent plateau. With the current supply of 515
jack-ups and 137 more under construction, the big question remains will the market be oversupplied
in the coming years
Rowan Executive Vice President of Business Development, Mark Keller
“Well, as we said, we're not going to pick up newbuildings that are speculatively delivering from the
yard.”
Ocean Rig CEO, George Economou
22. Ed McCabe
917-902-6814
efmccabe15@hotmail.com
March 13, 2014 22
NOV’s CORRELATION TO THE STOCKS OF ITS CUSTOMERS
Over the last 14 years NOV’s stock has shown a strong correlation of 85% with the stocks of its offshore driller
customers. However, that correlation has weakened, particularly since 2009. There could be any number of reasons
for this, but I think it is largely linked to two things: 1) strong land rig orders in 2010 and 2011, representing
strength in NOV’s business unrelated to its offshore customers and 2) the aforementioned Petrobras tender, which,
although for floaters, was its own separate beast.
One could argue that, with land rig demand more moderate (land rig business was 14% of backlog in 2010 and 2011
but has now settled in at a more normalized 7%) and the orders related to the Petrobras tender already booked, the
stock will re-correlate more closely to those of its offshore customers. Playing catch up with offshore drillers would
pressure NOV and I think the outlook for offshore drillers is challenging as well.
Year SDRL RIG ESV NE DO ATW ORIG PACD RDC HERO Drillers
2000 0.60 0.64 0.65 0.59 ‐0.31 0.36 0.61
2001 0.93 0.97 0.97 0.98 0.96 0.97 0.98
2002 0.71 0.91 0.93 0.69 0.77 0.88 0.90
2003 0.67 0.46 0.20 0.67 0.62 ‐0.23 0.49
2004 0.85 0.78 0.81 0.83 0.92 0.73 0.86
2005 0.90 0.85 0.92 0.90 0.88 0.91 0.64 0.94
2006 0.04 0.47 0.61 0.59 0.58 0.42 0.65 0.47 0.57
2007 0.90 0.79 0.45 0.93 0.93 0.94 0.66 ‐0.19 0.87
2008 0.97 0.94 0.97 0.98 0.95 0.95 0.97 0.96 0.97
2009 0.96 0.94 0.94 0.96 0.96 0.97 0.93 0.69 0.97
2010 0.92 0.26 0.86 0.22 0.04 0.69 0.78 0.01 0.55
2011 0.81 0.60 0.82 0.76 0.78 0.89 ‐0.15 0.17 0.78 0.61 0.73
2012 0.41 0.66 0.48 0.78 0.39 0.70 0.70 0.79 0.80 0.42 0.68
2013 0.85 ‐0.22 ‐0.05 0.20 ‐0.71 0.39 0.83 0.87 0.59 ‐0.16 0.57
2014 0.63 0.59 0.78 0.68 0.61 0.77 0.77 0.77 0.81 0.63 0.69
Since 2000 0.87 0.64 0.91 0.85 0.84 0.97 0.65 0.77 0.74 ‐0.28 0.85
NOV Correlation
23. Ed McCabe
917-902-6814
efmccabe15@hotmail.com
March 13, 2014 23
CUSTOMER CONFERENCE CALL EXCERPTS
Seadrill CEO, Peter Wullf:
“The short-term outlook for floaters is influenced by the low activity level caused by reduced growth and cut back in
CapEx from the major oil companies. In this regard, 2014 and 2015 show slower growth in activity levels than
earlier anticipated. As oil companies’ budgets are re-allocated, the entire spending complex tends to slow down. In
turn, demand for offshore drilling assets is being pushed into 2015 and 2016, but importantly this downturn is not
driven by a declining oil price, the prior cycles for long downturn have been caused by deteriorating hydrocarbon
supply and demand fundamentals…”
“In terms of how the industry is reacting to this pause is activity – inactivity we have seen a 2016 new build order
book develop into one of the lightest delivery years in recent memory. This is potentially creating an undersupplied
market in years to come. And I want to give you a few bullets there. The current production in ultra-deep water
regions is roughly 1 million barrels a day as we speak. It is expected by 2020 production in these regions will
approach 5 million barrels, and this is approximately 30% [inaudible] annual growth ratio represent one of the
strongest production growth profiles globally. Although the current environment for ultra-deepwater floaters is
challenging we are confident in the long-term fundamentals in the ultra-deepwater.”
“Based on the fact that this pause in spending has not been caused by oil price declines, give us confidence that this
is a momentary pause, rather than a cyclical downturn. Based on the number of inquiries for 2015 availability, we
have some degree of visibility that the projects not funded in 2014 have been pushed to 2015 and 2016.
The medium and long-term supply demand fundamentals are intact, and new build activity has slowed down
considerably, thus creating a potential on the supply situation in 2016 and onwards.”
Transocean CEO, Steven Newman:
“As we have regularly reminded folks, offshore drilling is a cyclical business. At this point, while commodity prices
remain robust, there is a near-term increase in the supply of drilling rigs concurrent with late demand for rig capacity
on the part of our customers.”
“As you know, drilling contractors cannot create demand. That said, we have all been through cycles before and I
have not observed anything about the recent market conditions that causes me to question the favorable long-term
fundamentals for our business.”
“I would also like to reemphasize the prevailing market conditions, have the potential to have an adverse impact on
our near-term utilization.”
Transocean Senior Vice President of Marketing, Terry Bonno:
“As many of you are aware, we have been discussing the gradually deteriorating market trends for the last nine
months or so. And unfortunately, the market is behaving as we predicted.”
“I currently think that this pause looks similar to that observed in 2002 to 2004, a period characterized by the initial
decrease in demand with the markets remaining stagnant over a period of 18 to 24 months, weak deepwater and
midwater markets as we’re already seeing, customers delaying programs and an increase in sublet activity. While
these characteristics are certainly similar to the market we see today, we expect year-on-year demand to continue to
grow assuming as we and our customers do that commodity pricing remains healthy.”
“While there is little question that the near-term market is challenging, we have a solid backlog foundation of $27
billion that provides comfort and financial flexibility as we bridge this cyclical pause.”
“Rate expectations for high specification ultra-deepwater units have shifted downwards from the previous quarter to
around 500,000 per day to 550,000 per day depending on area of operation and duration of the contract.”
24. Ed McCabe
917-902-6814
efmccabe15@hotmail.com
March 13, 2014 24
“While we are in active discussions with our customers on several deepwater floaters available in 2014, we expect to
see some idle time between contracts for these floaters in the near-term.”
“…we do fully appreciate the near-term softness and the fact that we’ve got a lion’s share of the availability. I mean,
if you look at certainly the ultra-deepwater space alone, we've got 12 of the 38 that are out there available. So we're
focused on all the opportunities that are out there. We’re going to be fighting for work. Again, the issue as Steven
said earlier is that we can’t create demand. And so again, we are concerned but like I said we’re going to do
everything we can to get these rigs play.”
Ensco Senior Vice President of Marketing, David Hensel:
“While we have seen some floaters go idle recently, this appeared to have more to do with the supply of new rigs
coming into the market, as well as customers letting rigs go early due to lack of success, OGX's bankruptcy in Brazil
and delays in receiving regulatory approvals.”
“The newbuild order book for competitive jackups shows 32 to be delivered into the market by year end 2014, of
which 24 are uncontracted. As Dan mentioned, customer demand remains healthy. And the pressure on current
market conditions is more supply related, which we believe will be more of a short-term issue, especially, as we see
a pickup in the number of older jackups and floaters being retired.”
“Regarding the worldwide order book for floating rigs, we count 27 competitive new rigs to be delivered before the
end of 2014, of which 13 are uncontracted. We believe that approximately 5 of these rigs are in discussions with
operators and could be committed at this time.”
Noble Corporation Senior Vice President of Marketing and Contracts, Roger Hunt:
“…looking at the ultra-deepwater segment, the market seems to be in a period of absorbing this significant increase
in rig count to prosecute exploration and development programs sanctioned over the past 3 years. On a relative
basis, tendering activity is less today than 12 months ago.”
“Today, we count 38 rigs that are either scheduled to be delivered from the yard and do not have a contract or are
rolling off an existing going contract.”
“Maybe an appropriate way to paraphrase the current state of the offshore industry is to define it as entering a
cyclical pause. We know that past, more pronounced disruptions in the offshore cycle have been caused in many
instances by a decline in client exploration and production spending, resulting from a deteriorating long-term
outlook for crude oil prices, which led to a reduction in customer rig needs.”
“We did not sense declining crude oil prices are as much of a client concern today as are increasing spread costs and
flat production curves. Upstream spending is continuing to grow in 2014, but the pace of spending is expected to be
slower than the heated pace set over the past 3 years, which set an inflationary environment into motion.”
“We would argue a cyclical pause is a necessary phase of the cycle to encourage a cooling off period, especially as it
pertains to costs for labor and the various stresses associated with the offshore drilling supply chain, allowing
pressures on our drilling margins to subside.”
“…our customers really have had an extraordinary increase in activity over the past 3 years. And so when you look
at that growth rate relative to what it's going to take to keep full employment, it's greater. So I think there really is an
execution phase that's going on right now where the customers are trying to swallow the proverbial pig. Now the
backdrop is good commodity prices, great exploration success that are going into the hoppers of opportunities.”
“And yes, there's been some balance sheet and some poor quarterly results year-on-year. So I think you throw all
that into the mix, it's resulting in this pause that we're speaking to, particularly at the high end and the ultra-
deepwater. We still believe in the fundamentals.”
25. Ed McCabe
917-902-6814
efmccabe15@hotmail.com
March 13, 2014 25
Noble Corporation CEO, David Williams:
“…regardless of the duration of the cyclical pause in offshore activity, we remain confident in the long-term outlook
for the business.”
“It's easy to get lost in the short-term outlook, which is shaping up to be more challenging at least during the first
half of 2014. But as Roger touched on, our business remains fundamentally sound over the longer term. Crude oil
prices continue to display real stability.”
“A strong case can be made that our business will experience a stronger up cycle than before when given a chance to
pause and allow the various participants in the industry to consider their next moves.”
“…I think the takeaway on where we see today, we've acknowledged what everybody's been talking about, is some
squishiness, I guess, in the deepwater…”
Diamond Offshore CEO, Lawrence Dickerson:
“Clearly, the ultra-deepwater market reflects some concern over the supply-demand balance for 2014. Dayrates have
been under some pressure after what has been a prolonged period of market strength. We're seeing more prospective
contracts in the range of 2 to 4 years and for 5-year opportunity.”
Rowan Executive Vice President of Business Development, Mark Keller:
“The industry seems a little bit anxious about the recent plateau. With the current supply of 515 jack-ups and 137
more under construction, the big question remains will the market be oversupplied in the coming years. After careful
analysis of the current market and the newbuild units, we are confident in our position in the jack-up market. It all
comes down to the quality of our fleet, the quality of our people and the strength of our customer base.”
Atwood Oceanics CEO, Robert Saltiel:
“We are aware that some of our competitors have uncontracted 2014 newbuild capacity that may put some near-term
pressure on day rates, along with some contract rollovers of less capable, ultra-deepwater rigs.”
“The visibility in the floater segment has become less certain since our last earnings call. The combination of a
slowdown in announced fixtures near-term, uncontracted newbuild capacity and a significant number of pending
deepwater and ultra-deepwater rig contract rollovers has clouded our 12- to 18-month outlook. Adding to this has
been a handful of unsuccessful appraisals of previous discoveries and a nearly universal call by E&P operators to
improve cash returns and cost discipline in the wake of rising costs and low realized returns. We've also seen the
operators delay or cancel drilling programs that had been expected to occur this year, which has pushed floater
demand to the right. As a result, we've seen a number of our competitors' rigs go idle in the past 3 months, and more
are likely to do so in the months ahead.”
“Turning briefly to the jack-up segment. We continue to see high specification jack-up rates and utilization holding
up quite well. However, given the number of jack-ups under construction that are still available for contract, we do
remain a bit cautious as to the effect this could have on rate to utilization going forward.”
“…we do believe that any downturn that we may be facing is probably bracketed around 12 to 18 months. A lot of
that is because the real challenges for the market look to be over the next 6 to 12 months. And we are already
starting to see some rigs getting idled in the marketplace. At the same time, we're really not seeing a decrease in
demand. What we're seeing is an absence of demand increase to account for the continuing flow of newbuilds into
the marketplace. So this is certainly not like past downturns, certainly at this point, where you see demand fall off, at
the same time, supply is rising. This is more about a stagnant demand met by rising supply. And I think that the
market has spoken pretty clearly about its preference for higher-specification, ultra-deepwater rigs, similar to the A-
class drillships that we're building. We fully expect that lower-class -- lower-specification, older ultra-deepwater rigs
will increasingly be idled to the extent that demand doesn't keep up with the rising supply. But we really think that
the bulk of the pain will probably occur over the next 12 months or so.”
26. Ed McCabe
917-902-6814
efmccabe15@hotmail.com
March 13, 2014 26
“…we recognize that there are going to be some headwinds in the short-term and we're going to weather our way
through that. 2014 is likely to be a soft year, but when you put the kind of backlog on that we did in 2013, getting
some key extensions on both our floater fleet, as well as our jack-up fleet, and in addition, I think the positioning of
our deepwater rigs, where we have 2 of those in Australia which, as I said on the last call, is an area of competitive
advantage for Atwood, I think we're very well-positioned to get through this. And as much as you never like to see
the market turn down, I can't imagine us being in any better positioned for this potential downturn than we are
today.”
“Well, I think you have seen it across the board. I mean, if you -- if you listen in on some of our customers'
comments in their public statements and their own quarterly earnings calls, there's lot of talk about they're making
hard choices about being focused on cost discipline, about improving returns, improving cash performance. There
are a lot of different ways that people say it, but when you get that kind of a conservatism creep into the
marketplace, as a matter of fact, you will just get fewer wells drilled and people will be a bit more particular about
their -- the well programs and the timing for those. My own personal view is that these things tend to be temporal.”
“Well, I think a couple of things. One is, I do believe that 2015 will see a pickup in demand because I think a lot of
things in 2014 have been pushed to the right, as opposed to being taken off the table completely. So that's one thing.
I think the second thing is rigs will leave this market on a more permanent basis as we move through 2014, if it
doesn't improve. So the discussion, again, around cold-stacking, you will see cold stacking of rigs if this market
doesn't pick up. And I think the -- both the supply end and the increase in demand will help improve prospects for
2015 outlook.”
Ocean Rig Vice President of Marketing and Contracts, Michael Nielsen:
“Historically, the floater market consisting of midwater, deepwater and ultra-deepwater rigs has experienced upturn
and downturn cycles as illustrated above. Each downturn cycle has had a duration of 12 to 18 months and was
followed by an extended upturn period.”
“The relatively high number of ultra-deepwater units currently being offered on sublet terms worldwide is creating
additional competition, in particular, for those ultra-deepwater newbuildings being delivered in 2014 without
contracts.”
“In the short term, the demand picture will remain muddy and the average lead time from contract award to startup
of drilling programs will be reduced to about 6 months compared to about 24 months 1 year ago.”
Ocean Rig CEO, George Economou:
“Recently, there has been some softness in the market as a result of several drilling units coming off-contract and
certain newbuildings without contract scheduled for delivery in 2014. We believe that these market conditions will
not last for long, due to the overall obsolescence of the offshore drilling fleet and will not be as deep as current
market consensus expectations would indicate.”
“Well, as we said, we're not going to pick up newbuildings that are speculatively delivering from the yard. The
second-hand market is nonexistent. If there is one, well, certainly we'll look at it.”
Pacific Drilling CEO, Chris Beckett:
“When we look specifically at 2014 on the supply side, of the rigs that we track as potential competitors, we believe
there are about 21 rigs that are available in 2014. But of these about 12 are fifth-generation or older and three are
low spec. And two of them we believe at least are committed.”