SlideShare a Scribd company logo
1 of 81
Download to read offline
INTERNATIONAL MONETARY FUND 
Fiscal Regimes for Extractive Industries: Design and Implementation 
Prepared by the Fiscal Affairs Department 
Approved by Carlo Cottarelli 
August 15, 2012 
Contents Page 
Acronyms and Glossary .............................................................................................................4 
I. Introduction ............................................................................................................................7 
II. Designing and Assessing EI Fiscal Regimes ......................................................................10 
A. Key Tax-Relevant Characteristics of the EIs ..........................................................10 
B. Objectives for Fiscal Regimes for EIs.....................................................................13 
C. Overall Fiscal Schemes for EI .................................................................................15 
D. Fiscal Instruments for EI .........................................................................................18 
E. Understanding Tax Effects on Exploration, Development, and Extraction ............23 
F. Scenario Analysis of Resource Tax Regimes: The FARI Model ............................25 
G. Evaluation of Alternative Fiscal Regimes ..............................................................26 
III. Administration and Transparency ......................................................................................29 
IV. Revenues from EIs .............................................................................................................32 
A. Government Revenues from the EIs .......................................................................32 
B. Effective Tax Rates in Practice ...............................................................................34 
V. Selected Current Issues .......................................................................................................35 
A. Stability and Credibility ..........................................................................................35 
B. International Issues ..................................................................................................37 
C. Taxation and the Granting of Rights .......................................................................38 
Tables 
1. EI Revenue Potential: Selected African Countries ................................................................8 
2. Fiscal Mechanisms in the EI: Evaluation against Key Objectives ......................................16 
3. Fiscal Mechanisms in the EIs: Nature and Prevalence ........................................................22 
4. Primary Government Objective and Relevant Mechanism .................................................28
2 
Figures 
1. Developments in Oil and Copper Prices ..............................................................................11 
2. Oil Price Forecasts and Outturns .........................................................................................11 
3. Composition of Revenue......................................................................................................23 
4. Average Effective Tax Rates for Petroleum and Mining .....................................................27 
5. Petroleum: Government Revenue by Country 2001–10 ......................................................33 
6. Mining: Government Revenue by Country, 2001–10..........................................................33 
7. Mining and Petroleum: Government Revenue by Country, 2001–10 .................................33 
8. Petroleum: Government Revenue, 2001–10 ........................................................................34 
9. Mining: Government Revenue, 2001–10 .............................................................................34 
Boxes 
1. Forms of Production Sharing ...............................................................................................17 
2. Two Leading Forms of Rent Tax .........................................................................................20 
3. EI Fiscal Regimes in Higher-Income Countries ..................................................................24 
Appendices 
I. Key Points from Consultations with Civil Society Organizations (CSOs) 
and EI Companies ...........................................................................................................39 
II. Technical Assistance on Extractive Industry Fiscal Regimes Since 2006 .....................41 
III. Corporate Income Tax Issues of Special Importance for Extractive Industries .............43 
IV. What “Uplift” Rate should be used in Rent Taxes? ........................................................48 
V. Modeling the Impact of Fiscal Regimes on Resource Exploration and Exploitation .....49 
VI. FARI Appraisal of Different Rent Tax Mechanisms ......................................................50 
VII. Further Aspects of Effective EI Tax Administration ......................................................65 
VIII. Revenue Data Used in this Paper ....................................................................................68 
IX. Improving Data on Government Revenues from Natural Resources .............................70 
X. Estimating Effective Tax Rates for EI Companies .........................................................72 
Appendix Tables 
1. Objectives and Measurable Indicators .................................................................................50 
2. Petroleum Fiscal Regimes ....................................................................................................52 
3. Project Examples .................................................................................................................54 
4. Results with Oil Price Uncertainty ......................................................................................55 
5. Mining Fiscal Regimes Evaluated .......................................................................................61 
6. Gold Project Example ..........................................................................................................61 
7. Results with Gold Price Uncertainty ....................................................................................64 
8. Countries in the Sample .......................................................................................................68 
9. Illustrative Calculations of the IETR for Mining .................................................................74 
10. Illustrative Calculations of the IETR for Petroleum ..........................................................75
3 
Appendix Figures 
1. TA on Natural Resources Taxation by Sector, FY06–12 ....................................................41 
2. Numbers of Missions and Other Activities by Year, FY06–12 ...........................................42 
3. Evaluation of Petroleum Fiscal Mechanisms: Deterministic/Success Case Economics .....53 
4. Results with Oil Price Uncertainty ......................................................................................55 
5. EMV Analysis for 290 Million Barrel Oil Project ...............................................................58 
6. Evaluation of Mining Mechanisms ......................................................................................63 
7. Expected AETR with Gold Price Uncertainty .....................................................................64 
8. Distribution of AETRs for Petroleum Companies ...............................................................76 
Appendix Box 
1. Expected Monetary Value for Exploration Decisions .........................................................57 
References ................................................................................................................................78
4 
ACRONYMS AND GLOSSARY 
ACE Allowance for Corporate Equity (for tax purposes) 
ACC Allowance for Corporate Capital (for tax purposes) 
Advance Pricing 
Agreement 
Agreement between tax authority and taxpayer as to method by which 
anticipated transactions will be valued for transfer pricing purposes 
AEO Annual Energy Outlook, US Department of Energy 
AETR Average Effective Tax Rate 
bl barrel 
BOE Barrels of Oil Equivalent (measurement unit for both oil and gas) 
Bonus Lump sum payment made for mineral (oil, gas, or mining) rights, or at 
contract signature, or at certain production thresholds 
Biddable Item that is open for bidding in auctions 
Booking of reserves Entering reserves in calculating the asset value of a company for stock 
exchange purposes 
Carried interest 
A participating interest in a project where the holder does not pay a 
commercial price for the interest or whose obligations are contributed 
(“carried”) in part by other parties 
CIT Corporate Income Tax 
Cost oil Portion of total production allowed for recovery of costs 
DROP Daily rate of production (a scaling method for sharing profit oil or gas) 
Fracking Hydraulic fracturing (injection of water, sand, and chemicals to 
fracture shale so that oil or gas can flow ) 
GAAP Generally Accepted Accounting Principles 
EI Extractive Industries 
EITI Extractive Industries Transparency Initiative 
EMV Expected Monetary Value 
FARI Fiscal Analysis of Resource Industries (FAD modeling system) 
Free equity Shares in a mining company allocated to a state entity for nil 
consideration (in practice often accompanied by tax concessions, or 
contribution of rights or infrastructure, and hence not strictly “free”) 
Gold plating Incurring costs beyond the minimum needed 
IETR Incremental Effective Tax Rate (Appendix X) 
LNG Liquefied Natural Gas (methane super-refrigerated to store and 
transport as liquid) 
LTBR Long-Term Bond Rate 
LTO Large Taxpayers Office 
MM Petroleum industry conventional term for “million” 
METR Marginal Effective Tax Rate 
NEIC National Extractive Industries Company 
NOC National Oil Company 
NPV (x) Net Present Value (at discount rate of x)
5 
Petroleum Crude oil and natural gas 
Production Sharing Fiscal scheme for petroleum in which production at a surface delivery 
point is shared between a state entity and a private contractor 
PSC (or A) Production Sharing Contract (or Agreement) 
PRRT Petroleum Resource Rent Tax 
Profit oil Balance of production after subtraction of oil used for cost recovery 
Quasi-rents Rents attributable to past investments, or to factors of production in 
temporarily fixed supply 
Rents Revenues in excess of all necessary costs of production including the 
minimum rate of return to capital (sometimes “super-normal profits”) 
Ring Fence Fiscal boundary within which costs and revenues of companies in 
common ownership may be consolidated for tax purposes 
ROR Rate of Return 
Royalty Charge for the fact of extracting minerals, usually now ad valorem (a 
percentage of gross revenues), but can be a specific charge by volume 
or weight. May also vary with price. Term also used in “net profits 
royalty” where some costs are deducted, in which case similar to an 
income or rent tax. 
Henry Proposal A uniform resource rent tax…[using] an allowance for corporate 
capital system (Australia, Henry Report, 2010) 
Shale A compacted sedimentary host rock for unconventional oil or gas; its 
low permeability requires fracking for extraction 
SOE State-Owned Enterprise 
TA Technical Assistance 
Thin Capitalization Extensive use of debt, relative to equity, in financing a project or firm 
Treaty shopping Use of treaty networks to reduce total tax liability 
UJV Unincorporated joint venture (two or more companies acting together 
with undivided participating interests in a project; not the same legally 
as a partnership) 
Uplift Addition for tax deduction or cost recovery purposes to the cost of 
capital assets or of losses carried forward (the former sometimes 
“investment allowance,” the latter sometimes “accumulation rate”) 
VAT Value Added Tax 
VIT Variable Income Tax 
WACC Weighted Average Cost of Capital 
WEO IMF World Economic Outlook 
WHT Withholding tax 
WTI West Texas Intermediate (US oil price benchmark)
6 
EXECUTIVE SUMMARY 
This paper suggests ways better to realize the revenue potential of extractive industries 
(EI—oil, gas, and mining), particularly in developing countries. This has become an 
increasingly important topic of IMF policy advice and technical assistance (TA), with recent 
discoveries in many developing countries lending it a new urgency. The paper sets out the 
analytical framework underpinning, and key elements of, the country-specific advice given. 
Revenues from the EI have major macroeconomic implications. The EIs often account 
for over half of government revenue in petroleum-rich countries, and for over 20 percent in 
mining countries. Dependence on EI revenues in resource-rich countries—now about one-third 
of the Fund’s membership—has increased, and this seems set to continue. 
Revenue objectives loom large in designing fiscal regimes for the EIs, but involve 
complex trade-offs. Generating employment in related activities, and addressing 
environmental impacts, can be significant concerns, but the revenue from the EIs is often the 
main benefit to the host country. It is the prospect of substantial rents—returns in excess of 
the minimum required by the investor, arising from relative fixity of supply of the underlying 
resource—that makes the EIs especially attractive as a potential source of revenue. 
Fiscal regimes for the EIs vary greatly, a wide range of instruments being used. The 
paper attempts to gauge how current regimes share rents between government and investor. 
Data analyzed here suggest that in mining, governments commonly retain one-third or rather 
more; simulations suggest higher government shares (40–60 percent), but do not capture all 
possible sources of revenue erosion. They also suggest that the government share is higher in 
petroleum:1 around 65–85 percent. Fiscal regimes that raise less than these benchmark 
averages may be cause for concern, or—where agreements cannot reasonably be changed— 
regret. 
Country circumstances require tailored advice, but a regime combining a royalty and a 
tax targeted explicitly on rents (along with the standard corporate income tax) has 
appeal for many developing countries. Such a regime ensures that some revenue arises 
from the start of production, and that the government’s revenue rises as rents increase with 
higher commodity prices or lower costs; in so doing, it can also enhance the stability and 
credibility of the fiscal regime (though processes to allow renegotiation may also be needed). 
It can also balance the challenges that each instrument poses for administration. Transparent 
rules and contracts tend to improve stability and credibility. Poorly designed international tax 
arrangements, however, can seriously undermine revenue potential. 
Effective administration is vital, but complex EI fiscal regimes and fragmented 
responsibilities are often major impediments. Royalties need not be as easy to administer, 
nor rent taxes so hard, as is sometimes believed. 
1 Italics are used on the first occurrence of terms included in the Glossary at the start of the paper.
7 
I. INTRODUCTION 
1. This paper2 considers how best to realize the revenue potential of the extractive 
industries (EI—oil, gas, and mining), particularly in developing countries.3 Designing 
and implementing upstream fiscal regimes for the EIs—mining and petroleum (oil and 
gas)—is now a major focus of IMF policy support and technical assistance (TA; 
Appendix II).4 The aim here is to set out the conceptual approach and outline the techniques 
that guide staff advice.5 
2. Amplifying the already considerable macroeconomic significance of EI, recent 
and prospective discoveries make designing and implementing EI fiscal regimes a key 
challenge—and opportunity—for many developing countries. These issues are important 
in G20 countries too, but it is in developing countries that the challenges are least familiar 
and most important for overall fiscal and wider performance. Appendix II describes the 
extent and growth of IMF TA on EI tax policy. 
3. Large new developments, notably in oil, gas, and iron ore, are underway in 
several low-income countries (LICs) (Table 1). This trend seems likely to continue, as 
strong commodity prices continue to drive increased exploration and discoveries. New 
sources, such as shale gas (and other unconventional petroleum resources), offer 
opportunities in a range of countries, and new materials require expanding rare minerals 
production. Large volumes of resources likely remain to be discovered. Estimates from the 
Wealth of Nations database (World Bank, 2006 and 2010) indicate that the value of known 
subsoil assets per square kilometer of sub-Saharan Africa is barely one-quarter that for high-income 
countries. In recent years, proven reserves worldwide have increased while extraction 
rates have accelerated. No doubt most of this is due to technological change and high prices. 
Nevertheless, fiscal regimes seem to play a role: for example, fiscal regime revisions from 
1991 onwards seem to have had a major role in expanding exploration and production in 
Angola’s deep water prospects. 
2 The paper has benefited from consultation meetings with civil society and EI companies, and from an open 
call for comments: Appendix I summarizes the views expressed; submissions received are at 
http://www.imf.org/external/np/exr/consult/2012/NR/Comments.pdf), 
3 Non-resource related revenues were discussed in a previous IMF policy paper, Revenue Mobilization in 
Developing Countries (http://www.imf.org/external/np/pp/eng/2011/030811.pdf) and other fiscal aspects of the 
management of resource wealth are addressed in the companion paper, Macroeconomic Policy Frameworks for 
Resource-Rich Developing Countries ( http://www.imf.org/external/np/pp/eng/2012/082412.pdf). 
4 There are only four or so instances of Fund conditionality in this area over the last twenty years, the most 
recent being a structural benchmark for June 2012 on introducing a mineral resource rent tax in Sierra Leone. 
Conditionality related to EI transparency or auditing EI companies has been more common. 
5 In this, it draws heavily on the recent FAD book, Daniel, Keen, and McPherson (2010).
8 
Table 1. EI Revenue Potential: Selected African Countries 
Country/Project Mineral Investment 
US$bn 
Average annual 
revenue potential 
(US$bn, constant 
2011 dollars; 
percent 2011 GDP) 
Lifespan of 
project(s) 
Ghana, Jubilee 
(Phase 1 only) 
Petroleum $3.15bn $0.85bn; 2.3 21 years 
Guinea, 
Simandou, and 
others 
Iron ore $4bn for mining 
project [with 
additional $6bn in 
railway and port 
infrastructure] 
$1.6bn; 30.7 21 years 
Liberia Iron ore, 
petroleum 
$4.5bn $1.7bn;1 147.8 20–30 years iron 
ore; potential 20+ 
for petroleum (but 
no proven project 
yet) 
Mozambique, 
Rovuma (gas) 
Tete (coal) 
Gas and 
coal 
$20-30bn $3.5bn;1 27.3 30–50 years 
Sierra Leone, 
various 
Iron ore, 
petroleum, 
diamonds 
$4.6bn $0.4bn; 18.2 15 years 
Tanzania Gas, Gold, 
Nickel 
$20-30bn $3.5bn;1 15.0 10–20 years gold 
(remaining in 
existing mines); 
20-30 gas and 
nickel 
Source: IMF staff estimates. 
Note: Estimates are intended to show order of magnitude. Revenue projections are highly sensitive to assumptions about 
prices, phasing of production, and underlying production and capital costs. 
1 Data represent annual revenue at peak production. 
4. Revenue potential from oil is especially substantial. For East Africa, Gelb, Kaiser, 
and Viñuela (2012) estimate exploration and development costs at $6–14 per barrel; applying 
these costs across sub-Saharan Africa as a whole with oil at $80 per barrel, and assuming that 
governments secure 50 percent of the excess of price over cost (and many regimes in the 
region seem likely to capture more), increasing production by 1 million barrels per day 
would increase government revenue in the region annually by about $12 billion, or 1 percent 
of the 2011 GDP of sub-Saharan Africa.6 Angola alone increased production by 1 million 
6 Includes Sudan, now both Sudan and South Sudan.
9 
barrels per day over 2001–11, while more than doubling its proven reserves. Sub-Saharan 
Africa as a whole increased proven reserves by 50 percent over this period (to 68 billion 
barrels), so the increase in daily production over 10 years could well exceed 1 million 
barrels. In iron ore, sub-Saharan Africa has reserves that can provide an estimated 120 years 
of total world supply (out of about 500 available globally).7 If all these reserves could be 
developed, and the government revenue resulting were to be apportioned (improbably) over 
500 years, the annual revenue addition would be about 0.7 percent of the region’s 2011 
GDP.8 
5. Country-level simulations confirm this potential. The interaction of geology, 
prices, fiscal regimes, and technology changes makes accurate forecasting of likely revenue 
additions impossible. Nevertheless, using (admittedly crude) assumptions for sub-Saharan 
Africa, discovery and development of a single additional oil field in each of at least 
18 countries with petroleum potential would add in a year nearly 2 percent of collective GDP 
to the revenue of these countries in the peak production years of these fields. The country by 
country impact differs widely. Natural gas may have similar potential. 
6. The central fiscal issue is ensuring a ‘reasonable’ government share in the rents 
often arising in the EIs. ‘Rents’—the excess of revenues over all costs of production, 
including those of discovery and development, as well as the normal return to capital—are an 
especially attractive tax base as they can, in principle, be taxed at up to 100 percent without 
making the activity privately unprofitable. There are, however, substantial obstacles making 
this effectively impossible—which will be a central concern below. By ‘reasonable’ is meant 
a sharing that at least provides private investors with an adequate incentive to explore, 
develop, and produce; beyond that, views on reasonableness may well differ. 
7. The paper is structured as follows. Section II explores the key features of EI sectors 
that bear on fiscal regime design and then considers the design and assessment of EI fiscal 
regimes; Section III examines revenue administration and transparency; Section IV examines 
what is known (which is too little) about government revenues from EIs; and Section V 
considers some of the most pressing current and emerging issues. Appendices elaborate on 
key technical issues. 
7 Estimate by BHP Billiton, Presentation at the Geological Society of London by Andrew Mackenzie, “Mineral 
Deposits and their Global Strategic Supply,” December 14, 2011. 
8 Staff calculations assuming CIF iron ore price of $107 per ton (current WEO), overall costs of $70 per ton, 
and government share of surplus over costs at 40 percent.
10 
II. DESIGNING AND ASSESSING EI FISCAL REGIMES 
This section outlines the tax-relevant distinctive features of EIs and then the main issues in 
designing and assessing fiscal instruments, both individually and in combination.9 
A. Key Tax-Relevant Characteristics of the EIs 
8. Prominent among these are 
 Potentially sizable rents arise. These are an especially attractive tax base on 
efficiency grounds—and on equity grounds too if, as is often the case, they would 
otherwise accrue to foreigners. 
 Pervasive uncertainty, most obviously but not only on commodity prices, the most 
fundamental difficulty being less their wide variability (Figure 1) than the difficulty 
of predicting them (Figure 2).10 Substantial uncertainty also arises in relation to 
geology, input costs, and political risk (ranging from expropriation to changes in 
future fiscal regimes, including those potentially arising from climate and 
environmental policies). 
 Asymmetric information. Private investors undertaking exploration and development, 
for instance, are likely to be better informed than host governments on technical and 
commercial aspects of a project; the host government will be better informed on its 
own future fiscal intentions. 
 High sunk costs, creating time consistency problems. EI projects commonly involve 
very substantial upfront outlays by investors that cannot be cashed in if the project is 
terminated. The balance of negotiating power thus shifts dramatically from investor to 
host government once these costs are sunk. Even the best-intentioned government has 
an incentive to offer attractive fiscal terms before a project is begun, but afterwards— 
as the tax base becomes much less elastic—reset the regime in its own favor; and 
investors’ awareness of this can discourage investment (the “hold-up” problem), to 
the detriment of both sides. 
 Extensive involvement of multinational enterprises in many countries…raises 
complex tax issues (with multinationals likely more expert than most developing 
country administrations) and sensitivities on sharing the benefits from national 
resources. 
9 These issues are discussed, and valuable materials provided, by the Natural Resource Charter 
(www.naturalresourcecharter.org) and the World Bank-supported Extractive Industries Sourcebook 
(www.eisourcebook.org). 
10 The IMF Research Department has produced numerous studies on the topic in recent years, for example 
Bowman and Husain (2004) and Reichsfeld and Roache (2011).
11 
Figure 1. Developments in Oil and Copper Prices 
140 
130 
120 
110 
100 
90 
80 
70 
60 
50 
40 
30 
20 
10 
0 
Crude oil (real 2011 prices) 
1970 1972 1974 1976 1978 1980 1982 1984 1986 1988 1990 1992 1994 1996 1998 2000 2002 2004 2006 2008 2010 2012 
Source: IMF WEO database. 
11,000 
10,000 
9,000 
8,000 
7,000 
6,000 
5,000 
4,000 
3,000 
2,000 
1,000 
0 
Copper (real 2011 prices) 
1975 1977 1979 1981 1983 1985 1987 1989 1991 1993 1995 1997 1999 2001 2003 2005 2007 2009 2011 
$US per ton 
Figure 2. Oil Price Forecasts and Outturns 
$US per barrel 
140 
120 
100 
80 
60 
40 
20 
0 
U.S. Department of Energy Annual Energy Outlooks (AEO) 1982-2012 
(2010 U.S. Dollar per Barrel) 
AEO 2012 
AEO 2011 
AEO 2010 
AEO 2008 
AEO 2007 
AEO 2001 
AEO 1985 
AEO 1991 
AEO 1995 
AEO 2005 
1970 1975 1980 1985 1990 1995 2000 2005 2010 2015 2020 2025 
US$ per barrel 
145 
135 
125 
115 
105 
95 
85 
75 
65 
55 
45 
35 
25 
15 
WEO Oil price Forecasts 2003-2012 
(Monthly prices, 2010 U.S. Dollar per Barrel) 
Oct 2008 
Sep 2004 
Sep 2011 
Apr 2012 
2002 2003 2004 2005 2006 2007 2008 2009 2010 2011 2012 2013 2014 2015 2016 
US$ per barrel 
Sources: U.S. Department of Energy Outlook (1982, 1985, 1991, 1995, 2000, 2004–08, and 2009–12); and IMF World Economic Outlook 
(2003–12). After Ossowski et al. (2008). 
Note: Solid lines on the left chart are spot West Texas Intermediate (WTI) oil prices; on the right chart are WEO average of WTI and 
Fateh. The dashed lines are price projections. 
Apr 2010 
Sep 2003 
Sep 2005 
Apr 2004 
Apr 2011 
Apr 2008 
Oct 2009 
Apr 2009 
Sept 2006 
Apr 2007 
Apr 2006 
Apr 2005 
Oct 2010
12 
 …and of state-owned enterprises (SOEs) in others, potentially easing asymmetric 
information issues but also raising concerns on the efficiency of operations and 
allocation of taxing responsibilities. 
 Producers may have substantial market power where they control a significant part 
of global deposits. In mining, for example, most internationally traded supplies of 
iron ore are shipped by just three companies; Saudi Arabia is widely viewed as able 
to influence oil prices. 
 Exhaustibility. The importance of the finiteness of petroleum and mineral deposits to 
long-term economic performance and commodity price developments is 
questionable.11 At project level, however, exhaustibility can be a major concern; a key 
opportunity cost of extracting today is the future extraction foregone. 
9. It is the scale and combination of these characteristics that distinguishes EIs. 
Exhaustibility aside, the other features are found elsewhere: pharmaceutical companies, for 
instance, face considerable uncertainty in their research activities, and natural monopoly 
features can create substantial rents in telecoms. But in other sectors, these rarely rise to the 
same level of macroeconomic significance (though it may be that some of the lessons learned 
in taxing EIs will come to be applied to other sectors). 
10. There are important differences between the oil, gas, and mining sectors. 
Exploration is often costly and riskier for petroleum (a deep water well, for instance, can cost 
over US$100 million, and the chance of success in a new basin may be 1 in 20 or less). But 
the risks in the ‘development’ phase (bringing a discovery to extraction), and of failure 
during the extraction phase, may be greater for mining. Mining may also involve greater 
political and environmental risks, being typically based on land rather than offshore,12 and so 
more disruptive of communities. 
11. Commercial structures tend to differ between petroleum and mining. For tax, 
financing, or sometimes technological reasons, unincorporated joint ventures (UJV) have 
been common in petroleum projects, with capital separately provided by the partners and 
production shared. This sets up conflicting interests from which tax authorities can benefit in 
controlling costs. UJVs have been much less common in mining, with major companies 
owning majority stakes in locally-incorporated vehicles. 
12. The EI sectors, especially oil and gas, are entering a period of change. ‘Fracking’, 
(hydraulic fracturing), becoming viable at current prices, enables fuller exploitation of 
onshore unconventional oil and gas, making their extraction more similar to conventional 
11 Proven oil reserves, for instance, have continued to rise despite increasing consumption levels. 
12 There are exceptions, such as offshore diamond dredging in Namibia.
13 
mining. In copper mining, production has continued to accelerate despite declining grades of 
ore mined, as development of new techniques has markedly increased processing efficiency. 
And the transparency agenda is transforming both the openness of many private EI 
companies and what is expected of host governments. 
13. Resource-rich countries differ widely in ways that matter for tax design. Beyond 
the large differences in their reliance (potential and actual) on EI revenues are structural 
differences germane to the choice of fiscal regime. There are differences too in standard (and 
likely appropriate) tax practice between oil, gas, and mining. In some countries, there are 
likely to be only one or a few major projects (such as uranium or niobium in Malawi), 
whereas in others there are many, and the expectation of more to come (as in Iraq). In some 
countries (Guinea, Lao PDR, Sierra Leone, Tanzania), constraints set by past agreements are 
tight for existing projects and change is possible only slowly by mutual agreement; most 
have greater scope in designing regimes for future projects. In some, known deposits will 
soon be fully exploited (oil in Yemen, Bahrain, and Indonesia). Some have strong traditions 
and national sentiments favoring state participation (in Mexico, for instance, this is a 
constitutional constraint, while it is standard in many middle-eastern countries, notably Iraq, 
Kuwait, and Saudi Arabia); others do not. Countries exploiting oil fields spanning borders 
(especially where disputed) face distinct tax issues. Far from least, administrative capacity 
and governance standards differ massively. 
14. Many developing countries have large numbers of artisanal miners—notably for 
gold and precious stones. Historically this was a large sector in Brazil; it is now substantial 
in, for example, Sierra Leone, Suriname, Tanzania, Thailand, and Zambia. Operations have 
often been illegal but encouraged by exchange controls or restrictions on channels of sale for 
minerals. These operations are not considered at length in this paper: the fiscal issues (though 
not environmental, or law and order issues) have more in common with small scale 
agriculture than with large scale mining. Nevertheless, good practice appears to lie in 
attempting to levy royalties by requiring traders to withhold and pay (rather than attempting 
to tax miners directly, except perhaps for a small license fee) and otherwise ensuring that 
consumption taxes are levied and collected in mining areas. 
B. Objectives for Fiscal Regimes for EIs 
15. Though not their only concern, revenue is generally a primary source of 
potential benefit to host countries. Employment creation, directly and in related activities, 
minimizing community disruption, and addressing environmental consequences are also 
common priorities—especially though not only for onshore activities. Many such objectives 
can have implications for fiscal regime design, but the focus here is on core issues of 
revenue-raising. A key objective is thus to maximize the present value of net government 
revenues from EI, an objective best served by taxes explicitly targeted on rents: by definition,
14 
any other tax leads to distortion that reduce those rents, and hence the amount of revenue that 
can be raised. 
16. There are limits to the rate at which rents can be taxed—but little guidance as to 
precisely what a ‘fair’ or ‘reasonable’ sharing might be. Several obstacles to full taxation 
of rents arise. Asymmetric information means that host governments (as principal) generally 
need to forego some rents in order to provide appropriate incentives for better-informed 
producers (their agent).13 Practical difficulties arise in accurately observing revenues and 
costs, and from tax avoidance devices. 
17. Designing a tax on rents also requires careful attention to costs at all stages of 
production, beginning with exploration (including unsuccessful): returns in excess of the 
minimum required after costs have been sunk in exploration and development—sometimes 
called ‘quasi-rents’—cannot be taxed at 100 percent without making the overall venture ex 
ante unprofitable. Tax competition may also play a role: even though the resources 
themselves are immobile, limited availability of technical expertise and specialist equipment 
may limit the number of areas in which exploration and production can take place, so that 
those offering more favorable tax treatment will be favored. Fairness considerations in 
themselves say little about how rents should be shared, though some see an intrinsic right for 
the host government to extract the maximum return from its ownership of natural resources. 
18. The timing of receipts, not just the level, may be important. Where access to 
credit markets is limited—or simply as a result of political myopia—governments may prefer 
revenue to accrue early in the life of a project. On the other hand, willingness to defer 
revenue (through lower royalties, or accelerated depreciation, or greater reliance on rent 
taxes) may reduce perceived risk to investors and thus the expected return they require before 
deciding to explore or develop. 
19. Efficient risk-sharing between government and investor may limit the value of 
‘progressivity’ in EI fiscal regimes for some developing countries… The ‘progressivity’ 
of a fiscal regime—meaning, roughly speaking,14 the extent to which revenue increases as the 
price of the commodity rises or production costs fall—shapes the sharing of risk between the 
two sides. Efficiency requires that more risk be borne by the party better able to bear it. In 
developing country contexts, this may often be private investors, given their ability to 
diversify across deposits (though the exposure of even large multinationals to single large 
projects should not be underestimated). This calls for fiscal regimes that are not especially 
13 Suppose, for instance, that only producers know whether extraction costs will be high or low. Then a fiscal 
regime which left no rents when these costs are low would mean that no producer could make a profit when 
they are high—even though such a project might yield large pre-tax rents and so be socially desirable. 
14 The term is used very imprecisely in discussions of resource taxation. One might also define it, for instance, 
in terms of how the present value (PV) of taxes varies with the lifetime PV of a project.
15 
responsive to commodity prices, so that the investor gains most of the upside while the 
government is protected on the downside.15 
20. …but this may conflict with a desire for revenues to increase with current prices. 
Limited progressivity also means that revenues increase less when commodity prices (or 
project returns) are high, which can cause incumbents political difficulty. By the same token, 
progressive regimes, being more politically robust, may be more credible.16 The more diverse 
a country’s portfolio of projects, moreover, the less strong is the risk-sharing argument 
against progressivity. 
21. Ease of administration (for the authorities) and compliance (for taxpayers) are 
ubiquitous concerns—just as in all areas of taxation. 
22. Governments differ in the relative importance attached to these objectives. 
Those hosting many projects, for instance, or with strong credit market access, may care less 
about ensuring early payment by each in isolation. Those with ready access to alternative 
sources of revenue may be less concerned by risk-sharing. Political pressures to show 
acceptable revenue from national assets, acceptably responsive to current prices, can be 
powerful. Table 2 summarizes these potential government objectives as criteria against which 
to evaluate the individual fiscal devices set out in Section II.D. 
C. Overall Fiscal Schemes for EI 
23. There are two main approaches to fiscal regime design for EI: contractual 
schemes (including production sharing or service contracts), and tax/royalty systems 
with licensing of areas. The latter dominates in mining; for oil and gas, both are common; 
and some countries use a hybrid. A third possibility is for payment largely as the construction 
of physical infrastructure; such packages are now mainly associated with investment from 
China, but were also a feature of investment from Europe in the 1970s. In all cases, the 
overall framework can be combined with state participation. It is possible to design economic 
terms that are equivalent under alternative approaches (Daniel, 1995), but these likely imply 
different structures of operational control. 
24. The apparent contrast between the two broad schemes is deceptive. Case-by-case 
negotiation is possible under either and not just under contractual systems. Tax and royalty 
schemes prevailed historically since resource owners (private or public, and if public 
sometimes sub-national) charged specific or ad valorem royalties, with the remaining 
15 Such an arrangement also limits the macroeconomic challenges of managing volatile revenue flows. 
16 Boadway and Keen (2010) set out a simple model of political economy in which this is the case; Nellor and 
Robinson (1984) provide an early argument to the same effect. Stroebel and van Benthem (2010) explore, 
theoretically and empirically, the link between contract structure and expropriation risk, finding, for instance, 
that (in the present terminology, and consistent with the thrust of the argument here) regimes are more 
progressive in price the lower are the costs incurred by an expropriating government.
16 
Table 2. Fiscal Mechanisms in the EI: Evaluation against Key Objectives 
Bonus Royalty Sliding-scale Royalty Resource Rent Tax CIT and VIT State Participation 
Maximize government 
NPV: 
All risk onto investor, 
hence lowest expected 
government revenue. 
But, early revenue. 
Useful bidding 
mechanism to mop up 
expected rent. 
Deters some projects 
and fails to capture 
upside from projects 
that go ahead. 
Different effect on 
different projects; likely 
deterrent to low 
grade/high cost projects. 
Captures higher 
expected NPV for the 
government in return for 
government taking on 
more risk. 
Relatively neutral and 
progressive. 
Vulnerability to thin 
capitalization. 
If fully non-concessional 
(Brown Tax) would 
maximize government 
expected revenue in 
return for taking on equal 
share of risk. However, 
usually some 
concessional element, 
hence distortions. 
Progressivity when 
higher returns result 
from price. 
No response: 
regressive (bonus 
reflects expected, not 
actual prices). 
Regressive: 
government share of 
profit falls as 
commodity prices rise. 
Different effect (share of 
profit) on different 
projects. 
Effectively captures 
upside; but higher 
share maybe deferred. 
Reduces burden for low 
prices. 
Instant VIT response to 
profitability changes. 
Free equity is regressive 
(as is dividend 
withholding tax (DWT)); 
carried equity 
progressive. 
Progressivity when 
higher returns result 
from lower costs. 
No response: 
regressive. 
Does not respond: 
regressive. 
Does not respond: 
regressive. 
Captures upside 
however caused. 
Automatically lowers 
burden on high cost 
projects. 
Instant VIT response to 
cost changes. 
Free equity is regressive; 
carried equity 
progressive. 
Neutrality—avoid 
distorting investment 
and operating decisions 
(and thereby dissipate 
revenue potential). 
Impact on exploration 
decisions; no impact on 
development or 
operating decisions. 
Risks deterring 
marginal projects and 
shortening life/ reducing 
production of viable 
projects. 
Different effect on 
different projects, hence 
distortions. 
High risk that parameters 
mis -specified. 
Neutral: share is only 
paid by projects that 
actually exceed 
minimum return. 
Depends on parameter 
design. Potential 
distortion in VIT from 
depreciation (step-change 
in rate). 
Free/carried equity has 
negative impact on 
exploration decisions. 
Ensure adequate 
incentives for 
investment. 
Increases exploration 
risk, but relatively 
neutral if part of 
competitive bid. 
Deterrent if too high; 
increased risk of 
unviable projects. 
Depends on parameters. 
Reduces investor upside: 
likely deterrent. 
Modest deterrent as 
long as sufficient upside 
left with investor. 
Effective as long as 
maximum rate is not set 
too high. 
Perceived negatively by 
investors unless fully non-concessional; 
but some 
risk mitigation benefits. 
Risk to government. Minimizes government 
risk, 
Risk onto investor. Risk onto investor. Risk (of no revenue, or 
only late in life) onto 
government. 
Government taking on 
risk if minimum VIT rate 
is below CIT rate. 
Depends on terms: free 
equity acts like a DWT— 
low risk; carried equity 
like a RRT—higher risk. 
Minimize administrative 
burden and risks. 
Simple to administer; Relatively simple 
calculations, but 
measurement, and 
valuation risks. 
Complex: requires 
multiple parameters for 
each mineral. 
Net margin royalty 
requires definition of 
margin. 
Relatively simple. Same 
data as required for 
income tax. Simple 
additional calculation 
(for cash flow RRT). 
Same data for VIT as 
required for CIT. Simple 
additional calculation of 
rate. 
Complex. Leads to 
pressure for negotiation at 
expense of other fiscal 
elements.
17 
business income from EI subject otherwise to normal business taxation. Most European and 
North American jurisdictions continued this pattern while introducing more targeted taxation 
of resource rents. In the developing world, however, the desire for public expression of full 
sovereignty over resources led to development of contractual schemes: fee-for-service 
contracts where existing industries were fully nationalized, and production-sharing where 
governments desired still to attract private investment (Indonesia was the pioneer of this 
scheme in the mid-1960s). Contractual schemes commonly developed where national oil 
companies (NOCs) were granted an effective monopoly of rights to resources in the ground, 
with the right to make contracts with foreign providers of investment and services. 
25. Under production sharing contracts (PSC), common in petroleum, a contractor 
recovers costs by retaining some of the physical product as ‘cost oil/gas’ and the 
remaining ‘profit oil/gas’ is shared with the government. Box 1 describes the leading 
variants that are sometimes made with the aim of increasing the government’s profit share on 
more profitable projects. 
Box 1. Forms of Production Sharing 
Daily Rate of 
Production (DROP) 
Government share of profit petroleum increases with the daily rate of production from 
the field or license, often with several tiers. Weaknesses are that field size is often a poor 
proxy for profitability and the mechanism is not progressive with respect to oil prices or 
costs. Attempts have been made to blend this with a scale of prices. 
Cumulative 
production from 
project 
Government share of profit petroleum as total cumulative production increases—again 
an inaccurate proxy for the contractor’s rate of return. Such schemes are becoming rarer. 
‘R-Factor’ Government’s profit share increases with the ratio of contractor’s cumulative revenues 
to contractor’s cumulative costs (the ‘R factor’). This improves on DROP in being a 
more direct measure of profitability, but does not recognize the time value of money 
(Box 2). 
Rate of Return 
(ROR) 
This is a form of rent tax (provided that exploration is part of costs) under which the 
government’s share is set by reference to the cumulative contractor rate of return, no tax 
being levied if that falls short of some benchmark rate. Single or multiple tiers are used, 
though staff analysis suggests a single tier is effective. 
26. Staff advice works within both systems, emphasizing design to achieve fiscal 
efficiency and regime transparency in either case. The choice of overall framework will 
be determined, at least in part, by institutions and tradition, and by non-financial objectives. 
Companies also work within both schemes, though major oil companies tend not to favor 
contractual forms unless these permit “booking” of reserves under stock exchange rules. 
Some companies have preferred the PSC because it fills legal gaps and provides one 
comprehensive document covering operations; that though is equally achievable with a 
petroleum agreement under a tax and royalty system.
18 
27. The renewed popularity in developing countries of resource investments coupled 
with infrastructure contributions presents different challenges. In principle, these are not 
complex: they require a cost-benefit analysis of whether the infrastructure contributions, 
when valued with risk apportioned, offer a payment for resources that is equivalent to the 
likely take from any foregone royalty or tax, and if not whether the mode of infrastructure 
delivery provides offsetting benefits. Arriving at such an assurance, however, is in practice 
difficult. 
D. Fiscal Instruments for EI 
28. Within these broad approaches, a wide range of instruments is used. This 
subsection considers each from a design perspective; implications for administration and 
compliance are addressed in Section III. 
29. Bonus payments (signature, discovery, and production bonuses)—can be part of 
any fiscal scheme. Bonuses are single (or sometimes staged) lump sum payments triggered 
by events; they can be set in legislation or negotiated, and could be biddable. Bonuses in 
some petroleum exploration rights auctions have been very large (over $1 billion as a top bid 
in Angola’s 2006 round) but are much more modest, for example, in the USA’s offshore 
auctions. Signature bonuses become a sunk cost for companies that they may recover only in 
the event of successful development, and even then the fact that they are sunk may pose new 
political risk if a project is especially profitable. 
30. Royalties on gross revenues17 have the attraction of providing government 
revenue from the start of production. But, since they are a simple addition to cost, they can 
make the extraction of some resource deposits unviable. They are an implicit depletion policy 
(since the range of feasible projects is narrowed) and an invitation to negotiate. Where 
royalties form a major part of the overall fiscal regime, they tend to become more complex 
because refinements are needed to make them responsive to profitability (using proxy 
measures like price, location, or production level). Royalty rates that vary with price have 
easy appeal but, by definition, do not vary with costs and so will not be appropriate across 
the marginal cost curve of possible mines; moreover, any rate scale geared to prices requires 
frequent adjustment when forecasts are wrong.18 
31. Royalties can be rationalized as correcting for possible overexploitation, but the 
practical importance of this is unclear. For instance, the interest of a firm will be 
misaligned with the social interest if it receives no payment for resources left in the ground at 
17 Otto et al. (2006) provide a detailed account of issues and experiences with royalties. Royalties as a specific 
charge on a unit of production are now little used for major EI. 
18 Both Mongolia (2007) and Zambia (2008) attempted introduction of windfall taxes that were effectively 
price-related additional royalties; both quickly withdrew them.
19 
the end of the contract period. The government can correct this by charging a royalty that 
reflects the diminution in the terminal value of the resource (Conrad, Hool, and Nekipelov, 
2009). In practice, however, extraction rights are usually granted for long periods, and 
renewable if further extraction seems warranted, so that contractors will internalize impacts 
on terminal values unless a significant charge is levied for renewal. 
32. The use of gross royalties protects revenue against overstatement of cost, but too 
little knowledge of costs can weaken the government’s position. Companies can reduce 
profit-related taxes by increasing deductible costs, and gross royalties can be used to guard 
against this.19 But if royalties yield significant revenue and prices fall, companies will argue 
for reduced rates and governments will have no sound basis to challenge their case if they 
have not been closely monitoring costs. “Net profits” royalties and related schemes (popular 
in both North and South America) have the character of income taxes more than royalty; the 
name usually persists because of attribution to a sub-national tier of government. 
33. The corporate income tax (CIT) is a core component of most EI fiscal regimes. 
Application of the CIT to the EIs is needed to ensure that the normal return to equity is taxed 
at corporate level just as in other sectors. Some countries apply a higher than standard rate on 
the usual CIT base (as in Indonesia in mining, and Nigeria and Trinidad and Tobago in 
petroleum); others have separate income tax regimes addressing sector-specific issues (the 
most important of which are addressed in Appendix III). A variable income tax (VIT) uses 
the CIT base, but varies the rate of tax according to the ratio of profits to gross revenues. This 
is relatively simple but may introduce distortions, particularly if a high rate of tax applies 
when a period of high accounting profit occurs early in the life of a project, before the 
required return has been earned. The VIT may also increase debt-bias unless deduction of 
interest is limited to the standard rate of CIT. 
34. A variety of taxes explicitly target EI rents (Box 2). Since it taxes the full return to 
investors, including the required return to equity holders, the CIT is a blunt instrument for 
reaching rents. A high CIT rate, for instance, can discourage investment by increasing the 
required pre-tax return; a tax on rents does not. The CIT is also biased toward debt-financing, 
since (with rare exceptions) interest is deductible whereas the cost of equity capital is not. 
Other tax instruments, such as royalties, also cause distortions whose effect is to erode the 
total of pre-tax rents to be shared between government and operator. Rent taxes aim to 
preserve that surplus, and to transfer a substantial part of it to government. Though 
equivalent, in principle in being non-distorting, alternative forms of rent tax differ 
importantly, not least in the timing of the government’s receipts. 
19 Box 7 of Boadway and Keen (2010) spells out how.
20 
Box 2. Two Leading Forms of Rent Tax1 
1. The ‘Brown Tax,’ or ‘R-based cash flow tax,’ has as its base all current receipts less all current 
expenses (both non-financial), with immediate refund (or carry forward at interest) when this is 
negative. Accounting and tax depreciation do not feature—all capital is immediately expensed—and 
there are no deductions for interest or other financial costs. There are two main variants: 
 Resource rent tax. This replicates many features of the Brown Tax, with the investor 
receiving an annual uplift on accumulated losses until these are recovered. (As originally 
designed by Garnaut and Clunies Ross (1975) the uplift rate is set at the minimum required 
rate of return for the investor; this choice is now widely questioned, as discussed in 
Appendix IV). Australia uses this scheme for both mining and petroleum, while Angola’s 
production-sharing scheme uses the mechanism. It is usually applied with ring-fencing by 
license. 
 Tax surcharge on cash flow. Adjusting accounting profit by adding back depreciation and 
interest, and deducting any capital expenditure in full, yields a base of net cash flow. This, 
too, could form the base for a surcharge. Instead of permitting an annual uplift for losses 
carried forward, a simple uplift (investment allowance) could be added to capital costs at the 
start—this is done in the United Kingdom by a time-limited uplift on losses. In the UK, this 
surcharge is combined with conventional CIT, within the same sector-wide ring fence. The 
“R-factor” or payback ratio scale used in some PSCs is a further variant, as is the “investment 
credit” of Indonesian PSCs. 
2. Allowance for Corporate Equity (ACE) or Capital (ACC) schemes. The former amends the 
standard CIT by providing a deduction for an imputed return on book equity; tax depreciation 
remains, but becomes irrelevant in that faster depreciation reduces equity and hence future deductions 
by an offsetting amount. The latter also gives the interest deduction at a notional rate, so eliminating 
any distinction between debt and equity finance. Norway’s special petroleum tax approximates the 
ACC, though its combination of uplift on total investment and limitation on interest deduction differs 
from a “pure” ACC. It also offers refund of the tax value of exploration losses and of ultimate losses 
on licenses. In 2010, the Henry Report proposed for Australia “a uniform resource rent tax…[using] 
an allowance for corporate capital system” (Henry Proposal). Several countries (Belgium, Brazil, 
Italy, and others) apply ACE-type schemes as their main corporate tax.2 
A central difference between these two types of rent tax is the timing of tax payments—which is 
generally earlier under the ACE/ACC. Under the Brown Tax, tax is payable only at the perhaps 
distant date in which costs have been fully recovered; under the ACE/ACC by contrast, it is payable 
as soon, roughly speaking, as annual income covers the annual cost of financial capital. 
A key and contentious issue for both types is the choice of imputed rate of return (for carry 
forward under the Brown Tax and for capital costs under the ACE/ACC; Appendix IV). 
__________________________ 
1 Boadway and Keen (2010), Land (2010) and Lund (2009) provide detailed discussions of rent taxation in the EI. The first 
shows that there is, in principle, an infinite number of non-distorting tax schemes; the focus here is on the most common in 
practical discussions. 
2 Klemm (2007).
21 
35. Use of resource rent taxation is increasing, notably in petroleum but also in 
mining. Staff advice in developing countries has usually been to combine one of the devices 
shown in Box 2 with a royalty to make up the combined ‘resource charge’: the balance 
between the two is determined in specific cases by the relative ability to bear risk and the 
government’s tolerance for potential delay in revenue. The trade-off can be finessed by using 
a device such as the ACC, where depreciation allowances (instead of cash flow deductions) 
advance tax payments, or the cash flow surcharge with limited-time uplift. Any measure that 
brings forward revenue in this way causes a counterpart increase in investor risk and thus 
may ultimately diminish rent available for taxation. 
36. State equity is used by many countries to secure additional government take 
(beyond tax revenue) from profitable projects. This is sometimes motivated by non-fiscal 
concerns: a desire for direct government ownership, a “seat at the table,” or to facilitate the 
transfer of knowledge. But these benefits could also be achieved by regulation (Sims, 1985). 
State equity can take different forms. Fully paid-up equity on commercial terms puts the 
government on the same footing as a private investor—akin to a Brown Tax (Box 2). Under a 
carried interest arrangement, the private company finances the government participation 
with the cost, including interest charges, offset against the future state share of production, 
proceeds, or profits—again equivalent to a Brown Tax. Or the government may negotiate 
free equity—equivalent to a dividend withholding tax (DWT) as a charge on profits, though 
this usually leads to some offset against other tax payments. 
Instrument choice in practice 
37. A wide range of mechanisms is used, though there is little evidence on their 
relative yields.20 The final columns of Table 3 show the frequency with which instruments 
are used in a sample of 25 mining regimes and 67 petroleum regimes analyzed by staff. 
There is considerable variation both within and across mining and petroleum. In the mining 
cases, royalties are ubiquitous while production sharing and bonuses are absent; in 
petroleum, one-sixth of cases have no royalties, nearly one-half have production sharing, and 
just under 20 percent have bonuses. And even with the mining royalty regimes, there is 
considerable variation in the precise form. Information on the relative revenue importance of 
these instruments is hard to find (even from the survey of IMF desks). Figure 3 reports the 
breakdown in two cases. 
20 There are many variations on each theme and the distinction between different mechanisms is often blurred 
—elements from different mechanisms may be combined, or multiple mechanisms applied in a single regime. 
Classification in this analysis is for convenience only, but reflects reasonably common usage.
22 
Table 3. Fiscal Mechanisms in the EIs: Nature and Prevalence 
Mechanism Description Prevalence 
Number of countries 
Mining Petroleum 
Signature bonus Up-front payment for acquiring exploration rights. 
Commonly used as a bid parameter (Notably for 
petroleum in the US offshore continental shelf) 
1 16 
Production Bonus Fixed payment on achieving certain cumulative 
production or production rate 
None 10 
Royalties Specific (amount per unit of volume produced) 2 1 
Ad-valorem (percentage of product value) 17 31 
Ad-valorem progressive with price 1 9 
Ad-valorem progressive with production 8 
Ad-valorem progressive with operating ratio/profit 3 1 
Royalty applied to operating margin (net profits 
2 0 
royalty) 
State, provincial, and/or 
local CIT1 
Rate of corporate income tax at the state, provincial, 
or local level in addition to federal level. Common in 
Canada and the U.S. as a province/state resource 
charge in addition to federally imposed CIT. 
2 5 
Variable income tax CIT where the tax rates increase with the ratio of 
taxable income to revenue, between an upper and 
lower bound 
32 None 
Resource rent taxes Cash flow with accumulation rate/uplift. Can be 
assessed before or after CIT. 
5 5 
Cash flow with limited uplift on losses (UK). 
(surcharge tax on cash flow) 
None 2 
Allowance for Corporate Capital None 13 
Allowance for Corporate Equity None 14 
Other additional income 
taxes 
Other profit taxation mechanisms that do not fall 
under any of the categories above 
1 3 
Production sharing Fixed production share None 5 
Cumulative production None None 
R-Factor: ratio of cumulative revenues to cumulative 
None 13 
costs 
Rate of return, pre- or post-tax None 3 
Production Level None 13 
State participation Free equity: government receives percentage of 
dividends without payment of any costs 
2 None 
Carried equity: government contributions met by 
investor and recovered from dividends with interest 
3 8 
Paid equity: government pays its share of costs None 19 
Social 
investments/infrastructure 
Resource companies build infrastructure or make 
other social investments (hospitals, schools, etc). 
1 6 
Number of countries 25 67 
Source: IMF FARI Database. 
1 In addition to Canada and the United States, Argentina, Italy, and the Russian Federation impose provincial, local, and state 
CIT, respectively. All countries in the sample impose corporate income tax (CIT) with the exception of the cases where VIT is 
used. 
2 VIT is used in Botswana, South Africa (in gold mining), and Zambia. 
3 Norway. 
4 Italy.
23 
Figure 3. Composition of Revenue 
Oil (Chad, 2010) Copper (Chile, 2009) 
Royalty Income tax Statistical fees 
28% 
3% 
69% 
Royalty Income tax Revenue from state-owned 
4% 
company 
29% 
67% 
Source: Data compiled for this paper. Source: Data compiled for this paper. 
38. Some 80 percent of world petroleum reserves are controlled by state companies 
and 15 of the 20 largest oil companies are state-owned. In all of these, the government (or 
NOC) pays for the private services it contracts and sometimes uses ingenious types of service 
contracts to approximate the risk-reward arrangements of PSCs. Except for Iraq’s contracts, 
these systems do not allow private firms to “book” reserves under SEC rules—for which they 
will seek compensation. 
39. Several G20 and high-income countries have scope to tax EI rents more 
effectively. Although not the principal focus of this paper, Box 3 provides a summary of 
some key issues and experiences. 
E. Understanding Tax Effects on Exploration, Development, and Extraction 
40. Taxation potentially affects decisions at all stages—exploration, development, 
and production—and in potentially complex ways. Key margins of choice include the 
intensity of exploration, the timing and intensity of initial development, the timing and 
intensity of extraction and enhanced (or secondary) recovery, and the eventual abandonment 
of the mine or oil field. No single model has satisfactorily encompassed all these dimensions. 
For this paper, Smith (2012) develops a manageable framework (Appendix V) for analyzing 
the behavioral impact of tax design in a coherent framework capturing the full lifecycle of EI 
activities.21 Simulations described in Smith (2012) highlight a range of considerations. 
21 Though designed and calibrated for oil and gas projects, the model could easily be adapted for mining.
24 
Box 3. EI Fiscal Regimes in Higher-Income Countries 
Recent debates in, for example, Australia and Brazil, and reviews of mineral royalties in the 
United States and the Russian Federation, make clear that weaknesses in the design of fiscal 
regime are not limited to developing countries or new producers. In many of these countries too, 
more effective fiscal regimes could make a significant contribution to meeting intensified revenue 
needs. As stressed in IMF (2010): “Most [G20 countries] are sufficiently able to diversify the 
risks of natural resource exploitation to make profit/cash flow based instruments more efficient 
than fixed fees and royalties, yet some—including the U.S and Russia—still place heavy reliance 
on the latter. Movement toward explicit rent taxation, and use of auctions, could produce a 
marked revenue enhancement. This is not to argue that average effective tax rates are necessarily 
low…but that tax structures could be modified both to promote investment and to secure for 
governments higher shares of resource rent in profitable projects.” 
Among major producers: 
 The U.S. uses auctions with bonus bidding for the Outer Continental Shelf, coupled with 
corporate income tax (CIT) and royalties; onshore, and for mining, both public and private 
resource owners mainly impose gross revenue royalties although net profit royalties are 
also common in some states. 
 Russia operates a complex and distorting system combining a royalty, export taxes, and 
different prices for domestic sales and exports. In both Russia and the U.S., alternatives 
have been much debated but not adopted. 
 Canadian provinces have moved rapidly toward profit or cash flow related taxes on oil and 
gas (including unconventional shale-sourced petroleum), though these are still 
(confusingly) called “royalties.” 
 Norway has perhaps the closest to a pure rent tax (in ACC form), coupled with CIT, for its 
North Sea oil and gas under a system also noted for its stability. 
 The United Kingdom began oil and gas production with a more complex (and frequently 
changed) system, but in recent years has used a cash flow tax as a surcharge to the CIT. 
Both the U.K. and Norway effectively refund the tax value of losses. 
 Australia has explored differing approaches to petroleum and mining. From 1987, offshore 
petroleum was subject to a petroleum resource rent tax (PRRT) imposed as deductible for 
CIT, but onshore petroleum and all mining remained subject to state royalties and CIT. In 
2010, the government proposed for all EI a version of the allowance for corporate capital 
scheme (the Henry Proposal)—conventional tax depreciation was used, with uplift of 
losses and undepreciated balances carried forward at the government’s Long-Term Bond 
Rate (LTBR); government guaranteed ultimate refund of the tax value of losses. The rate 
was to be 40 percent, deductible for CIT; and the CIT rate was to be reduced over time to 
25 percent. After an outcry from mining companies (and a change in the composition of the 
government) the proposal was replaced with a Minerals Resource Rent Tax (MRRT) which 
now applies to iron ore and coal only. The MRRT applies at an effective 22.5 percent rate, 
after uplift on cash outflows of LTBR, plus 7 percentage points, and allows for crediting of 
state royalties. At the same time, the PRRT was extended to apply to onshore activities.
25 
41. The impact on exploration depends on the total government take in the event of 
success, interacting with tax offsets and the probability of success. The decision to 
explore rests on comparing the fixed cost of drilling with the probability of success (updated 
as exploration progresses) and the return conditional on successful discovery. Simulations in 
Smith (2012) suggest that a tax regime with government take of approximately 50 percent of 
quasi-rents in the event of success (ring-fenced, so that exploration costs do not attract 
immediate tax reduction) reduces the acceptable number of exploratory failures appreciably, 
by 15–25 percent. 
42. Royalties, and production sharing agreements (PSAs) that create effective 
royalties, can plausibly cause significant distortion. For instance, a 20 percent royalty or a 
40 percent minimum profit oil share to the state (allowing only 50 percent of available oil for 
production costs) reduce initial investment by some 20 percent and the extraction rate by 
approximately 1 percentage point per year. The same terms delay investment in enhanced 
recovery by 1 or 2 years, with a further overall investment reduction of 20 percent. 
43. A resource rent tax may increase investment if the uplift rate on capital 
expenditure exceeds the company’s cost of capital. This circumstance leads to a negative 
marginal effective tax rate, and thus an implicit subsidy to resource extraction (Mintz and 
Chen, 2012). This incentive to “gold plating” (inflating costs), or suboptimal timing of 
investment (sooner rather than later) depends on both the excess of the uplift rate over the 
cost of capital and the resource rent tax rate; where both are low, the incentive is small 
(Appendix IV). 
44. It is important to consider tax effects over the full project cycle. The sequential 
nature of the process means that distortions at one stage likely impose distortions at others, 
too. Effects emerge more subtle than the impact of taxation of quasi-rents on exploration 
decisions. High royalty rates, for instance, are associated with longer production lifetimes— 
somewhat counter-intuitive, this is because the expectation of high royalty rates leads to 
lower development investments, which imply higher marginal extraction costs. Total 
extraction over this expanded lifetime remains smaller than without the tax. 
F. Scenario Analysis of Resource Tax Regimes: The FARI Model 
45. FAD’s model for the Fiscal Analysis of Resource Industries (FARI)—presented 
in some detail in Appendix VI—is now widely employed by staff in country and TA 
work. Excel-based, it enables detailed design, modeling, and comparison of fiscal regimes 
across the entire lifecycle of petroleum or mining projects. It is also increasingly used as a 
forecasting tool linked to the macro-economic framework for resource-rich countries. It does 
not incorporate behavioral responses of the kind just discussed, though extensions of the
26 
model can simulate tax effects on investors’ perceived risk.22 
46. One key output of FARI is project-specific estimation of the government tax take 
under alternative fiscal regimes, alternative prices, and other outcomes. This is captured 
by the “Average Effective Tax Rate” (AETR): the government’s share of pre-tax net present 
value (NPV), usually measured at the government’s assumed discount rate. By way of 
illustration, Figure 4 reports estimated AETRs for a range of actual fiscal regimes in both 
mining and petroleum. These show that most petroleum fiscal regimes have a higher AETR 
and include more progressive elements than do mining regimes. 
G. Evaluation of Alternative Fiscal Regimes 
47. Table 4 evaluates several families of mechanism against a range of criteria 
capturing the objectives set out above.23 The judgments there reflect both general 
principles and quantitative analysis, using the FARI Model, sketched in Appendix VI. 
Table 4 uses those results to match instruments to government objectives.24 
48. No regime is ideal for all, but for LICs combining a modest ad valorem royalty, 
CIT, and resource rent tax has considerable appeal. The first ensures some revenue 
whenever production is positive. The second ensures that the normal return to equity is taxed 
at corporate level in EI as in other sectors and, moreover, that foreign tax credits will be 
available where investing companies’ home countries (notably the US) tax them on 
worldwide income. And the third exploits the distinct revenue potential of the EIs. Such a 
framework can be applied across a wide range of circumstances and work for oil, gas, and 
mining projects, though the balance between mechanisms and parameters may differ.25 There 
may be scope for other instruments, too: if there is competitive allocation of licenses or 
contracts, for example, then either a bonus or some parameter of the fiscal regime could be a 
bid variable (though of course use of a bidding system will affect the design of the fixed tax 
elements in the system). 
22 FARI is similar to other simulation frameworks used for scenario analysis within the petroleum industry 
(Tordo, 2007) but specifically adapted for staff tax policy advice and for linkage to the macro-framework. 
23 These criteria are adapted from Daniel et al. (2010). 
24 Such simulations likely overestimate government take, as they take no account of the use of international tax 
and financing structures to reduce tax payments or the opportunity to deduct costs from one project against 
revenues from another if there is no ring-fencing, and do not allow for imperfections of implementation. 
25 There are interactions between the CIT and rent tax which means that the latter, even if deductible from the 
former, in general ceases to be neutral.
27 
Figure 4. Average Effective Tax Rates (AETR) for Petroleum and Mining 
Petroleum: Oil Field 
- 20% 40% 60% 80% 100% 
Mining: Iron Ore Mine Example 
Angola; PSC 2006 
Sri Lanka; PSC 
Norway; Offshore 
Equatorial Guinea; PSC 
Ghana; PSC 2008 
Indonesia; Deep Water 
Timor-Leste; PSC 
Malaysia; Deep Water 
Mozambique: PSC 
Vietnam; PSC 2010 
Liberia; PSC 
Nigeria; PSC 
Australia; PRRT 
ACC Henry Proposal 
Brazil 
Argentina 
Source: IMF staff calculations using FARI model and database. 
Project Description 
Field: 300 MMBbl 
Size: 298 MMBOE 
Costs: $21.0 BOE 
Oilprice: $100 Bbl 
IRR pre tax: 56% 
AETR at zero discount rate 
AETR at 10% discount rate 
- 20% 40% 60% 80% 100% 
Zambia; Budget 2012 
Guinea; Mining Code 2011 
Liberia ; LRC2010 
Sierra Leone; NMA2009 
Australia; MRRT 
Chile; General regime 
Canada; British Columbia 
Brazil; General regime 
Peru; General regime 
South Africa; iron 
China; Iron 
Project: Iron Project small 
Size: 76.7 MM tonnes 
Unit costs: ConstReal $41 
Iron Ore FOB price: 
ConstReal $80 
IRR pre-tax: 44.4% 
AETR at zero discount rate 
AETR at 10% discount rate
28 
Table 4. Primary Government Objective and Relevant Mechanism1 
Signature Bonus Flat Royalty Sliding-scale Royalty Resource Rent Tax 
(and ACE) 
CIT/VIT State Participation 
Maximizing 
government share 
over project life 
X X 
Securing early 
revenue 
X X 
Ensuring adequate 
incentives for 
exploration 
X X 
Visible share of 
commodity price 
increases 
X 
Strategic ownership 
interest 
X 
Maximize resource 
utilization 
X X 
Minimize 
administrative 
burden and risks 
X X 
1Includes production-sharing equivalents of tax and royalty devices.
29 
49. A suitable tax structure and a target range of AETRs result from this analysis. 
These simulations, and those of other sources, suggest reasonably achievable ranges of 
discounted AETRs will be 40–60 percent for mining26 and 65–85 percent for petroleum. 
50. In some LICs, a focus on immediate revenue gains from EI projects is perhaps 
inevitable. Most of these will come from improved tax administration. Retrospective 
changes of terms will usually damage the prospects for future investment. That said, there is 
room in a properly designed system for bonuses, for royalties, and for shifting revenue 
forward by taxing gains on transfers of interest (Appendix III). 
III. ADMINISTRATION AND TRANSPARENCY 
Administration27 
51. There is no intrinsic reason for effective and transparent administration of EI 
fiscal regimes—critical for both revenue and investor confidence—to be harder for EI 
than other industries. They are simpler than other industries (such as finance and telecoms) 
in that they involve physical operations with outputs that can be analyzed, weighed, and 
measured, with prices in most cases quoted on international exchanges. And the vast bulk of 
revenues is often paid by a few large taxpayers, with a high stake in maintaining government 
goodwill. 
52. Administration is nonetheless often difficult and badly performed. The (often 
excessive) variety and complexity of EI fiscal regimes often pose serious challenges; 
important tax rules are often complex, unclear, or open to abuse. Even with just a few EI 
companies, countries often struggle to cope with routine processing and reporting, hampering 
effective filing and payment enforcement. Royalty administration is often particularly 
inefficient, with frequent assessments, no annual return, and no reconciliation to commercial 
accounts and CIT returns. Fragmented administration prevents development of coherent risk-based 
audit and taxpayer service functions. Pay, status, and authority for operational staff are 
often inadequate to recruit staff of the quality required. 
53. An efficient structure for administration of the fiscal regime may require 
changing the responsibilities of EI ministries and any national EI companies (NEICs). 
26 Aside from the special case of large-scale diamond mining where government shares have often been higher. 
27 Guidelines for effective EI tax administration are reviewed briefly here and set out in more detail in 
Appendix VII. Staff of the IMF and World Bank are working together on detailed guidelines for administering 
EI fiscal regimes.
30 
Fragmented tax-type-based administration of the kind still common for EI revenues has many 
well-known disadvantages. The allocation of fiscal responsibilities to EI regulators and 
NEICs furthermore weakens their focus on their main roles. Self-assessment, a basic 
principle for effective tax administration that tax authorities in LICs often fail to apply, fits 
even less well into the culture and practices of NEICs and EI regulators, whose normal 
regulatory and commercial roles require real-time intervention. They often lack tax audit 
capacity, and outsource their audit function, a decision that should not rest merely on the fact 
that this function has been allocated to non-tax agencies. There is a fundamental conflict of 
interest when the NEIC combines fiscal and commercial responsibilities. To preserve 
integrity, fiscal roles within the EI ministry/NEIC should be clearly separated from 
regulatory and commercial roles. Putting the former in the tax department is the most 
obvious and effective way to do that.28 
54. Claims that administration of profit/rent-based EI taxes is so hard for LICs that 
they should rely on royalties instead are often misplaced: 
 Royalties are not always as easy to administer as is sometimes claimed… The ease 
of valuing sales should not be overstated. Although pricing from benchmarks may 
reduce transfer pricing risks, it is technically demanding, particularly for mining; and 
“netback” of processing, transportation, and other costs from benchmark refined 
mineral prices to establish market value at mine gate or export point can be 
challenging, posing similar difficulties to income-based taxes. In some cases, there 
are no international benchmark prices on which to base valuation. Regulations or 
advance pricing agreements to establish monitorable, transparent valuation formulae 
may be possible, but require considerable administrative sophistication. 
 …and profit/rent-based taxes are not necessarily as hard. Most LICs apply CIT to 
complex activities, such as banking and telecoms, even if sometimes accompanied by 
turnover taxes; and there is no special reason it should not apply to the EIs. Rent taxes 
can then be designed to require the same data, with a less complex calculation: the R-based 
cash flow tax, for instance, avoids any need to calculate depreciation, financial 
costs, or gains on license transfers. Angola, despite exceptional capacity constraints 
successfully applies production-sharing scaled to internal rates of return. 
55. The principles of effective modern tax administration are equally relevant to the 
EIs but too often are not applied in practice. They include simple, well-designed 
28 There is a case for the EI ministry retaining responsibility for physical audit. This is consistent with its 
regulatory role, requires real-time intervention and specialist mineralogical skills, and is distinct from normal 
tax administration functions (where natural resources are exported, this function is sometimes allocated to 
Customs, whose responsibilities likewise require real-time physical intervention). Sharing information from 
physical audit with the tax administration is vital, and often needs improvement, and it would still be the tax 
department’s function to reconcile reported volumes with taxpayers’ returns and financial records.
31 
legislation with a minimum number of taxes; an integrated, function-based organizational 
structure; coherent, self-assessment-based procedures; and taxpayer-focused compliance risk 
management. But fragmentation of fiscal policy and administration often makes them 
difficult to implement (and also weakens the focus of EI ministries and NEICs on their own 
responsibilities, creating conflict and confusion of roles). Reforming this flawed approach 
can, however, be extremely disruptive, and also face major political obstacles. 
56. Strengthening EI revenue administration is an increasing focus of FAD TA. But 
since this paper does not aim to discuss general principles of tax administration reform, its 
importance, and the weight given to it in FAD TA, are not fully reflected in this brief 
discussion. Nevertheless, there are immediate gains available from simple steps to improve 
audit (Appendix VII). 
Transparency 
57. The risk that resource wealth will undermine governance is well documented.29 
Tax policy design and administration may not be the greatest areas of concern, but here too 
transparency is vital, and often lacking. One-off confidential agreements make the law 
opaque, and the negotiation process is open to abuse. Government accounting for resource 
revenues is often poor and unreliable. 
58. Governments often make achieving transparency difficult. Multiple taxes; 
contract confidentiality; complicated, inefficient, and incoherent filing and payment 
procedures; responsibilities for returns and payments fragmented across different agencies, 
with different banking arrangements and separate accounting and IT systems; revenues paid 
in kind; and no single department responsible for accounting for assessment and collection: 
all create non-transparency for no good reason. 
59. The Extractive Industry Transparency Initiative (EITI), to which many resource-rich 
countries subscribe, has had some success, but many countries still do not tackle 
the underlying issues. EITI requires EI companies to publish what they pay, and 
governments what they receive, and that these amounts be audited and reconciled. 
(Confidentiality barriers must be removed.) Initiatives extending this approach now include 
Section 1504 of the US Dodd-Frank Act, requiring SEC-listed EI companies to report 
payments to governments; similar disclosure is required by a proposed modification of the 
EU Transparency Directive. While EITI has led to important progress, more needs to be 
done. For example, some countries now publish one-off tax agreements, but have not moved 
to taxing companies on the basis of published legislation. And government accounting 
remains poor. 
29 The IMF’s Guide on Resource Revenue Transparency (2007) considers the issues comprehensively.
32 
IV. REVENUES FROM EIS 
This section reviews revenue raised from the EIs. 
A. Government Revenues from the EIs 
60. Data on government revenues from the EIs are poor—a current IMF initiative 
aims to improve them. Difficulties include the sector-specific and conventionally “non-tax” 
nature of many of the instruments used (bonuses, royalties and production sharing, or 
concessional state participation, for instance), the need to identify resource-related 
components of the CIT and other standard instruments, and fragmented and inefficient data 
collection across ministries and agencies. The Statistics Department plans pilot work toward 
routine collection of such data (Appendix VIII). The discussion that follows uses data 
provided by country desks on 57 resource-rich countries for 2001–10 (Appendix IX). 
61. Government revenue from EIs is substantial in many countries, with reliance 
especially high in some developing countries (Figures 5–7, the last covering countries for 
which revenue cannot be distinguished by sector.) Petroleum revenue can be especially large: 
over 10 percent of GDP in 22 countries. These revenues are also substantial in many 
advanced and emerging economies, but dependence upon them is especially marked in some 
developing economies: revenues from petroleum accounted for about 93 percent of all 
government revenue in Timor-Leste (2008), for instance, and around 82 percent in Angola 
(2007).30 
30 Not discussed here are the implications of resource revenues for non-resource tax policies. The data 
assembled for this paper suggest that a one percentage point increase in EI-related revenue (in percent of GDP) 
is associated with a reduction in other revenues of around 0.2 points—broadly consistent with estimates for oil 
in Bornhorst, Gupta, and Thornton (2009) and reported for resources in sub-Saharan Africa in IMF (2011).
33 
Figure 5. Petroleum: Government Revenue by Country 2001–10 
70 
60 
50 
40 
30 
20 
10 
Oman 
Source: IMF staff estimates. 
Angola 
Congo Republic 
Figure 6. Mining: Government Revenue by 
Country, 2001–10 
20 
18 
16 
14 
12 
10 
Source: IMF staff estimates. 
100 
90 
80 
70 
60 
50 
40 
30 
20 
10 
Venezuela 
Chad 
Norway 
Sudan 
Syria 
Mexico 
Ecuador 
Malaysia 
Cameroon 
Myanmar 
Uzbekistan 
Ivory Coast 
Namibia 
United Kingdom 
Figure 7. Mining and Petroleum: Government 
Revenue by Country, 2001–10 
20 
18 
16 
14 
12 
10 
8 
6 
4 
2 
Source: IMF staff estimates. 
0 
0 
Iraq 
Kuwait 
Libya 
Brunei 
Timor-Leste 
Saudi Arabia 
Equatorial Guinea 
Algeria 
Nigeria 
Qatar 
Bahrain 
Yemen 
United Arab Emirates 
Iran 
Trinidad and Tobago 
Azerbaijan 
Kazakhstan 
Niger 
Philippines 
percent Total Revenue 
percent GDP 
Avg revenue %GDP Avg revenue %total revenue 
50 
45 
40 
35 
30 
25 
20 
15 
10 
0 5 
0 2 4 6 8 
Botswana 
Mongolia 
Chile 
Guinea 
Zambia 
Kyrgyz Republic 
Lesotho 
Ghana 
Sierra Leone 
Tanzania 
percent Total Revenue 
percent GDP 
Avg revenue %GDP Avg revenue %total revenue 
50 
45 
40 
35 
30 
25 
20 
15 
10 
5 
0 
0 
Russia 
Bolivia 
Papua New 
Guinea 
Vietnam 
Indonesia 
Mauritania 
DRC 
Colombia 
Australia 
Brazil 
Canada 
percent Total Revenue 
percent GDP 
Avg revenue %GDP Avg revenue %total revenue
34 
62. Revenues from the EIs increased over the past decade, most consistently in 
petroleum producing countries (Figures 8 and 9).31 Revenues from petroleum rose in the 
countries shown from an average (GDP-weighted) of 8 percent of GDP to 12 percent, and 
from 26 percent of government revenue to 35 percent. For mining countries, the increase in 
revenue has been somewhat less marked relative to GDP, but much greater (and very 
volatile) relative to all government revenue—reflecting that mining-intensive countries are 
relatively low income, so tend to have fewer alternative revenue sources. In both sectors, 
revenues appear to have moved more or less in line with commodity prices (movement in 
mining tracking less the strong rise in gold prices than the evolution in the prices of the other 
main metals—copper, aluminum, iron ore, tin, nickel, zinc, lead, and uranium). In neither 
case (and this emerges too from simple regressions) is there sign that revenues are strongly 
progressive in current prices, though this would be hard to detect from these data for oils 
given that price movements may also powerfully affect the denominator of the revenue/GDP 
ratio. 
Figure 8. Petroleum: Government Revenue, 
2001–10 
Figure 9. Mining: Government Revenue, 
2001–10 
Source: IMF staff calculation using data described in 
Appendix VIII. 
30 
25 
20 
15 
10 
5 
mineral revenue, %GDP (weighted avg) mineral revenue, % tot revenue (weighted avg) 
Gold Price Index (2005=100) Commodity Metals Price Index (2005=100)* 
Source: IMF staff estimates. 
200 
180 
160 
140 
120 
100 
80 
60 
40 
20 
0 
B. Effective Tax Rates in Practice 
63. Appendix IX elaborates on two complementary (but crude) methods to evaluate 
(somewhat different concepts of) effective tax rates on EI activities: simulation methods 
(using the FARI model described below), and analysis of accounting data. Each method has 
its strengths and weaknesses: simulation exercises, for instance, can take full account of all 
taxes over the lifetime of a project, but require the analyst to project future prices and costs 
and may overstate effective tax rates as they do not capture all possible sources of revenue 
31 Similarly, EI exports rose from a weighted average of 7.7 percent of GDP in 2001 to 12.3 percent in 2010. 
Petroleum dominates these exports, though its share decreased over this period from 93 percent to 87 percent. 
40 
35 
30 
25 
20 
15 
10 
5 
- 
2001 
2002 
2003 
2004 
2005 
2006 
2007 
2008 
2009 
2010 
Price Index 
percent 
oil revenue, %GDP (weighted avg) oil revenue, % tot revenue (weighted avg) 
Crude Oil (petroleum) Price index (2005=100) 
300 
250 
200 
150 
100 
50 
0 
- 
2001 
2002 
2003 
2004 
2005 
2006 
2007 
2008 
2009 
2010 
Price Index 
percent 
*includes Copper, Aluminum, Iron Ore, Tin, Nickel, Zinc, Lead, and Uranium Price Indices
35 
erosion (through imperfect administration, for instance); accounting data reflect actual 
outcomes, but provide only a snapshot across a miscellany of activities.32 The results are thus 
no more than suggestive—and the methods capable of further refinement. 
64. These exercises suggest that effective tax rates are commonly higher in 
petroleum (around 65–85 percent) than in mining (45–65 percent), and increase with 
earnings, most markedly for petroleum. These conclusions broadly match general 
perceptions on these issues. 
65. The reasons for these differences between petroleum and mining are not fully 
understood. Possible explanations include that the expectation of rents, and the shaping of 
fiscal regimes to capture them, may simply be longer established for petroleum (mineral 
commodity prices having until fairly recently been in a slow decline that most thought would 
continue); the perception of greater non-fiscal benefits from mining (especially relative to 
offshore oil) may have led to more intense tax competition; and/or asymmetric information 
(on exploration and development risk), with related administrative challenges (from the 
absence of spot prices for some commodities, for instance) may have been a greater 
constraint in mining. While in some respects currently narrowing (rent capture having 
emerged as a greater a focus in mining), it may be that these differences will reassert 
themselves: some see substantial potential supply that will dilute rents in minerals, whereas 
in petroleum, restricted access to reserves and increasing costs of marginal production 
(Canadian oil sands or ultra-deep water) mean that significant rents for lower cost producers 
will remain. 
V. SELECTED CURRENT ISSUES 
A. Stability and Credibility 
66. Stability and credibility of the fiscal regime for the EIs—critical to overcoming 
the hold-up problem—do not necessarily require a contractual assurance of fiscal 
stability. Such an assurance is unlikely to substitute for a credible commitment by 
government to maintain predictability in its fiscal regime. Predictability is needed not only 
for the fiscal regime itself but, not least, for a process and/or criteria by which a regime may 
be modified (Daniel and Sunley, 2010; Osmundsen, 2010).33 
67. A stability assurance can have the strengths and weaknesses of fiscal rules more 
generally (Debrun and Kumar, 2008). For the government, it may be a commitment 
32 Staff experimented with a third method, comparing companies’ actual market values with estimates of what, 
given reserves and current costs and prices, it would be expected to be in the absence of taxes. Further work is 
needed, however, to have reasonable confidence in the results. 
33 Investment agreements may also have an important role in relation to expropriation risk.
36 
technology aimed at binding all parts of government and future governments. Or it could be a 
signaling device aimed principally at encouraging other investors to enter. In some cases, it 
could function as a ‘smokescreen,’ with the government intending to make less visible 
changes to other aspects of the legal arrangements over time. The value to investors is not 
always clear—and if the assurance has to be invoked, relations with government have already 
broken down to a point where continued operation will be hard. 
General legislation versus imposition by contract 
68. Administrative costs, political difficulties, and, probably, investors’ perceived 
risk can be reduced by legislating terms applicable to all EI projects. The alternative of 
setting them out in a model agreement can make them little more than a basis for negotiation. 
69. The advantages to governments of case-by-case negotiation of fiscal terms are 
frequently exaggerated, requiring as they do detailed knowledge of the prospective 
profitability of a deposit, about which investors are likely to be better informed.34 They also 
require concentration of administrative effort, negotiating skills, and detailed assessment of 
each investor’s requirements which, in many circumstances, may be difficult to achieve. 
70. Countries that have attracted substantial mining investments in recent decades 
have used general fiscal terms rather than case-by-case negotiation. These include not 
only advanced countries such as Australia, Canada, or Norway, but also Bolivia, Brazil, 
Chile, Indonesia, Namibia, Peru, and South Africa. Use of general rather than negotiated 
terms seems much more prevalent in South America than it remains in sub-Saharan Africa. 
71. Sometimes negotiation is inevitable.35 The key for governments is then access to 
project-specific information (for example, known deposits), to information on fiscal regimes 
available elsewhere, and to expert advice. A general rule favoring publication of negotiated 
outcomes deters corruption, and is more likely to produce an outcome that is sustainable and 
in the mutual interests of host country and companies. 
72. While the obligation to respect contracts is vital, renegotiations do and 
sometimes should occur. Renegotiation can be warranted when terms have become 
egregiously out of line with international practice, or with terms in comparable 
34 Optimal tax design in the presence of asymmetric information in principle requires offering a menu of fiscal 
regimes: for instance, one involving a royalty and high rate rent tax, another no royalty and a lower rate of rent 
taxation (the former appealing where the investor knows the project to be high cost)—as in Box 6 of Boadway 
and Keen (2010), for instance. Negotiation might be seen as a way of presenting such a menu of options, too 
complex to set out in legislation. The theory remains far from practical implementation, however, and a 
willingness to negotiate carries implications for relative bargaining strengths. 
35 The Fund’s policy has been not to advise on specifics of (re)negotiations, while recognizing that it is when 
these are taking place—indeed, especially then—that advice on general EI fiscal regimes is most valuable.
37 
circumstances: no contract can anticipate all conceivable outcomes. When this happens 
through consultation, or by mutual agreement, the investment climate may be strengthened 
rather than weakened. In contract schemes, provisions for periodic reviews are increasingly 
common. 
B. International Issues 
73. International tax issues for the EIs merit more attention than they have often 
received.36 Most of these issues are not specific to the EIs, and are of increasing importance 
to developing countries more generally—but they arise with special force in the EIs. 
74. The tax treatment of gains on the transfer of an interest in mining or petroleum 
rights has become a pressing and controversial issue. This has become a major concern as 
large gains were achieved by sellers in transactions in exploration projects, for example, in 
Ghana and Uganda; the tax amount at issue in one case in the latter, for instance, was around 
$400 million.37 Appendix III reviews the highly complex and very material tax issues that 
arise. 
75. Tax treaties sometimes erode the tax base of EI projects. They frequently reduce 
permitted levels of border WHTs or even eliminate them altogether. “Treaty shopping”— 
routing and characterizing remittances so as to exploit advantageous treaty provisions—can 
substantially reduce withholding tax (WHT) obligations on dividends, interest, and 
management or technical service fees. Developing countries with substantial investment 
inflows to EI sectors, and negligible outward investments of their own, need to design treaty 
strategies that minimize base erosion and consider adopting rules against treaty shopping. 
76. Vulnerability to abusive transfer pricing exists for EI as for other sectors. Higher 
taxes on upstream activities increase this risk, the companies involved are often integrated 
multinationals, and the use of tax havens is common. On the other hand, features of EI 
mitigate these risks: there are observable physical operations and outputs, there are standard 
measurements and benchmark international prices, and (in petroleum) the joint venture 
structure creates conflicting interests that work in the government’s favor in controlling 
costs. Good practice requires clear and transparent transfer pricing rules producing a 
reasonable approximation of arm’s length prices, using industry-specific practices where 
possible, and reflecting upstream input and output values. EI sectors have useful pricing 
benchmarks for outputs and transparent practices, such as transfer at cost, for some inputs; 
these benchmarks provide a comparable uncontrolled price with which to value transactions. 
The onus should be on the taxpayer to use the rules and show they have done so. Published 
36 Mullins (2010) provides an overview of international tax issues for the EIs; FAD held a workshop exploring 
these topics in more detail in May 2012 and plans a book on the topic. 
37 Myers (2010).
 INTERNATIONAL MONETARY FUND: Fiscal Regimes for Extractive Industries
 INTERNATIONAL MONETARY FUND: Fiscal Regimes for Extractive Industries
 INTERNATIONAL MONETARY FUND: Fiscal Regimes for Extractive Industries
 INTERNATIONAL MONETARY FUND: Fiscal Regimes for Extractive Industries
 INTERNATIONAL MONETARY FUND: Fiscal Regimes for Extractive Industries
 INTERNATIONAL MONETARY FUND: Fiscal Regimes for Extractive Industries
 INTERNATIONAL MONETARY FUND: Fiscal Regimes for Extractive Industries
 INTERNATIONAL MONETARY FUND: Fiscal Regimes for Extractive Industries
 INTERNATIONAL MONETARY FUND: Fiscal Regimes for Extractive Industries
 INTERNATIONAL MONETARY FUND: Fiscal Regimes for Extractive Industries
 INTERNATIONAL MONETARY FUND: Fiscal Regimes for Extractive Industries
 INTERNATIONAL MONETARY FUND: Fiscal Regimes for Extractive Industries
 INTERNATIONAL MONETARY FUND: Fiscal Regimes for Extractive Industries
 INTERNATIONAL MONETARY FUND: Fiscal Regimes for Extractive Industries
 INTERNATIONAL MONETARY FUND: Fiscal Regimes for Extractive Industries
 INTERNATIONAL MONETARY FUND: Fiscal Regimes for Extractive Industries
 INTERNATIONAL MONETARY FUND: Fiscal Regimes for Extractive Industries
 INTERNATIONAL MONETARY FUND: Fiscal Regimes for Extractive Industries
 INTERNATIONAL MONETARY FUND: Fiscal Regimes for Extractive Industries
 INTERNATIONAL MONETARY FUND: Fiscal Regimes for Extractive Industries
 INTERNATIONAL MONETARY FUND: Fiscal Regimes for Extractive Industries
 INTERNATIONAL MONETARY FUND: Fiscal Regimes for Extractive Industries
 INTERNATIONAL MONETARY FUND: Fiscal Regimes for Extractive Industries
 INTERNATIONAL MONETARY FUND: Fiscal Regimes for Extractive Industries
 INTERNATIONAL MONETARY FUND: Fiscal Regimes for Extractive Industries
 INTERNATIONAL MONETARY FUND: Fiscal Regimes for Extractive Industries
 INTERNATIONAL MONETARY FUND: Fiscal Regimes for Extractive Industries
 INTERNATIONAL MONETARY FUND: Fiscal Regimes for Extractive Industries
 INTERNATIONAL MONETARY FUND: Fiscal Regimes for Extractive Industries
 INTERNATIONAL MONETARY FUND: Fiscal Regimes for Extractive Industries
 INTERNATIONAL MONETARY FUND: Fiscal Regimes for Extractive Industries
 INTERNATIONAL MONETARY FUND: Fiscal Regimes for Extractive Industries
 INTERNATIONAL MONETARY FUND: Fiscal Regimes for Extractive Industries
 INTERNATIONAL MONETARY FUND: Fiscal Regimes for Extractive Industries
 INTERNATIONAL MONETARY FUND: Fiscal Regimes for Extractive Industries
 INTERNATIONAL MONETARY FUND: Fiscal Regimes for Extractive Industries
 INTERNATIONAL MONETARY FUND: Fiscal Regimes for Extractive Industries
 INTERNATIONAL MONETARY FUND: Fiscal Regimes for Extractive Industries
 INTERNATIONAL MONETARY FUND: Fiscal Regimes for Extractive Industries
 INTERNATIONAL MONETARY FUND: Fiscal Regimes for Extractive Industries
 INTERNATIONAL MONETARY FUND: Fiscal Regimes for Extractive Industries
 INTERNATIONAL MONETARY FUND: Fiscal Regimes for Extractive Industries
 INTERNATIONAL MONETARY FUND: Fiscal Regimes for Extractive Industries
 INTERNATIONAL MONETARY FUND: Fiscal Regimes for Extractive Industries

More Related Content

What's hot

Revenue mobilization in_developing_countries.__prepared_by_dr_malik_khalid_me...
Revenue mobilization in_developing_countries.__prepared_by_dr_malik_khalid_me...Revenue mobilization in_developing_countries.__prepared_by_dr_malik_khalid_me...
Revenue mobilization in_developing_countries.__prepared_by_dr_malik_khalid_me...Malik Khalid Mehmood
 
Real estate guide vatgre1 issue 2 - final
Real estate guide vatgre1   issue 2 - finalReal estate guide vatgre1   issue 2 - final
Real estate guide vatgre1 issue 2 - finalTareq Azar
 
Vipc capital management company brochure 2010
Vipc capital management company  brochure 2010Vipc capital management company  brochure 2010
Vipc capital management company brochure 2010VIPC Capital Management
 
ComprehensiveAnnualFinancialReportFY08-09
ComprehensiveAnnualFinancialReportFY08-09ComprehensiveAnnualFinancialReportFY08-09
ComprehensiveAnnualFinancialReportFY08-09Eve Pastor, CPA, CGMA
 
2011 Year End Tax Guide
2011 Year End Tax Guide2011 Year End Tax Guide
2011 Year End Tax Guidepquimby
 
goldman sachs Second Quarter 2008 Form 10-Q
goldman sachs Second Quarter 2008 Form 10-Q goldman sachs Second Quarter 2008 Form 10-Q
goldman sachs Second Quarter 2008 Form 10-Q finance2
 
Contagion effect of greece debt crisis
Contagion effect of greece debt crisisContagion effect of greece debt crisis
Contagion effect of greece debt crisisNewGate India
 
VAT in UAE - Real Estate Guide
VAT in UAE - Real Estate GuideVAT in UAE - Real Estate Guide
VAT in UAE - Real Estate GuideManoj Agarwal
 
The State of Domestic Commerce in Pakistan Study 9 - Real Estate in Pakistan
The State of Domestic Commerce in Pakistan Study 9 - Real Estate in PakistanThe State of Domestic Commerce in Pakistan Study 9 - Real Estate in Pakistan
The State of Domestic Commerce in Pakistan Study 9 - Real Estate in Pakistanidspak
 
ComprehensiveAnnualFinancialReportFY07-08
ComprehensiveAnnualFinancialReportFY07-08ComprehensiveAnnualFinancialReportFY07-08
ComprehensiveAnnualFinancialReportFY07-08Eve Pastor, CPA, CGMA
 
GNW Q4-07%20%20GNW%20financial%20supplement
GNW Q4-07%20%20GNW%20financial%20supplementGNW Q4-07%20%20GNW%20financial%20supplement
GNW Q4-07%20%20GNW%20financial%20supplementfinance24
 
City of Chillicothe Comprehensive Annual Financial Report for 2011
City of Chillicothe Comprehensive Annual Financial Report for 2011City of Chillicothe Comprehensive Annual Financial Report for 2011
City of Chillicothe Comprehensive Annual Financial Report for 2011tomspetnagel
 

What's hot (14)

Revenue mobilization in_developing_countries.__prepared_by_dr_malik_khalid_me...
Revenue mobilization in_developing_countries.__prepared_by_dr_malik_khalid_me...Revenue mobilization in_developing_countries.__prepared_by_dr_malik_khalid_me...
Revenue mobilization in_developing_countries.__prepared_by_dr_malik_khalid_me...
 
Real estate guide vatgre1 issue 2 - final
Real estate guide vatgre1   issue 2 - finalReal estate guide vatgre1   issue 2 - final
Real estate guide vatgre1 issue 2 - final
 
Vipc capital management company brochure 2010
Vipc capital management company  brochure 2010Vipc capital management company  brochure 2010
Vipc capital management company brochure 2010
 
ComprehensiveAnnualFinancialReportFY08-09
ComprehensiveAnnualFinancialReportFY08-09ComprehensiveAnnualFinancialReportFY08-09
ComprehensiveAnnualFinancialReportFY08-09
 
2011 Year End Tax Guide
2011 Year End Tax Guide2011 Year End Tax Guide
2011 Year End Tax Guide
 
HSBC Finance Corporation
HSBC Finance CorporationHSBC Finance Corporation
HSBC Finance Corporation
 
goldman sachs Second Quarter 2008 Form 10-Q
goldman sachs Second Quarter 2008 Form 10-Q goldman sachs Second Quarter 2008 Form 10-Q
goldman sachs Second Quarter 2008 Form 10-Q
 
Economic and-social-review-2012
Economic and-social-review-2012Economic and-social-review-2012
Economic and-social-review-2012
 
Contagion effect of greece debt crisis
Contagion effect of greece debt crisisContagion effect of greece debt crisis
Contagion effect of greece debt crisis
 
VAT in UAE - Real Estate Guide
VAT in UAE - Real Estate GuideVAT in UAE - Real Estate Guide
VAT in UAE - Real Estate Guide
 
The State of Domestic Commerce in Pakistan Study 9 - Real Estate in Pakistan
The State of Domestic Commerce in Pakistan Study 9 - Real Estate in PakistanThe State of Domestic Commerce in Pakistan Study 9 - Real Estate in Pakistan
The State of Domestic Commerce in Pakistan Study 9 - Real Estate in Pakistan
 
ComprehensiveAnnualFinancialReportFY07-08
ComprehensiveAnnualFinancialReportFY07-08ComprehensiveAnnualFinancialReportFY07-08
ComprehensiveAnnualFinancialReportFY07-08
 
GNW Q4-07%20%20GNW%20financial%20supplement
GNW Q4-07%20%20GNW%20financial%20supplementGNW Q4-07%20%20GNW%20financial%20supplement
GNW Q4-07%20%20GNW%20financial%20supplement
 
City of Chillicothe Comprehensive Annual Financial Report for 2011
City of Chillicothe Comprehensive Annual Financial Report for 2011City of Chillicothe Comprehensive Annual Financial Report for 2011
City of Chillicothe Comprehensive Annual Financial Report for 2011
 

Similar to INTERNATIONAL MONETARY FUND: Fiscal Regimes for Extractive Industries

Bcv informe económico 2009 en ingles.
Bcv informe económico 2009 en ingles.Bcv informe económico 2009 en ingles.
Bcv informe económico 2009 en ingles.Rafael Verde)
 
Bcv informe económico 2009 en ingles.
Bcv informe económico 2009 en ingles.Bcv informe económico 2009 en ingles.
Bcv informe económico 2009 en ingles.Rafael Verde)
 
Investor's Guide to the Global Airline Industry
Investor's Guide to the Global Airline IndustryInvestor's Guide to the Global Airline Industry
Investor's Guide to the Global Airline IndustryU.S. Global Investors
 
2017 to 2022 Outer Continental Shelf Oil & Gas Leasing Draft Proposed Progra...
2017 to 2022  Outer Continental Shelf Oil & Gas Leasing Draft Proposed Progra...2017 to 2022  Outer Continental Shelf Oil & Gas Leasing Draft Proposed Progra...
2017 to 2022 Outer Continental Shelf Oil & Gas Leasing Draft Proposed Progra...Dr Dev Kambhampati
 
Mergers acquisitions automotive_industry
Mergers acquisitions automotive_industryMergers acquisitions automotive_industry
Mergers acquisitions automotive_industryvivekmsk29
 
Wg11 petro
Wg11 petroWg11 petro
Wg11 petroStudying
 
It's not just about Alberta: Oilsands generate thousands of jobs, billions in...
It's not just about Alberta: Oilsands generate thousands of jobs, billions in...It's not just about Alberta: Oilsands generate thousands of jobs, billions in...
It's not just about Alberta: Oilsands generate thousands of jobs, billions in...Ports-To-Plains Blog
 
First Sporting Code V20081029.3
First Sporting Code V20081029.3First Sporting Code V20081029.3
First Sporting Code V20081029.3guestdd6bb4
 
The+Single+Market
The+Single+MarketThe+Single+Market
The+Single+Marketguest4310ad
 
GNW%20Q308%20QFS
GNW%20Q308%20QFSGNW%20Q308%20QFS
GNW%20Q308%20QFSfinance24
 
Links between Business Accounting and National Accounting UNSD, 2000
Links between Business Accounting and National Accounting UNSD, 2000Links between Business Accounting and National Accounting UNSD, 2000
Links between Business Accounting and National Accounting UNSD, 2000Fundação de Economia e Estatística
 
Agriculture and food security
Agriculture and food securityAgriculture and food security
Agriculture and food securityMondoloka
 
Study Showing U.S. Shale Drilling will Create 1.6M Jobs & $245B in 10 Years
Study Showing U.S. Shale Drilling will Create 1.6M Jobs & $245B in 10 YearsStudy Showing U.S. Shale Drilling will Create 1.6M Jobs & $245B in 10 Years
Study Showing U.S. Shale Drilling will Create 1.6M Jobs & $245B in 10 YearsMarcellus Drilling News
 
RL33359 Oil Shale History
RL33359 Oil Shale HistoryRL33359 Oil Shale History
RL33359 Oil Shale HistoryAnthony Andrews
 

Similar to INTERNATIONAL MONETARY FUND: Fiscal Regimes for Extractive Industries (20)

Bcv informe económico 2009 en ingles.
Bcv informe económico 2009 en ingles.Bcv informe económico 2009 en ingles.
Bcv informe económico 2009 en ingles.
 
Bcv informe económico 2009 en ingles.
Bcv informe económico 2009 en ingles.Bcv informe económico 2009 en ingles.
Bcv informe económico 2009 en ingles.
 
Investor's Guide to the Global Airline Industry
Investor's Guide to the Global Airline IndustryInvestor's Guide to the Global Airline Industry
Investor's Guide to the Global Airline Industry
 
CASE Network Report 79 - Economic Feasibility, General Economic Impact and Im...
CASE Network Report 79 - Economic Feasibility, General Economic Impact and Im...CASE Network Report 79 - Economic Feasibility, General Economic Impact and Im...
CASE Network Report 79 - Economic Feasibility, General Economic Impact and Im...
 
2017 to 2022 Outer Continental Shelf Oil & Gas Leasing Draft Proposed Progra...
2017 to 2022  Outer Continental Shelf Oil & Gas Leasing Draft Proposed Progra...2017 to 2022  Outer Continental Shelf Oil & Gas Leasing Draft Proposed Progra...
2017 to 2022 Outer Continental Shelf Oil & Gas Leasing Draft Proposed Progra...
 
Mergers acquisitions automotive_industry
Mergers acquisitions automotive_industryMergers acquisitions automotive_industry
Mergers acquisitions automotive_industry
 
Wg11 petro
Wg11 petroWg11 petro
Wg11 petro
 
Navarro Phase 1 Joint Venture Prospectus (1)
Navarro Phase 1 Joint Venture Prospectus (1)Navarro Phase 1 Joint Venture Prospectus (1)
Navarro Phase 1 Joint Venture Prospectus (1)
 
CASE Network Report 80 - Economic Feasibility, General Economic Impact and Im...
CASE Network Report 80 - Economic Feasibility, General Economic Impact and Im...CASE Network Report 80 - Economic Feasibility, General Economic Impact and Im...
CASE Network Report 80 - Economic Feasibility, General Economic Impact and Im...
 
It's not just about Alberta: Oilsands generate thousands of jobs, billions in...
It's not just about Alberta: Oilsands generate thousands of jobs, billions in...It's not just about Alberta: Oilsands generate thousands of jobs, billions in...
It's not just about Alberta: Oilsands generate thousands of jobs, billions in...
 
China coal mining market report sample pages
China coal mining market report   sample pagesChina coal mining market report   sample pages
China coal mining market report sample pages
 
India Chem Gujarat, 2017- Chemical Industry with focus to Gujarat & Specialit...
India Chem Gujarat, 2017- Chemical Industry with focus to Gujarat & Specialit...India Chem Gujarat, 2017- Chemical Industry with focus to Gujarat & Specialit...
India Chem Gujarat, 2017- Chemical Industry with focus to Gujarat & Specialit...
 
First Sporting Code V20081029.3
First Sporting Code V20081029.3First Sporting Code V20081029.3
First Sporting Code V20081029.3
 
Major Reforms
Major ReformsMajor Reforms
Major Reforms
 
The+Single+Market
The+Single+MarketThe+Single+Market
The+Single+Market
 
GNW%20Q308%20QFS
GNW%20Q308%20QFSGNW%20Q308%20QFS
GNW%20Q308%20QFS
 
Links between Business Accounting and National Accounting UNSD, 2000
Links between Business Accounting and National Accounting UNSD, 2000Links between Business Accounting and National Accounting UNSD, 2000
Links between Business Accounting and National Accounting UNSD, 2000
 
Agriculture and food security
Agriculture and food securityAgriculture and food security
Agriculture and food security
 
Study Showing U.S. Shale Drilling will Create 1.6M Jobs & $245B in 10 Years
Study Showing U.S. Shale Drilling will Create 1.6M Jobs & $245B in 10 YearsStudy Showing U.S. Shale Drilling will Create 1.6M Jobs & $245B in 10 Years
Study Showing U.S. Shale Drilling will Create 1.6M Jobs & $245B in 10 Years
 
RL33359 Oil Shale History
RL33359 Oil Shale HistoryRL33359 Oil Shale History
RL33359 Oil Shale History
 

Recently uploaded

(SUHANI) Call Girls Pimple Saudagar ( 7001035870 ) HI-Fi Pune Escorts Service
(SUHANI) Call Girls Pimple Saudagar ( 7001035870 ) HI-Fi Pune Escorts Service(SUHANI) Call Girls Pimple Saudagar ( 7001035870 ) HI-Fi Pune Escorts Service
(SUHANI) Call Girls Pimple Saudagar ( 7001035870 ) HI-Fi Pune Escorts Serviceranjana rawat
 
(ANIKA) Call Girls Wadki ( 7001035870 ) HI-Fi Pune Escorts Service
(ANIKA) Call Girls Wadki ( 7001035870 ) HI-Fi Pune Escorts Service(ANIKA) Call Girls Wadki ( 7001035870 ) HI-Fi Pune Escorts Service
(ANIKA) Call Girls Wadki ( 7001035870 ) HI-Fi Pune Escorts Serviceranjana rawat
 
Club of Rome: Eco-nomics for an Ecological Civilization
Club of Rome: Eco-nomics for an Ecological CivilizationClub of Rome: Eco-nomics for an Ecological Civilization
Club of Rome: Eco-nomics for an Ecological CivilizationEnergy for One World
 
GFE Call Girls Service Indira Nagar Lucknow \ 9548273370 Indian Call Girls Se...
GFE Call Girls Service Indira Nagar Lucknow \ 9548273370 Indian Call Girls Se...GFE Call Girls Service Indira Nagar Lucknow \ 9548273370 Indian Call Girls Se...
GFE Call Girls Service Indira Nagar Lucknow \ 9548273370 Indian Call Girls Se...Delhi Call Girls
 
Climate change and occupational safety and health.
Climate change and occupational safety and health.Climate change and occupational safety and health.
Climate change and occupational safety and health.Christina Parmionova
 
How the Congressional Budget Office Assists Lawmakers
How the Congressional Budget Office Assists LawmakersHow the Congressional Budget Office Assists Lawmakers
How the Congressional Budget Office Assists LawmakersCongressional Budget Office
 
WIPO magazine issue -1 - 2024 World Intellectual Property organization.
WIPO magazine issue -1 - 2024 World Intellectual Property organization.WIPO magazine issue -1 - 2024 World Intellectual Property organization.
WIPO magazine issue -1 - 2024 World Intellectual Property organization.Christina Parmionova
 
Call Girls Service Race Course Road Just Call 7001305949 Enjoy College Girls ...
Call Girls Service Race Course Road Just Call 7001305949 Enjoy College Girls ...Call Girls Service Race Course Road Just Call 7001305949 Enjoy College Girls ...
Call Girls Service Race Course Road Just Call 7001305949 Enjoy College Girls ...narwatsonia7
 
VIP Kolkata Call Girl Jatin Das Park 👉 8250192130 Available With Room
VIP Kolkata Call Girl Jatin Das Park 👉 8250192130  Available With RoomVIP Kolkata Call Girl Jatin Das Park 👉 8250192130  Available With Room
VIP Kolkata Call Girl Jatin Das Park 👉 8250192130 Available With Roomishabajaj13
 
(PRIYA) Call Girls Rajgurunagar ( 7001035870 ) HI-Fi Pune Escorts Service
(PRIYA) Call Girls Rajgurunagar ( 7001035870 ) HI-Fi Pune Escorts Service(PRIYA) Call Girls Rajgurunagar ( 7001035870 ) HI-Fi Pune Escorts Service
(PRIYA) Call Girls Rajgurunagar ( 7001035870 ) HI-Fi Pune Escorts Serviceranjana rawat
 
(VASUDHA) Call Girls Balaji Nagar ( 7001035870 ) HI-Fi Pune Escorts Service
(VASUDHA) Call Girls Balaji Nagar ( 7001035870 ) HI-Fi Pune Escorts Service(VASUDHA) Call Girls Balaji Nagar ( 7001035870 ) HI-Fi Pune Escorts Service
(VASUDHA) Call Girls Balaji Nagar ( 7001035870 ) HI-Fi Pune Escorts Serviceranjana rawat
 
PPT Item # 4 - 231 Encino Ave (Significance Only)
PPT Item # 4 - 231 Encino Ave (Significance Only)PPT Item # 4 - 231 Encino Ave (Significance Only)
PPT Item # 4 - 231 Encino Ave (Significance Only)ahcitycouncil
 
##9711199012 Call Girls Delhi Rs-5000 UpTo 10 K Hauz Khas Whats Up Number
##9711199012 Call Girls Delhi Rs-5000 UpTo 10 K Hauz Khas  Whats Up Number##9711199012 Call Girls Delhi Rs-5000 UpTo 10 K Hauz Khas  Whats Up Number
##9711199012 Call Girls Delhi Rs-5000 UpTo 10 K Hauz Khas Whats Up NumberMs Riya
 
High Class Call Girls Bangalore Komal 7001305949 Independent Escort Service B...
High Class Call Girls Bangalore Komal 7001305949 Independent Escort Service B...High Class Call Girls Bangalore Komal 7001305949 Independent Escort Service B...
High Class Call Girls Bangalore Komal 7001305949 Independent Escort Service B...narwatsonia7
 
Incident Command System xxxxxxxxxxxxxxxxxxxxxxxxx
Incident Command System xxxxxxxxxxxxxxxxxxxxxxxxxIncident Command System xxxxxxxxxxxxxxxxxxxxxxxxx
Incident Command System xxxxxxxxxxxxxxxxxxxxxxxxxPeter Miles
 
Call Girls Bangalore Saanvi 7001305949 Independent Escort Service Bangalore
Call Girls Bangalore Saanvi 7001305949 Independent Escort Service BangaloreCall Girls Bangalore Saanvi 7001305949 Independent Escort Service Bangalore
Call Girls Bangalore Saanvi 7001305949 Independent Escort Service Bangalorenarwatsonia7
 
VIP High Profile Call Girls Gorakhpur Aarushi 8250192130 Independent Escort S...
VIP High Profile Call Girls Gorakhpur Aarushi 8250192130 Independent Escort S...VIP High Profile Call Girls Gorakhpur Aarushi 8250192130 Independent Escort S...
VIP High Profile Call Girls Gorakhpur Aarushi 8250192130 Independent Escort S...Suhani Kapoor
 

Recently uploaded (20)

(SUHANI) Call Girls Pimple Saudagar ( 7001035870 ) HI-Fi Pune Escorts Service
(SUHANI) Call Girls Pimple Saudagar ( 7001035870 ) HI-Fi Pune Escorts Service(SUHANI) Call Girls Pimple Saudagar ( 7001035870 ) HI-Fi Pune Escorts Service
(SUHANI) Call Girls Pimple Saudagar ( 7001035870 ) HI-Fi Pune Escorts Service
 
(ANIKA) Call Girls Wadki ( 7001035870 ) HI-Fi Pune Escorts Service
(ANIKA) Call Girls Wadki ( 7001035870 ) HI-Fi Pune Escorts Service(ANIKA) Call Girls Wadki ( 7001035870 ) HI-Fi Pune Escorts Service
(ANIKA) Call Girls Wadki ( 7001035870 ) HI-Fi Pune Escorts Service
 
Club of Rome: Eco-nomics for an Ecological Civilization
Club of Rome: Eco-nomics for an Ecological CivilizationClub of Rome: Eco-nomics for an Ecological Civilization
Club of Rome: Eco-nomics for an Ecological Civilization
 
GFE Call Girls Service Indira Nagar Lucknow \ 9548273370 Indian Call Girls Se...
GFE Call Girls Service Indira Nagar Lucknow \ 9548273370 Indian Call Girls Se...GFE Call Girls Service Indira Nagar Lucknow \ 9548273370 Indian Call Girls Se...
GFE Call Girls Service Indira Nagar Lucknow \ 9548273370 Indian Call Girls Se...
 
Climate change and occupational safety and health.
Climate change and occupational safety and health.Climate change and occupational safety and health.
Climate change and occupational safety and health.
 
The Federal Budget and Health Care Policy
The Federal Budget and Health Care PolicyThe Federal Budget and Health Care Policy
The Federal Budget and Health Care Policy
 
How the Congressional Budget Office Assists Lawmakers
How the Congressional Budget Office Assists LawmakersHow the Congressional Budget Office Assists Lawmakers
How the Congressional Budget Office Assists Lawmakers
 
WIPO magazine issue -1 - 2024 World Intellectual Property organization.
WIPO magazine issue -1 - 2024 World Intellectual Property organization.WIPO magazine issue -1 - 2024 World Intellectual Property organization.
WIPO magazine issue -1 - 2024 World Intellectual Property organization.
 
Call Girls Service Race Course Road Just Call 7001305949 Enjoy College Girls ...
Call Girls Service Race Course Road Just Call 7001305949 Enjoy College Girls ...Call Girls Service Race Course Road Just Call 7001305949 Enjoy College Girls ...
Call Girls Service Race Course Road Just Call 7001305949 Enjoy College Girls ...
 
VIP Kolkata Call Girl Jatin Das Park 👉 8250192130 Available With Room
VIP Kolkata Call Girl Jatin Das Park 👉 8250192130  Available With RoomVIP Kolkata Call Girl Jatin Das Park 👉 8250192130  Available With Room
VIP Kolkata Call Girl Jatin Das Park 👉 8250192130 Available With Room
 
(PRIYA) Call Girls Rajgurunagar ( 7001035870 ) HI-Fi Pune Escorts Service
(PRIYA) Call Girls Rajgurunagar ( 7001035870 ) HI-Fi Pune Escorts Service(PRIYA) Call Girls Rajgurunagar ( 7001035870 ) HI-Fi Pune Escorts Service
(PRIYA) Call Girls Rajgurunagar ( 7001035870 ) HI-Fi Pune Escorts Service
 
(VASUDHA) Call Girls Balaji Nagar ( 7001035870 ) HI-Fi Pune Escorts Service
(VASUDHA) Call Girls Balaji Nagar ( 7001035870 ) HI-Fi Pune Escorts Service(VASUDHA) Call Girls Balaji Nagar ( 7001035870 ) HI-Fi Pune Escorts Service
(VASUDHA) Call Girls Balaji Nagar ( 7001035870 ) HI-Fi Pune Escorts Service
 
PPT Item # 4 - 231 Encino Ave (Significance Only)
PPT Item # 4 - 231 Encino Ave (Significance Only)PPT Item # 4 - 231 Encino Ave (Significance Only)
PPT Item # 4 - 231 Encino Ave (Significance Only)
 
##9711199012 Call Girls Delhi Rs-5000 UpTo 10 K Hauz Khas Whats Up Number
##9711199012 Call Girls Delhi Rs-5000 UpTo 10 K Hauz Khas  Whats Up Number##9711199012 Call Girls Delhi Rs-5000 UpTo 10 K Hauz Khas  Whats Up Number
##9711199012 Call Girls Delhi Rs-5000 UpTo 10 K Hauz Khas Whats Up Number
 
High Class Call Girls Bangalore Komal 7001305949 Independent Escort Service B...
High Class Call Girls Bangalore Komal 7001305949 Independent Escort Service B...High Class Call Girls Bangalore Komal 7001305949 Independent Escort Service B...
High Class Call Girls Bangalore Komal 7001305949 Independent Escort Service B...
 
Incident Command System xxxxxxxxxxxxxxxxxxxxxxxxx
Incident Command System xxxxxxxxxxxxxxxxxxxxxxxxxIncident Command System xxxxxxxxxxxxxxxxxxxxxxxxx
Incident Command System xxxxxxxxxxxxxxxxxxxxxxxxx
 
Call Girls Bangalore Saanvi 7001305949 Independent Escort Service Bangalore
Call Girls Bangalore Saanvi 7001305949 Independent Escort Service BangaloreCall Girls Bangalore Saanvi 7001305949 Independent Escort Service Bangalore
Call Girls Bangalore Saanvi 7001305949 Independent Escort Service Bangalore
 
Rohini Sector 37 Call Girls Delhi 9999965857 @Sabina Saikh No Advance
Rohini Sector 37 Call Girls Delhi 9999965857 @Sabina Saikh No AdvanceRohini Sector 37 Call Girls Delhi 9999965857 @Sabina Saikh No Advance
Rohini Sector 37 Call Girls Delhi 9999965857 @Sabina Saikh No Advance
 
Delhi Russian Call Girls In Connaught Place ➡️9999965857 India's Finest Model...
Delhi Russian Call Girls In Connaught Place ➡️9999965857 India's Finest Model...Delhi Russian Call Girls In Connaught Place ➡️9999965857 India's Finest Model...
Delhi Russian Call Girls In Connaught Place ➡️9999965857 India's Finest Model...
 
VIP High Profile Call Girls Gorakhpur Aarushi 8250192130 Independent Escort S...
VIP High Profile Call Girls Gorakhpur Aarushi 8250192130 Independent Escort S...VIP High Profile Call Girls Gorakhpur Aarushi 8250192130 Independent Escort S...
VIP High Profile Call Girls Gorakhpur Aarushi 8250192130 Independent Escort S...
 

INTERNATIONAL MONETARY FUND: Fiscal Regimes for Extractive Industries

  • 1. INTERNATIONAL MONETARY FUND Fiscal Regimes for Extractive Industries: Design and Implementation Prepared by the Fiscal Affairs Department Approved by Carlo Cottarelli August 15, 2012 Contents Page Acronyms and Glossary .............................................................................................................4 I. Introduction ............................................................................................................................7 II. Designing and Assessing EI Fiscal Regimes ......................................................................10 A. Key Tax-Relevant Characteristics of the EIs ..........................................................10 B. Objectives for Fiscal Regimes for EIs.....................................................................13 C. Overall Fiscal Schemes for EI .................................................................................15 D. Fiscal Instruments for EI .........................................................................................18 E. Understanding Tax Effects on Exploration, Development, and Extraction ............23 F. Scenario Analysis of Resource Tax Regimes: The FARI Model ............................25 G. Evaluation of Alternative Fiscal Regimes ..............................................................26 III. Administration and Transparency ......................................................................................29 IV. Revenues from EIs .............................................................................................................32 A. Government Revenues from the EIs .......................................................................32 B. Effective Tax Rates in Practice ...............................................................................34 V. Selected Current Issues .......................................................................................................35 A. Stability and Credibility ..........................................................................................35 B. International Issues ..................................................................................................37 C. Taxation and the Granting of Rights .......................................................................38 Tables 1. EI Revenue Potential: Selected African Countries ................................................................8 2. Fiscal Mechanisms in the EI: Evaluation against Key Objectives ......................................16 3. Fiscal Mechanisms in the EIs: Nature and Prevalence ........................................................22 4. Primary Government Objective and Relevant Mechanism .................................................28
  • 2. 2 Figures 1. Developments in Oil and Copper Prices ..............................................................................11 2. Oil Price Forecasts and Outturns .........................................................................................11 3. Composition of Revenue......................................................................................................23 4. Average Effective Tax Rates for Petroleum and Mining .....................................................27 5. Petroleum: Government Revenue by Country 2001–10 ......................................................33 6. Mining: Government Revenue by Country, 2001–10..........................................................33 7. Mining and Petroleum: Government Revenue by Country, 2001–10 .................................33 8. Petroleum: Government Revenue, 2001–10 ........................................................................34 9. Mining: Government Revenue, 2001–10 .............................................................................34 Boxes 1. Forms of Production Sharing ...............................................................................................17 2. Two Leading Forms of Rent Tax .........................................................................................20 3. EI Fiscal Regimes in Higher-Income Countries ..................................................................24 Appendices I. Key Points from Consultations with Civil Society Organizations (CSOs) and EI Companies ...........................................................................................................39 II. Technical Assistance on Extractive Industry Fiscal Regimes Since 2006 .....................41 III. Corporate Income Tax Issues of Special Importance for Extractive Industries .............43 IV. What “Uplift” Rate should be used in Rent Taxes? ........................................................48 V. Modeling the Impact of Fiscal Regimes on Resource Exploration and Exploitation .....49 VI. FARI Appraisal of Different Rent Tax Mechanisms ......................................................50 VII. Further Aspects of Effective EI Tax Administration ......................................................65 VIII. Revenue Data Used in this Paper ....................................................................................68 IX. Improving Data on Government Revenues from Natural Resources .............................70 X. Estimating Effective Tax Rates for EI Companies .........................................................72 Appendix Tables 1. Objectives and Measurable Indicators .................................................................................50 2. Petroleum Fiscal Regimes ....................................................................................................52 3. Project Examples .................................................................................................................54 4. Results with Oil Price Uncertainty ......................................................................................55 5. Mining Fiscal Regimes Evaluated .......................................................................................61 6. Gold Project Example ..........................................................................................................61 7. Results with Gold Price Uncertainty ....................................................................................64 8. Countries in the Sample .......................................................................................................68 9. Illustrative Calculations of the IETR for Mining .................................................................74 10. Illustrative Calculations of the IETR for Petroleum ..........................................................75
  • 3. 3 Appendix Figures 1. TA on Natural Resources Taxation by Sector, FY06–12 ....................................................41 2. Numbers of Missions and Other Activities by Year, FY06–12 ...........................................42 3. Evaluation of Petroleum Fiscal Mechanisms: Deterministic/Success Case Economics .....53 4. Results with Oil Price Uncertainty ......................................................................................55 5. EMV Analysis for 290 Million Barrel Oil Project ...............................................................58 6. Evaluation of Mining Mechanisms ......................................................................................63 7. Expected AETR with Gold Price Uncertainty .....................................................................64 8. Distribution of AETRs for Petroleum Companies ...............................................................76 Appendix Box 1. Expected Monetary Value for Exploration Decisions .........................................................57 References ................................................................................................................................78
  • 4. 4 ACRONYMS AND GLOSSARY ACE Allowance for Corporate Equity (for tax purposes) ACC Allowance for Corporate Capital (for tax purposes) Advance Pricing Agreement Agreement between tax authority and taxpayer as to method by which anticipated transactions will be valued for transfer pricing purposes AEO Annual Energy Outlook, US Department of Energy AETR Average Effective Tax Rate bl barrel BOE Barrels of Oil Equivalent (measurement unit for both oil and gas) Bonus Lump sum payment made for mineral (oil, gas, or mining) rights, or at contract signature, or at certain production thresholds Biddable Item that is open for bidding in auctions Booking of reserves Entering reserves in calculating the asset value of a company for stock exchange purposes Carried interest A participating interest in a project where the holder does not pay a commercial price for the interest or whose obligations are contributed (“carried”) in part by other parties CIT Corporate Income Tax Cost oil Portion of total production allowed for recovery of costs DROP Daily rate of production (a scaling method for sharing profit oil or gas) Fracking Hydraulic fracturing (injection of water, sand, and chemicals to fracture shale so that oil or gas can flow ) GAAP Generally Accepted Accounting Principles EI Extractive Industries EITI Extractive Industries Transparency Initiative EMV Expected Monetary Value FARI Fiscal Analysis of Resource Industries (FAD modeling system) Free equity Shares in a mining company allocated to a state entity for nil consideration (in practice often accompanied by tax concessions, or contribution of rights or infrastructure, and hence not strictly “free”) Gold plating Incurring costs beyond the minimum needed IETR Incremental Effective Tax Rate (Appendix X) LNG Liquefied Natural Gas (methane super-refrigerated to store and transport as liquid) LTBR Long-Term Bond Rate LTO Large Taxpayers Office MM Petroleum industry conventional term for “million” METR Marginal Effective Tax Rate NEIC National Extractive Industries Company NOC National Oil Company NPV (x) Net Present Value (at discount rate of x)
  • 5. 5 Petroleum Crude oil and natural gas Production Sharing Fiscal scheme for petroleum in which production at a surface delivery point is shared between a state entity and a private contractor PSC (or A) Production Sharing Contract (or Agreement) PRRT Petroleum Resource Rent Tax Profit oil Balance of production after subtraction of oil used for cost recovery Quasi-rents Rents attributable to past investments, or to factors of production in temporarily fixed supply Rents Revenues in excess of all necessary costs of production including the minimum rate of return to capital (sometimes “super-normal profits”) Ring Fence Fiscal boundary within which costs and revenues of companies in common ownership may be consolidated for tax purposes ROR Rate of Return Royalty Charge for the fact of extracting minerals, usually now ad valorem (a percentage of gross revenues), but can be a specific charge by volume or weight. May also vary with price. Term also used in “net profits royalty” where some costs are deducted, in which case similar to an income or rent tax. Henry Proposal A uniform resource rent tax…[using] an allowance for corporate capital system (Australia, Henry Report, 2010) Shale A compacted sedimentary host rock for unconventional oil or gas; its low permeability requires fracking for extraction SOE State-Owned Enterprise TA Technical Assistance Thin Capitalization Extensive use of debt, relative to equity, in financing a project or firm Treaty shopping Use of treaty networks to reduce total tax liability UJV Unincorporated joint venture (two or more companies acting together with undivided participating interests in a project; not the same legally as a partnership) Uplift Addition for tax deduction or cost recovery purposes to the cost of capital assets or of losses carried forward (the former sometimes “investment allowance,” the latter sometimes “accumulation rate”) VAT Value Added Tax VIT Variable Income Tax WACC Weighted Average Cost of Capital WEO IMF World Economic Outlook WHT Withholding tax WTI West Texas Intermediate (US oil price benchmark)
  • 6. 6 EXECUTIVE SUMMARY This paper suggests ways better to realize the revenue potential of extractive industries (EI—oil, gas, and mining), particularly in developing countries. This has become an increasingly important topic of IMF policy advice and technical assistance (TA), with recent discoveries in many developing countries lending it a new urgency. The paper sets out the analytical framework underpinning, and key elements of, the country-specific advice given. Revenues from the EI have major macroeconomic implications. The EIs often account for over half of government revenue in petroleum-rich countries, and for over 20 percent in mining countries. Dependence on EI revenues in resource-rich countries—now about one-third of the Fund’s membership—has increased, and this seems set to continue. Revenue objectives loom large in designing fiscal regimes for the EIs, but involve complex trade-offs. Generating employment in related activities, and addressing environmental impacts, can be significant concerns, but the revenue from the EIs is often the main benefit to the host country. It is the prospect of substantial rents—returns in excess of the minimum required by the investor, arising from relative fixity of supply of the underlying resource—that makes the EIs especially attractive as a potential source of revenue. Fiscal regimes for the EIs vary greatly, a wide range of instruments being used. The paper attempts to gauge how current regimes share rents between government and investor. Data analyzed here suggest that in mining, governments commonly retain one-third or rather more; simulations suggest higher government shares (40–60 percent), but do not capture all possible sources of revenue erosion. They also suggest that the government share is higher in petroleum:1 around 65–85 percent. Fiscal regimes that raise less than these benchmark averages may be cause for concern, or—where agreements cannot reasonably be changed— regret. Country circumstances require tailored advice, but a regime combining a royalty and a tax targeted explicitly on rents (along with the standard corporate income tax) has appeal for many developing countries. Such a regime ensures that some revenue arises from the start of production, and that the government’s revenue rises as rents increase with higher commodity prices or lower costs; in so doing, it can also enhance the stability and credibility of the fiscal regime (though processes to allow renegotiation may also be needed). It can also balance the challenges that each instrument poses for administration. Transparent rules and contracts tend to improve stability and credibility. Poorly designed international tax arrangements, however, can seriously undermine revenue potential. Effective administration is vital, but complex EI fiscal regimes and fragmented responsibilities are often major impediments. Royalties need not be as easy to administer, nor rent taxes so hard, as is sometimes believed. 1 Italics are used on the first occurrence of terms included in the Glossary at the start of the paper.
  • 7. 7 I. INTRODUCTION 1. This paper2 considers how best to realize the revenue potential of the extractive industries (EI—oil, gas, and mining), particularly in developing countries.3 Designing and implementing upstream fiscal regimes for the EIs—mining and petroleum (oil and gas)—is now a major focus of IMF policy support and technical assistance (TA; Appendix II).4 The aim here is to set out the conceptual approach and outline the techniques that guide staff advice.5 2. Amplifying the already considerable macroeconomic significance of EI, recent and prospective discoveries make designing and implementing EI fiscal regimes a key challenge—and opportunity—for many developing countries. These issues are important in G20 countries too, but it is in developing countries that the challenges are least familiar and most important for overall fiscal and wider performance. Appendix II describes the extent and growth of IMF TA on EI tax policy. 3. Large new developments, notably in oil, gas, and iron ore, are underway in several low-income countries (LICs) (Table 1). This trend seems likely to continue, as strong commodity prices continue to drive increased exploration and discoveries. New sources, such as shale gas (and other unconventional petroleum resources), offer opportunities in a range of countries, and new materials require expanding rare minerals production. Large volumes of resources likely remain to be discovered. Estimates from the Wealth of Nations database (World Bank, 2006 and 2010) indicate that the value of known subsoil assets per square kilometer of sub-Saharan Africa is barely one-quarter that for high-income countries. In recent years, proven reserves worldwide have increased while extraction rates have accelerated. No doubt most of this is due to technological change and high prices. Nevertheless, fiscal regimes seem to play a role: for example, fiscal regime revisions from 1991 onwards seem to have had a major role in expanding exploration and production in Angola’s deep water prospects. 2 The paper has benefited from consultation meetings with civil society and EI companies, and from an open call for comments: Appendix I summarizes the views expressed; submissions received are at http://www.imf.org/external/np/exr/consult/2012/NR/Comments.pdf), 3 Non-resource related revenues were discussed in a previous IMF policy paper, Revenue Mobilization in Developing Countries (http://www.imf.org/external/np/pp/eng/2011/030811.pdf) and other fiscal aspects of the management of resource wealth are addressed in the companion paper, Macroeconomic Policy Frameworks for Resource-Rich Developing Countries ( http://www.imf.org/external/np/pp/eng/2012/082412.pdf). 4 There are only four or so instances of Fund conditionality in this area over the last twenty years, the most recent being a structural benchmark for June 2012 on introducing a mineral resource rent tax in Sierra Leone. Conditionality related to EI transparency or auditing EI companies has been more common. 5 In this, it draws heavily on the recent FAD book, Daniel, Keen, and McPherson (2010).
  • 8. 8 Table 1. EI Revenue Potential: Selected African Countries Country/Project Mineral Investment US$bn Average annual revenue potential (US$bn, constant 2011 dollars; percent 2011 GDP) Lifespan of project(s) Ghana, Jubilee (Phase 1 only) Petroleum $3.15bn $0.85bn; 2.3 21 years Guinea, Simandou, and others Iron ore $4bn for mining project [with additional $6bn in railway and port infrastructure] $1.6bn; 30.7 21 years Liberia Iron ore, petroleum $4.5bn $1.7bn;1 147.8 20–30 years iron ore; potential 20+ for petroleum (but no proven project yet) Mozambique, Rovuma (gas) Tete (coal) Gas and coal $20-30bn $3.5bn;1 27.3 30–50 years Sierra Leone, various Iron ore, petroleum, diamonds $4.6bn $0.4bn; 18.2 15 years Tanzania Gas, Gold, Nickel $20-30bn $3.5bn;1 15.0 10–20 years gold (remaining in existing mines); 20-30 gas and nickel Source: IMF staff estimates. Note: Estimates are intended to show order of magnitude. Revenue projections are highly sensitive to assumptions about prices, phasing of production, and underlying production and capital costs. 1 Data represent annual revenue at peak production. 4. Revenue potential from oil is especially substantial. For East Africa, Gelb, Kaiser, and Viñuela (2012) estimate exploration and development costs at $6–14 per barrel; applying these costs across sub-Saharan Africa as a whole with oil at $80 per barrel, and assuming that governments secure 50 percent of the excess of price over cost (and many regimes in the region seem likely to capture more), increasing production by 1 million barrels per day would increase government revenue in the region annually by about $12 billion, or 1 percent of the 2011 GDP of sub-Saharan Africa.6 Angola alone increased production by 1 million 6 Includes Sudan, now both Sudan and South Sudan.
  • 9. 9 barrels per day over 2001–11, while more than doubling its proven reserves. Sub-Saharan Africa as a whole increased proven reserves by 50 percent over this period (to 68 billion barrels), so the increase in daily production over 10 years could well exceed 1 million barrels. In iron ore, sub-Saharan Africa has reserves that can provide an estimated 120 years of total world supply (out of about 500 available globally).7 If all these reserves could be developed, and the government revenue resulting were to be apportioned (improbably) over 500 years, the annual revenue addition would be about 0.7 percent of the region’s 2011 GDP.8 5. Country-level simulations confirm this potential. The interaction of geology, prices, fiscal regimes, and technology changes makes accurate forecasting of likely revenue additions impossible. Nevertheless, using (admittedly crude) assumptions for sub-Saharan Africa, discovery and development of a single additional oil field in each of at least 18 countries with petroleum potential would add in a year nearly 2 percent of collective GDP to the revenue of these countries in the peak production years of these fields. The country by country impact differs widely. Natural gas may have similar potential. 6. The central fiscal issue is ensuring a ‘reasonable’ government share in the rents often arising in the EIs. ‘Rents’—the excess of revenues over all costs of production, including those of discovery and development, as well as the normal return to capital—are an especially attractive tax base as they can, in principle, be taxed at up to 100 percent without making the activity privately unprofitable. There are, however, substantial obstacles making this effectively impossible—which will be a central concern below. By ‘reasonable’ is meant a sharing that at least provides private investors with an adequate incentive to explore, develop, and produce; beyond that, views on reasonableness may well differ. 7. The paper is structured as follows. Section II explores the key features of EI sectors that bear on fiscal regime design and then considers the design and assessment of EI fiscal regimes; Section III examines revenue administration and transparency; Section IV examines what is known (which is too little) about government revenues from EIs; and Section V considers some of the most pressing current and emerging issues. Appendices elaborate on key technical issues. 7 Estimate by BHP Billiton, Presentation at the Geological Society of London by Andrew Mackenzie, “Mineral Deposits and their Global Strategic Supply,” December 14, 2011. 8 Staff calculations assuming CIF iron ore price of $107 per ton (current WEO), overall costs of $70 per ton, and government share of surplus over costs at 40 percent.
  • 10. 10 II. DESIGNING AND ASSESSING EI FISCAL REGIMES This section outlines the tax-relevant distinctive features of EIs and then the main issues in designing and assessing fiscal instruments, both individually and in combination.9 A. Key Tax-Relevant Characteristics of the EIs 8. Prominent among these are  Potentially sizable rents arise. These are an especially attractive tax base on efficiency grounds—and on equity grounds too if, as is often the case, they would otherwise accrue to foreigners.  Pervasive uncertainty, most obviously but not only on commodity prices, the most fundamental difficulty being less their wide variability (Figure 1) than the difficulty of predicting them (Figure 2).10 Substantial uncertainty also arises in relation to geology, input costs, and political risk (ranging from expropriation to changes in future fiscal regimes, including those potentially arising from climate and environmental policies).  Asymmetric information. Private investors undertaking exploration and development, for instance, are likely to be better informed than host governments on technical and commercial aspects of a project; the host government will be better informed on its own future fiscal intentions.  High sunk costs, creating time consistency problems. EI projects commonly involve very substantial upfront outlays by investors that cannot be cashed in if the project is terminated. The balance of negotiating power thus shifts dramatically from investor to host government once these costs are sunk. Even the best-intentioned government has an incentive to offer attractive fiscal terms before a project is begun, but afterwards— as the tax base becomes much less elastic—reset the regime in its own favor; and investors’ awareness of this can discourage investment (the “hold-up” problem), to the detriment of both sides.  Extensive involvement of multinational enterprises in many countries…raises complex tax issues (with multinationals likely more expert than most developing country administrations) and sensitivities on sharing the benefits from national resources. 9 These issues are discussed, and valuable materials provided, by the Natural Resource Charter (www.naturalresourcecharter.org) and the World Bank-supported Extractive Industries Sourcebook (www.eisourcebook.org). 10 The IMF Research Department has produced numerous studies on the topic in recent years, for example Bowman and Husain (2004) and Reichsfeld and Roache (2011).
  • 11. 11 Figure 1. Developments in Oil and Copper Prices 140 130 120 110 100 90 80 70 60 50 40 30 20 10 0 Crude oil (real 2011 prices) 1970 1972 1974 1976 1978 1980 1982 1984 1986 1988 1990 1992 1994 1996 1998 2000 2002 2004 2006 2008 2010 2012 Source: IMF WEO database. 11,000 10,000 9,000 8,000 7,000 6,000 5,000 4,000 3,000 2,000 1,000 0 Copper (real 2011 prices) 1975 1977 1979 1981 1983 1985 1987 1989 1991 1993 1995 1997 1999 2001 2003 2005 2007 2009 2011 $US per ton Figure 2. Oil Price Forecasts and Outturns $US per barrel 140 120 100 80 60 40 20 0 U.S. Department of Energy Annual Energy Outlooks (AEO) 1982-2012 (2010 U.S. Dollar per Barrel) AEO 2012 AEO 2011 AEO 2010 AEO 2008 AEO 2007 AEO 2001 AEO 1985 AEO 1991 AEO 1995 AEO 2005 1970 1975 1980 1985 1990 1995 2000 2005 2010 2015 2020 2025 US$ per barrel 145 135 125 115 105 95 85 75 65 55 45 35 25 15 WEO Oil price Forecasts 2003-2012 (Monthly prices, 2010 U.S. Dollar per Barrel) Oct 2008 Sep 2004 Sep 2011 Apr 2012 2002 2003 2004 2005 2006 2007 2008 2009 2010 2011 2012 2013 2014 2015 2016 US$ per barrel Sources: U.S. Department of Energy Outlook (1982, 1985, 1991, 1995, 2000, 2004–08, and 2009–12); and IMF World Economic Outlook (2003–12). After Ossowski et al. (2008). Note: Solid lines on the left chart are spot West Texas Intermediate (WTI) oil prices; on the right chart are WEO average of WTI and Fateh. The dashed lines are price projections. Apr 2010 Sep 2003 Sep 2005 Apr 2004 Apr 2011 Apr 2008 Oct 2009 Apr 2009 Sept 2006 Apr 2007 Apr 2006 Apr 2005 Oct 2010
  • 12. 12  …and of state-owned enterprises (SOEs) in others, potentially easing asymmetric information issues but also raising concerns on the efficiency of operations and allocation of taxing responsibilities.  Producers may have substantial market power where they control a significant part of global deposits. In mining, for example, most internationally traded supplies of iron ore are shipped by just three companies; Saudi Arabia is widely viewed as able to influence oil prices.  Exhaustibility. The importance of the finiteness of petroleum and mineral deposits to long-term economic performance and commodity price developments is questionable.11 At project level, however, exhaustibility can be a major concern; a key opportunity cost of extracting today is the future extraction foregone. 9. It is the scale and combination of these characteristics that distinguishes EIs. Exhaustibility aside, the other features are found elsewhere: pharmaceutical companies, for instance, face considerable uncertainty in their research activities, and natural monopoly features can create substantial rents in telecoms. But in other sectors, these rarely rise to the same level of macroeconomic significance (though it may be that some of the lessons learned in taxing EIs will come to be applied to other sectors). 10. There are important differences between the oil, gas, and mining sectors. Exploration is often costly and riskier for petroleum (a deep water well, for instance, can cost over US$100 million, and the chance of success in a new basin may be 1 in 20 or less). But the risks in the ‘development’ phase (bringing a discovery to extraction), and of failure during the extraction phase, may be greater for mining. Mining may also involve greater political and environmental risks, being typically based on land rather than offshore,12 and so more disruptive of communities. 11. Commercial structures tend to differ between petroleum and mining. For tax, financing, or sometimes technological reasons, unincorporated joint ventures (UJV) have been common in petroleum projects, with capital separately provided by the partners and production shared. This sets up conflicting interests from which tax authorities can benefit in controlling costs. UJVs have been much less common in mining, with major companies owning majority stakes in locally-incorporated vehicles. 12. The EI sectors, especially oil and gas, are entering a period of change. ‘Fracking’, (hydraulic fracturing), becoming viable at current prices, enables fuller exploitation of onshore unconventional oil and gas, making their extraction more similar to conventional 11 Proven oil reserves, for instance, have continued to rise despite increasing consumption levels. 12 There are exceptions, such as offshore diamond dredging in Namibia.
  • 13. 13 mining. In copper mining, production has continued to accelerate despite declining grades of ore mined, as development of new techniques has markedly increased processing efficiency. And the transparency agenda is transforming both the openness of many private EI companies and what is expected of host governments. 13. Resource-rich countries differ widely in ways that matter for tax design. Beyond the large differences in their reliance (potential and actual) on EI revenues are structural differences germane to the choice of fiscal regime. There are differences too in standard (and likely appropriate) tax practice between oil, gas, and mining. In some countries, there are likely to be only one or a few major projects (such as uranium or niobium in Malawi), whereas in others there are many, and the expectation of more to come (as in Iraq). In some countries (Guinea, Lao PDR, Sierra Leone, Tanzania), constraints set by past agreements are tight for existing projects and change is possible only slowly by mutual agreement; most have greater scope in designing regimes for future projects. In some, known deposits will soon be fully exploited (oil in Yemen, Bahrain, and Indonesia). Some have strong traditions and national sentiments favoring state participation (in Mexico, for instance, this is a constitutional constraint, while it is standard in many middle-eastern countries, notably Iraq, Kuwait, and Saudi Arabia); others do not. Countries exploiting oil fields spanning borders (especially where disputed) face distinct tax issues. Far from least, administrative capacity and governance standards differ massively. 14. Many developing countries have large numbers of artisanal miners—notably for gold and precious stones. Historically this was a large sector in Brazil; it is now substantial in, for example, Sierra Leone, Suriname, Tanzania, Thailand, and Zambia. Operations have often been illegal but encouraged by exchange controls or restrictions on channels of sale for minerals. These operations are not considered at length in this paper: the fiscal issues (though not environmental, or law and order issues) have more in common with small scale agriculture than with large scale mining. Nevertheless, good practice appears to lie in attempting to levy royalties by requiring traders to withhold and pay (rather than attempting to tax miners directly, except perhaps for a small license fee) and otherwise ensuring that consumption taxes are levied and collected in mining areas. B. Objectives for Fiscal Regimes for EIs 15. Though not their only concern, revenue is generally a primary source of potential benefit to host countries. Employment creation, directly and in related activities, minimizing community disruption, and addressing environmental consequences are also common priorities—especially though not only for onshore activities. Many such objectives can have implications for fiscal regime design, but the focus here is on core issues of revenue-raising. A key objective is thus to maximize the present value of net government revenues from EI, an objective best served by taxes explicitly targeted on rents: by definition,
  • 14. 14 any other tax leads to distortion that reduce those rents, and hence the amount of revenue that can be raised. 16. There are limits to the rate at which rents can be taxed—but little guidance as to precisely what a ‘fair’ or ‘reasonable’ sharing might be. Several obstacles to full taxation of rents arise. Asymmetric information means that host governments (as principal) generally need to forego some rents in order to provide appropriate incentives for better-informed producers (their agent).13 Practical difficulties arise in accurately observing revenues and costs, and from tax avoidance devices. 17. Designing a tax on rents also requires careful attention to costs at all stages of production, beginning with exploration (including unsuccessful): returns in excess of the minimum required after costs have been sunk in exploration and development—sometimes called ‘quasi-rents’—cannot be taxed at 100 percent without making the overall venture ex ante unprofitable. Tax competition may also play a role: even though the resources themselves are immobile, limited availability of technical expertise and specialist equipment may limit the number of areas in which exploration and production can take place, so that those offering more favorable tax treatment will be favored. Fairness considerations in themselves say little about how rents should be shared, though some see an intrinsic right for the host government to extract the maximum return from its ownership of natural resources. 18. The timing of receipts, not just the level, may be important. Where access to credit markets is limited—or simply as a result of political myopia—governments may prefer revenue to accrue early in the life of a project. On the other hand, willingness to defer revenue (through lower royalties, or accelerated depreciation, or greater reliance on rent taxes) may reduce perceived risk to investors and thus the expected return they require before deciding to explore or develop. 19. Efficient risk-sharing between government and investor may limit the value of ‘progressivity’ in EI fiscal regimes for some developing countries… The ‘progressivity’ of a fiscal regime—meaning, roughly speaking,14 the extent to which revenue increases as the price of the commodity rises or production costs fall—shapes the sharing of risk between the two sides. Efficiency requires that more risk be borne by the party better able to bear it. In developing country contexts, this may often be private investors, given their ability to diversify across deposits (though the exposure of even large multinationals to single large projects should not be underestimated). This calls for fiscal regimes that are not especially 13 Suppose, for instance, that only producers know whether extraction costs will be high or low. Then a fiscal regime which left no rents when these costs are low would mean that no producer could make a profit when they are high—even though such a project might yield large pre-tax rents and so be socially desirable. 14 The term is used very imprecisely in discussions of resource taxation. One might also define it, for instance, in terms of how the present value (PV) of taxes varies with the lifetime PV of a project.
  • 15. 15 responsive to commodity prices, so that the investor gains most of the upside while the government is protected on the downside.15 20. …but this may conflict with a desire for revenues to increase with current prices. Limited progressivity also means that revenues increase less when commodity prices (or project returns) are high, which can cause incumbents political difficulty. By the same token, progressive regimes, being more politically robust, may be more credible.16 The more diverse a country’s portfolio of projects, moreover, the less strong is the risk-sharing argument against progressivity. 21. Ease of administration (for the authorities) and compliance (for taxpayers) are ubiquitous concerns—just as in all areas of taxation. 22. Governments differ in the relative importance attached to these objectives. Those hosting many projects, for instance, or with strong credit market access, may care less about ensuring early payment by each in isolation. Those with ready access to alternative sources of revenue may be less concerned by risk-sharing. Political pressures to show acceptable revenue from national assets, acceptably responsive to current prices, can be powerful. Table 2 summarizes these potential government objectives as criteria against which to evaluate the individual fiscal devices set out in Section II.D. C. Overall Fiscal Schemes for EI 23. There are two main approaches to fiscal regime design for EI: contractual schemes (including production sharing or service contracts), and tax/royalty systems with licensing of areas. The latter dominates in mining; for oil and gas, both are common; and some countries use a hybrid. A third possibility is for payment largely as the construction of physical infrastructure; such packages are now mainly associated with investment from China, but were also a feature of investment from Europe in the 1970s. In all cases, the overall framework can be combined with state participation. It is possible to design economic terms that are equivalent under alternative approaches (Daniel, 1995), but these likely imply different structures of operational control. 24. The apparent contrast between the two broad schemes is deceptive. Case-by-case negotiation is possible under either and not just under contractual systems. Tax and royalty schemes prevailed historically since resource owners (private or public, and if public sometimes sub-national) charged specific or ad valorem royalties, with the remaining 15 Such an arrangement also limits the macroeconomic challenges of managing volatile revenue flows. 16 Boadway and Keen (2010) set out a simple model of political economy in which this is the case; Nellor and Robinson (1984) provide an early argument to the same effect. Stroebel and van Benthem (2010) explore, theoretically and empirically, the link between contract structure and expropriation risk, finding, for instance, that (in the present terminology, and consistent with the thrust of the argument here) regimes are more progressive in price the lower are the costs incurred by an expropriating government.
  • 16. 16 Table 2. Fiscal Mechanisms in the EI: Evaluation against Key Objectives Bonus Royalty Sliding-scale Royalty Resource Rent Tax CIT and VIT State Participation Maximize government NPV: All risk onto investor, hence lowest expected government revenue. But, early revenue. Useful bidding mechanism to mop up expected rent. Deters some projects and fails to capture upside from projects that go ahead. Different effect on different projects; likely deterrent to low grade/high cost projects. Captures higher expected NPV for the government in return for government taking on more risk. Relatively neutral and progressive. Vulnerability to thin capitalization. If fully non-concessional (Brown Tax) would maximize government expected revenue in return for taking on equal share of risk. However, usually some concessional element, hence distortions. Progressivity when higher returns result from price. No response: regressive (bonus reflects expected, not actual prices). Regressive: government share of profit falls as commodity prices rise. Different effect (share of profit) on different projects. Effectively captures upside; but higher share maybe deferred. Reduces burden for low prices. Instant VIT response to profitability changes. Free equity is regressive (as is dividend withholding tax (DWT)); carried equity progressive. Progressivity when higher returns result from lower costs. No response: regressive. Does not respond: regressive. Does not respond: regressive. Captures upside however caused. Automatically lowers burden on high cost projects. Instant VIT response to cost changes. Free equity is regressive; carried equity progressive. Neutrality—avoid distorting investment and operating decisions (and thereby dissipate revenue potential). Impact on exploration decisions; no impact on development or operating decisions. Risks deterring marginal projects and shortening life/ reducing production of viable projects. Different effect on different projects, hence distortions. High risk that parameters mis -specified. Neutral: share is only paid by projects that actually exceed minimum return. Depends on parameter design. Potential distortion in VIT from depreciation (step-change in rate). Free/carried equity has negative impact on exploration decisions. Ensure adequate incentives for investment. Increases exploration risk, but relatively neutral if part of competitive bid. Deterrent if too high; increased risk of unviable projects. Depends on parameters. Reduces investor upside: likely deterrent. Modest deterrent as long as sufficient upside left with investor. Effective as long as maximum rate is not set too high. Perceived negatively by investors unless fully non-concessional; but some risk mitigation benefits. Risk to government. Minimizes government risk, Risk onto investor. Risk onto investor. Risk (of no revenue, or only late in life) onto government. Government taking on risk if minimum VIT rate is below CIT rate. Depends on terms: free equity acts like a DWT— low risk; carried equity like a RRT—higher risk. Minimize administrative burden and risks. Simple to administer; Relatively simple calculations, but measurement, and valuation risks. Complex: requires multiple parameters for each mineral. Net margin royalty requires definition of margin. Relatively simple. Same data as required for income tax. Simple additional calculation (for cash flow RRT). Same data for VIT as required for CIT. Simple additional calculation of rate. Complex. Leads to pressure for negotiation at expense of other fiscal elements.
  • 17. 17 business income from EI subject otherwise to normal business taxation. Most European and North American jurisdictions continued this pattern while introducing more targeted taxation of resource rents. In the developing world, however, the desire for public expression of full sovereignty over resources led to development of contractual schemes: fee-for-service contracts where existing industries were fully nationalized, and production-sharing where governments desired still to attract private investment (Indonesia was the pioneer of this scheme in the mid-1960s). Contractual schemes commonly developed where national oil companies (NOCs) were granted an effective monopoly of rights to resources in the ground, with the right to make contracts with foreign providers of investment and services. 25. Under production sharing contracts (PSC), common in petroleum, a contractor recovers costs by retaining some of the physical product as ‘cost oil/gas’ and the remaining ‘profit oil/gas’ is shared with the government. Box 1 describes the leading variants that are sometimes made with the aim of increasing the government’s profit share on more profitable projects. Box 1. Forms of Production Sharing Daily Rate of Production (DROP) Government share of profit petroleum increases with the daily rate of production from the field or license, often with several tiers. Weaknesses are that field size is often a poor proxy for profitability and the mechanism is not progressive with respect to oil prices or costs. Attempts have been made to blend this with a scale of prices. Cumulative production from project Government share of profit petroleum as total cumulative production increases—again an inaccurate proxy for the contractor’s rate of return. Such schemes are becoming rarer. ‘R-Factor’ Government’s profit share increases with the ratio of contractor’s cumulative revenues to contractor’s cumulative costs (the ‘R factor’). This improves on DROP in being a more direct measure of profitability, but does not recognize the time value of money (Box 2). Rate of Return (ROR) This is a form of rent tax (provided that exploration is part of costs) under which the government’s share is set by reference to the cumulative contractor rate of return, no tax being levied if that falls short of some benchmark rate. Single or multiple tiers are used, though staff analysis suggests a single tier is effective. 26. Staff advice works within both systems, emphasizing design to achieve fiscal efficiency and regime transparency in either case. The choice of overall framework will be determined, at least in part, by institutions and tradition, and by non-financial objectives. Companies also work within both schemes, though major oil companies tend not to favor contractual forms unless these permit “booking” of reserves under stock exchange rules. Some companies have preferred the PSC because it fills legal gaps and provides one comprehensive document covering operations; that though is equally achievable with a petroleum agreement under a tax and royalty system.
  • 18. 18 27. The renewed popularity in developing countries of resource investments coupled with infrastructure contributions presents different challenges. In principle, these are not complex: they require a cost-benefit analysis of whether the infrastructure contributions, when valued with risk apportioned, offer a payment for resources that is equivalent to the likely take from any foregone royalty or tax, and if not whether the mode of infrastructure delivery provides offsetting benefits. Arriving at such an assurance, however, is in practice difficult. D. Fiscal Instruments for EI 28. Within these broad approaches, a wide range of instruments is used. This subsection considers each from a design perspective; implications for administration and compliance are addressed in Section III. 29. Bonus payments (signature, discovery, and production bonuses)—can be part of any fiscal scheme. Bonuses are single (or sometimes staged) lump sum payments triggered by events; they can be set in legislation or negotiated, and could be biddable. Bonuses in some petroleum exploration rights auctions have been very large (over $1 billion as a top bid in Angola’s 2006 round) but are much more modest, for example, in the USA’s offshore auctions. Signature bonuses become a sunk cost for companies that they may recover only in the event of successful development, and even then the fact that they are sunk may pose new political risk if a project is especially profitable. 30. Royalties on gross revenues17 have the attraction of providing government revenue from the start of production. But, since they are a simple addition to cost, they can make the extraction of some resource deposits unviable. They are an implicit depletion policy (since the range of feasible projects is narrowed) and an invitation to negotiate. Where royalties form a major part of the overall fiscal regime, they tend to become more complex because refinements are needed to make them responsive to profitability (using proxy measures like price, location, or production level). Royalty rates that vary with price have easy appeal but, by definition, do not vary with costs and so will not be appropriate across the marginal cost curve of possible mines; moreover, any rate scale geared to prices requires frequent adjustment when forecasts are wrong.18 31. Royalties can be rationalized as correcting for possible overexploitation, but the practical importance of this is unclear. For instance, the interest of a firm will be misaligned with the social interest if it receives no payment for resources left in the ground at 17 Otto et al. (2006) provide a detailed account of issues and experiences with royalties. Royalties as a specific charge on a unit of production are now little used for major EI. 18 Both Mongolia (2007) and Zambia (2008) attempted introduction of windfall taxes that were effectively price-related additional royalties; both quickly withdrew them.
  • 19. 19 the end of the contract period. The government can correct this by charging a royalty that reflects the diminution in the terminal value of the resource (Conrad, Hool, and Nekipelov, 2009). In practice, however, extraction rights are usually granted for long periods, and renewable if further extraction seems warranted, so that contractors will internalize impacts on terminal values unless a significant charge is levied for renewal. 32. The use of gross royalties protects revenue against overstatement of cost, but too little knowledge of costs can weaken the government’s position. Companies can reduce profit-related taxes by increasing deductible costs, and gross royalties can be used to guard against this.19 But if royalties yield significant revenue and prices fall, companies will argue for reduced rates and governments will have no sound basis to challenge their case if they have not been closely monitoring costs. “Net profits” royalties and related schemes (popular in both North and South America) have the character of income taxes more than royalty; the name usually persists because of attribution to a sub-national tier of government. 33. The corporate income tax (CIT) is a core component of most EI fiscal regimes. Application of the CIT to the EIs is needed to ensure that the normal return to equity is taxed at corporate level just as in other sectors. Some countries apply a higher than standard rate on the usual CIT base (as in Indonesia in mining, and Nigeria and Trinidad and Tobago in petroleum); others have separate income tax regimes addressing sector-specific issues (the most important of which are addressed in Appendix III). A variable income tax (VIT) uses the CIT base, but varies the rate of tax according to the ratio of profits to gross revenues. This is relatively simple but may introduce distortions, particularly if a high rate of tax applies when a period of high accounting profit occurs early in the life of a project, before the required return has been earned. The VIT may also increase debt-bias unless deduction of interest is limited to the standard rate of CIT. 34. A variety of taxes explicitly target EI rents (Box 2). Since it taxes the full return to investors, including the required return to equity holders, the CIT is a blunt instrument for reaching rents. A high CIT rate, for instance, can discourage investment by increasing the required pre-tax return; a tax on rents does not. The CIT is also biased toward debt-financing, since (with rare exceptions) interest is deductible whereas the cost of equity capital is not. Other tax instruments, such as royalties, also cause distortions whose effect is to erode the total of pre-tax rents to be shared between government and operator. Rent taxes aim to preserve that surplus, and to transfer a substantial part of it to government. Though equivalent, in principle in being non-distorting, alternative forms of rent tax differ importantly, not least in the timing of the government’s receipts. 19 Box 7 of Boadway and Keen (2010) spells out how.
  • 20. 20 Box 2. Two Leading Forms of Rent Tax1 1. The ‘Brown Tax,’ or ‘R-based cash flow tax,’ has as its base all current receipts less all current expenses (both non-financial), with immediate refund (or carry forward at interest) when this is negative. Accounting and tax depreciation do not feature—all capital is immediately expensed—and there are no deductions for interest or other financial costs. There are two main variants:  Resource rent tax. This replicates many features of the Brown Tax, with the investor receiving an annual uplift on accumulated losses until these are recovered. (As originally designed by Garnaut and Clunies Ross (1975) the uplift rate is set at the minimum required rate of return for the investor; this choice is now widely questioned, as discussed in Appendix IV). Australia uses this scheme for both mining and petroleum, while Angola’s production-sharing scheme uses the mechanism. It is usually applied with ring-fencing by license.  Tax surcharge on cash flow. Adjusting accounting profit by adding back depreciation and interest, and deducting any capital expenditure in full, yields a base of net cash flow. This, too, could form the base for a surcharge. Instead of permitting an annual uplift for losses carried forward, a simple uplift (investment allowance) could be added to capital costs at the start—this is done in the United Kingdom by a time-limited uplift on losses. In the UK, this surcharge is combined with conventional CIT, within the same sector-wide ring fence. The “R-factor” or payback ratio scale used in some PSCs is a further variant, as is the “investment credit” of Indonesian PSCs. 2. Allowance for Corporate Equity (ACE) or Capital (ACC) schemes. The former amends the standard CIT by providing a deduction for an imputed return on book equity; tax depreciation remains, but becomes irrelevant in that faster depreciation reduces equity and hence future deductions by an offsetting amount. The latter also gives the interest deduction at a notional rate, so eliminating any distinction between debt and equity finance. Norway’s special petroleum tax approximates the ACC, though its combination of uplift on total investment and limitation on interest deduction differs from a “pure” ACC. It also offers refund of the tax value of exploration losses and of ultimate losses on licenses. In 2010, the Henry Report proposed for Australia “a uniform resource rent tax…[using] an allowance for corporate capital system” (Henry Proposal). Several countries (Belgium, Brazil, Italy, and others) apply ACE-type schemes as their main corporate tax.2 A central difference between these two types of rent tax is the timing of tax payments—which is generally earlier under the ACE/ACC. Under the Brown Tax, tax is payable only at the perhaps distant date in which costs have been fully recovered; under the ACE/ACC by contrast, it is payable as soon, roughly speaking, as annual income covers the annual cost of financial capital. A key and contentious issue for both types is the choice of imputed rate of return (for carry forward under the Brown Tax and for capital costs under the ACE/ACC; Appendix IV). __________________________ 1 Boadway and Keen (2010), Land (2010) and Lund (2009) provide detailed discussions of rent taxation in the EI. The first shows that there is, in principle, an infinite number of non-distorting tax schemes; the focus here is on the most common in practical discussions. 2 Klemm (2007).
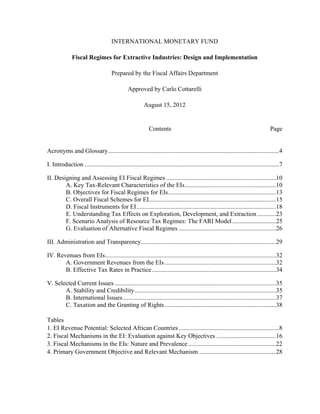
  • 21. 21 35. Use of resource rent taxation is increasing, notably in petroleum but also in mining. Staff advice in developing countries has usually been to combine one of the devices shown in Box 2 with a royalty to make up the combined ‘resource charge’: the balance between the two is determined in specific cases by the relative ability to bear risk and the government’s tolerance for potential delay in revenue. The trade-off can be finessed by using a device such as the ACC, where depreciation allowances (instead of cash flow deductions) advance tax payments, or the cash flow surcharge with limited-time uplift. Any measure that brings forward revenue in this way causes a counterpart increase in investor risk and thus may ultimately diminish rent available for taxation. 36. State equity is used by many countries to secure additional government take (beyond tax revenue) from profitable projects. This is sometimes motivated by non-fiscal concerns: a desire for direct government ownership, a “seat at the table,” or to facilitate the transfer of knowledge. But these benefits could also be achieved by regulation (Sims, 1985). State equity can take different forms. Fully paid-up equity on commercial terms puts the government on the same footing as a private investor—akin to a Brown Tax (Box 2). Under a carried interest arrangement, the private company finances the government participation with the cost, including interest charges, offset against the future state share of production, proceeds, or profits—again equivalent to a Brown Tax. Or the government may negotiate free equity—equivalent to a dividend withholding tax (DWT) as a charge on profits, though this usually leads to some offset against other tax payments. Instrument choice in practice 37. A wide range of mechanisms is used, though there is little evidence on their relative yields.20 The final columns of Table 3 show the frequency with which instruments are used in a sample of 25 mining regimes and 67 petroleum regimes analyzed by staff. There is considerable variation both within and across mining and petroleum. In the mining cases, royalties are ubiquitous while production sharing and bonuses are absent; in petroleum, one-sixth of cases have no royalties, nearly one-half have production sharing, and just under 20 percent have bonuses. And even with the mining royalty regimes, there is considerable variation in the precise form. Information on the relative revenue importance of these instruments is hard to find (even from the survey of IMF desks). Figure 3 reports the breakdown in two cases. 20 There are many variations on each theme and the distinction between different mechanisms is often blurred —elements from different mechanisms may be combined, or multiple mechanisms applied in a single regime. Classification in this analysis is for convenience only, but reflects reasonably common usage.
  • 22. 22 Table 3. Fiscal Mechanisms in the EIs: Nature and Prevalence Mechanism Description Prevalence Number of countries Mining Petroleum Signature bonus Up-front payment for acquiring exploration rights. Commonly used as a bid parameter (Notably for petroleum in the US offshore continental shelf) 1 16 Production Bonus Fixed payment on achieving certain cumulative production or production rate None 10 Royalties Specific (amount per unit of volume produced) 2 1 Ad-valorem (percentage of product value) 17 31 Ad-valorem progressive with price 1 9 Ad-valorem progressive with production 8 Ad-valorem progressive with operating ratio/profit 3 1 Royalty applied to operating margin (net profits 2 0 royalty) State, provincial, and/or local CIT1 Rate of corporate income tax at the state, provincial, or local level in addition to federal level. Common in Canada and the U.S. as a province/state resource charge in addition to federally imposed CIT. 2 5 Variable income tax CIT where the tax rates increase with the ratio of taxable income to revenue, between an upper and lower bound 32 None Resource rent taxes Cash flow with accumulation rate/uplift. Can be assessed before or after CIT. 5 5 Cash flow with limited uplift on losses (UK). (surcharge tax on cash flow) None 2 Allowance for Corporate Capital None 13 Allowance for Corporate Equity None 14 Other additional income taxes Other profit taxation mechanisms that do not fall under any of the categories above 1 3 Production sharing Fixed production share None 5 Cumulative production None None R-Factor: ratio of cumulative revenues to cumulative None 13 costs Rate of return, pre- or post-tax None 3 Production Level None 13 State participation Free equity: government receives percentage of dividends without payment of any costs 2 None Carried equity: government contributions met by investor and recovered from dividends with interest 3 8 Paid equity: government pays its share of costs None 19 Social investments/infrastructure Resource companies build infrastructure or make other social investments (hospitals, schools, etc). 1 6 Number of countries 25 67 Source: IMF FARI Database. 1 In addition to Canada and the United States, Argentina, Italy, and the Russian Federation impose provincial, local, and state CIT, respectively. All countries in the sample impose corporate income tax (CIT) with the exception of the cases where VIT is used. 2 VIT is used in Botswana, South Africa (in gold mining), and Zambia. 3 Norway. 4 Italy.
  • 23. 23 Figure 3. Composition of Revenue Oil (Chad, 2010) Copper (Chile, 2009) Royalty Income tax Statistical fees 28% 3% 69% Royalty Income tax Revenue from state-owned 4% company 29% 67% Source: Data compiled for this paper. Source: Data compiled for this paper. 38. Some 80 percent of world petroleum reserves are controlled by state companies and 15 of the 20 largest oil companies are state-owned. In all of these, the government (or NOC) pays for the private services it contracts and sometimes uses ingenious types of service contracts to approximate the risk-reward arrangements of PSCs. Except for Iraq’s contracts, these systems do not allow private firms to “book” reserves under SEC rules—for which they will seek compensation. 39. Several G20 and high-income countries have scope to tax EI rents more effectively. Although not the principal focus of this paper, Box 3 provides a summary of some key issues and experiences. E. Understanding Tax Effects on Exploration, Development, and Extraction 40. Taxation potentially affects decisions at all stages—exploration, development, and production—and in potentially complex ways. Key margins of choice include the intensity of exploration, the timing and intensity of initial development, the timing and intensity of extraction and enhanced (or secondary) recovery, and the eventual abandonment of the mine or oil field. No single model has satisfactorily encompassed all these dimensions. For this paper, Smith (2012) develops a manageable framework (Appendix V) for analyzing the behavioral impact of tax design in a coherent framework capturing the full lifecycle of EI activities.21 Simulations described in Smith (2012) highlight a range of considerations. 21 Though designed and calibrated for oil and gas projects, the model could easily be adapted for mining.
  • 24. 24 Box 3. EI Fiscal Regimes in Higher-Income Countries Recent debates in, for example, Australia and Brazil, and reviews of mineral royalties in the United States and the Russian Federation, make clear that weaknesses in the design of fiscal regime are not limited to developing countries or new producers. In many of these countries too, more effective fiscal regimes could make a significant contribution to meeting intensified revenue needs. As stressed in IMF (2010): “Most [G20 countries] are sufficiently able to diversify the risks of natural resource exploitation to make profit/cash flow based instruments more efficient than fixed fees and royalties, yet some—including the U.S and Russia—still place heavy reliance on the latter. Movement toward explicit rent taxation, and use of auctions, could produce a marked revenue enhancement. This is not to argue that average effective tax rates are necessarily low…but that tax structures could be modified both to promote investment and to secure for governments higher shares of resource rent in profitable projects.” Among major producers:  The U.S. uses auctions with bonus bidding for the Outer Continental Shelf, coupled with corporate income tax (CIT) and royalties; onshore, and for mining, both public and private resource owners mainly impose gross revenue royalties although net profit royalties are also common in some states.  Russia operates a complex and distorting system combining a royalty, export taxes, and different prices for domestic sales and exports. In both Russia and the U.S., alternatives have been much debated but not adopted.  Canadian provinces have moved rapidly toward profit or cash flow related taxes on oil and gas (including unconventional shale-sourced petroleum), though these are still (confusingly) called “royalties.”  Norway has perhaps the closest to a pure rent tax (in ACC form), coupled with CIT, for its North Sea oil and gas under a system also noted for its stability.  The United Kingdom began oil and gas production with a more complex (and frequently changed) system, but in recent years has used a cash flow tax as a surcharge to the CIT. Both the U.K. and Norway effectively refund the tax value of losses.  Australia has explored differing approaches to petroleum and mining. From 1987, offshore petroleum was subject to a petroleum resource rent tax (PRRT) imposed as deductible for CIT, but onshore petroleum and all mining remained subject to state royalties and CIT. In 2010, the government proposed for all EI a version of the allowance for corporate capital scheme (the Henry Proposal)—conventional tax depreciation was used, with uplift of losses and undepreciated balances carried forward at the government’s Long-Term Bond Rate (LTBR); government guaranteed ultimate refund of the tax value of losses. The rate was to be 40 percent, deductible for CIT; and the CIT rate was to be reduced over time to 25 percent. After an outcry from mining companies (and a change in the composition of the government) the proposal was replaced with a Minerals Resource Rent Tax (MRRT) which now applies to iron ore and coal only. The MRRT applies at an effective 22.5 percent rate, after uplift on cash outflows of LTBR, plus 7 percentage points, and allows for crediting of state royalties. At the same time, the PRRT was extended to apply to onshore activities.
  • 25. 25 41. The impact on exploration depends on the total government take in the event of success, interacting with tax offsets and the probability of success. The decision to explore rests on comparing the fixed cost of drilling with the probability of success (updated as exploration progresses) and the return conditional on successful discovery. Simulations in Smith (2012) suggest that a tax regime with government take of approximately 50 percent of quasi-rents in the event of success (ring-fenced, so that exploration costs do not attract immediate tax reduction) reduces the acceptable number of exploratory failures appreciably, by 15–25 percent. 42. Royalties, and production sharing agreements (PSAs) that create effective royalties, can plausibly cause significant distortion. For instance, a 20 percent royalty or a 40 percent minimum profit oil share to the state (allowing only 50 percent of available oil for production costs) reduce initial investment by some 20 percent and the extraction rate by approximately 1 percentage point per year. The same terms delay investment in enhanced recovery by 1 or 2 years, with a further overall investment reduction of 20 percent. 43. A resource rent tax may increase investment if the uplift rate on capital expenditure exceeds the company’s cost of capital. This circumstance leads to a negative marginal effective tax rate, and thus an implicit subsidy to resource extraction (Mintz and Chen, 2012). This incentive to “gold plating” (inflating costs), or suboptimal timing of investment (sooner rather than later) depends on both the excess of the uplift rate over the cost of capital and the resource rent tax rate; where both are low, the incentive is small (Appendix IV). 44. It is important to consider tax effects over the full project cycle. The sequential nature of the process means that distortions at one stage likely impose distortions at others, too. Effects emerge more subtle than the impact of taxation of quasi-rents on exploration decisions. High royalty rates, for instance, are associated with longer production lifetimes— somewhat counter-intuitive, this is because the expectation of high royalty rates leads to lower development investments, which imply higher marginal extraction costs. Total extraction over this expanded lifetime remains smaller than without the tax. F. Scenario Analysis of Resource Tax Regimes: The FARI Model 45. FAD’s model for the Fiscal Analysis of Resource Industries (FARI)—presented in some detail in Appendix VI—is now widely employed by staff in country and TA work. Excel-based, it enables detailed design, modeling, and comparison of fiscal regimes across the entire lifecycle of petroleum or mining projects. It is also increasingly used as a forecasting tool linked to the macro-economic framework for resource-rich countries. It does not incorporate behavioral responses of the kind just discussed, though extensions of the
  • 26. 26 model can simulate tax effects on investors’ perceived risk.22 46. One key output of FARI is project-specific estimation of the government tax take under alternative fiscal regimes, alternative prices, and other outcomes. This is captured by the “Average Effective Tax Rate” (AETR): the government’s share of pre-tax net present value (NPV), usually measured at the government’s assumed discount rate. By way of illustration, Figure 4 reports estimated AETRs for a range of actual fiscal regimes in both mining and petroleum. These show that most petroleum fiscal regimes have a higher AETR and include more progressive elements than do mining regimes. G. Evaluation of Alternative Fiscal Regimes 47. Table 4 evaluates several families of mechanism against a range of criteria capturing the objectives set out above.23 The judgments there reflect both general principles and quantitative analysis, using the FARI Model, sketched in Appendix VI. Table 4 uses those results to match instruments to government objectives.24 48. No regime is ideal for all, but for LICs combining a modest ad valorem royalty, CIT, and resource rent tax has considerable appeal. The first ensures some revenue whenever production is positive. The second ensures that the normal return to equity is taxed at corporate level in EI as in other sectors and, moreover, that foreign tax credits will be available where investing companies’ home countries (notably the US) tax them on worldwide income. And the third exploits the distinct revenue potential of the EIs. Such a framework can be applied across a wide range of circumstances and work for oil, gas, and mining projects, though the balance between mechanisms and parameters may differ.25 There may be scope for other instruments, too: if there is competitive allocation of licenses or contracts, for example, then either a bonus or some parameter of the fiscal regime could be a bid variable (though of course use of a bidding system will affect the design of the fixed tax elements in the system). 22 FARI is similar to other simulation frameworks used for scenario analysis within the petroleum industry (Tordo, 2007) but specifically adapted for staff tax policy advice and for linkage to the macro-framework. 23 These criteria are adapted from Daniel et al. (2010). 24 Such simulations likely overestimate government take, as they take no account of the use of international tax and financing structures to reduce tax payments or the opportunity to deduct costs from one project against revenues from another if there is no ring-fencing, and do not allow for imperfections of implementation. 25 There are interactions between the CIT and rent tax which means that the latter, even if deductible from the former, in general ceases to be neutral.
  • 27. 27 Figure 4. Average Effective Tax Rates (AETR) for Petroleum and Mining Petroleum: Oil Field - 20% 40% 60% 80% 100% Mining: Iron Ore Mine Example Angola; PSC 2006 Sri Lanka; PSC Norway; Offshore Equatorial Guinea; PSC Ghana; PSC 2008 Indonesia; Deep Water Timor-Leste; PSC Malaysia; Deep Water Mozambique: PSC Vietnam; PSC 2010 Liberia; PSC Nigeria; PSC Australia; PRRT ACC Henry Proposal Brazil Argentina Source: IMF staff calculations using FARI model and database. Project Description Field: 300 MMBbl Size: 298 MMBOE Costs: $21.0 BOE Oilprice: $100 Bbl IRR pre tax: 56% AETR at zero discount rate AETR at 10% discount rate - 20% 40% 60% 80% 100% Zambia; Budget 2012 Guinea; Mining Code 2011 Liberia ; LRC2010 Sierra Leone; NMA2009 Australia; MRRT Chile; General regime Canada; British Columbia Brazil; General regime Peru; General regime South Africa; iron China; Iron Project: Iron Project small Size: 76.7 MM tonnes Unit costs: ConstReal $41 Iron Ore FOB price: ConstReal $80 IRR pre-tax: 44.4% AETR at zero discount rate AETR at 10% discount rate
  • 28. 28 Table 4. Primary Government Objective and Relevant Mechanism1 Signature Bonus Flat Royalty Sliding-scale Royalty Resource Rent Tax (and ACE) CIT/VIT State Participation Maximizing government share over project life X X Securing early revenue X X Ensuring adequate incentives for exploration X X Visible share of commodity price increases X Strategic ownership interest X Maximize resource utilization X X Minimize administrative burden and risks X X 1Includes production-sharing equivalents of tax and royalty devices.
  • 29. 29 49. A suitable tax structure and a target range of AETRs result from this analysis. These simulations, and those of other sources, suggest reasonably achievable ranges of discounted AETRs will be 40–60 percent for mining26 and 65–85 percent for petroleum. 50. In some LICs, a focus on immediate revenue gains from EI projects is perhaps inevitable. Most of these will come from improved tax administration. Retrospective changes of terms will usually damage the prospects for future investment. That said, there is room in a properly designed system for bonuses, for royalties, and for shifting revenue forward by taxing gains on transfers of interest (Appendix III). III. ADMINISTRATION AND TRANSPARENCY Administration27 51. There is no intrinsic reason for effective and transparent administration of EI fiscal regimes—critical for both revenue and investor confidence—to be harder for EI than other industries. They are simpler than other industries (such as finance and telecoms) in that they involve physical operations with outputs that can be analyzed, weighed, and measured, with prices in most cases quoted on international exchanges. And the vast bulk of revenues is often paid by a few large taxpayers, with a high stake in maintaining government goodwill. 52. Administration is nonetheless often difficult and badly performed. The (often excessive) variety and complexity of EI fiscal regimes often pose serious challenges; important tax rules are often complex, unclear, or open to abuse. Even with just a few EI companies, countries often struggle to cope with routine processing and reporting, hampering effective filing and payment enforcement. Royalty administration is often particularly inefficient, with frequent assessments, no annual return, and no reconciliation to commercial accounts and CIT returns. Fragmented administration prevents development of coherent risk-based audit and taxpayer service functions. Pay, status, and authority for operational staff are often inadequate to recruit staff of the quality required. 53. An efficient structure for administration of the fiscal regime may require changing the responsibilities of EI ministries and any national EI companies (NEICs). 26 Aside from the special case of large-scale diamond mining where government shares have often been higher. 27 Guidelines for effective EI tax administration are reviewed briefly here and set out in more detail in Appendix VII. Staff of the IMF and World Bank are working together on detailed guidelines for administering EI fiscal regimes.
  • 30. 30 Fragmented tax-type-based administration of the kind still common for EI revenues has many well-known disadvantages. The allocation of fiscal responsibilities to EI regulators and NEICs furthermore weakens their focus on their main roles. Self-assessment, a basic principle for effective tax administration that tax authorities in LICs often fail to apply, fits even less well into the culture and practices of NEICs and EI regulators, whose normal regulatory and commercial roles require real-time intervention. They often lack tax audit capacity, and outsource their audit function, a decision that should not rest merely on the fact that this function has been allocated to non-tax agencies. There is a fundamental conflict of interest when the NEIC combines fiscal and commercial responsibilities. To preserve integrity, fiscal roles within the EI ministry/NEIC should be clearly separated from regulatory and commercial roles. Putting the former in the tax department is the most obvious and effective way to do that.28 54. Claims that administration of profit/rent-based EI taxes is so hard for LICs that they should rely on royalties instead are often misplaced:  Royalties are not always as easy to administer as is sometimes claimed… The ease of valuing sales should not be overstated. Although pricing from benchmarks may reduce transfer pricing risks, it is technically demanding, particularly for mining; and “netback” of processing, transportation, and other costs from benchmark refined mineral prices to establish market value at mine gate or export point can be challenging, posing similar difficulties to income-based taxes. In some cases, there are no international benchmark prices on which to base valuation. Regulations or advance pricing agreements to establish monitorable, transparent valuation formulae may be possible, but require considerable administrative sophistication.  …and profit/rent-based taxes are not necessarily as hard. Most LICs apply CIT to complex activities, such as banking and telecoms, even if sometimes accompanied by turnover taxes; and there is no special reason it should not apply to the EIs. Rent taxes can then be designed to require the same data, with a less complex calculation: the R-based cash flow tax, for instance, avoids any need to calculate depreciation, financial costs, or gains on license transfers. Angola, despite exceptional capacity constraints successfully applies production-sharing scaled to internal rates of return. 55. The principles of effective modern tax administration are equally relevant to the EIs but too often are not applied in practice. They include simple, well-designed 28 There is a case for the EI ministry retaining responsibility for physical audit. This is consistent with its regulatory role, requires real-time intervention and specialist mineralogical skills, and is distinct from normal tax administration functions (where natural resources are exported, this function is sometimes allocated to Customs, whose responsibilities likewise require real-time physical intervention). Sharing information from physical audit with the tax administration is vital, and often needs improvement, and it would still be the tax department’s function to reconcile reported volumes with taxpayers’ returns and financial records.
  • 31. 31 legislation with a minimum number of taxes; an integrated, function-based organizational structure; coherent, self-assessment-based procedures; and taxpayer-focused compliance risk management. But fragmentation of fiscal policy and administration often makes them difficult to implement (and also weakens the focus of EI ministries and NEICs on their own responsibilities, creating conflict and confusion of roles). Reforming this flawed approach can, however, be extremely disruptive, and also face major political obstacles. 56. Strengthening EI revenue administration is an increasing focus of FAD TA. But since this paper does not aim to discuss general principles of tax administration reform, its importance, and the weight given to it in FAD TA, are not fully reflected in this brief discussion. Nevertheless, there are immediate gains available from simple steps to improve audit (Appendix VII). Transparency 57. The risk that resource wealth will undermine governance is well documented.29 Tax policy design and administration may not be the greatest areas of concern, but here too transparency is vital, and often lacking. One-off confidential agreements make the law opaque, and the negotiation process is open to abuse. Government accounting for resource revenues is often poor and unreliable. 58. Governments often make achieving transparency difficult. Multiple taxes; contract confidentiality; complicated, inefficient, and incoherent filing and payment procedures; responsibilities for returns and payments fragmented across different agencies, with different banking arrangements and separate accounting and IT systems; revenues paid in kind; and no single department responsible for accounting for assessment and collection: all create non-transparency for no good reason. 59. The Extractive Industry Transparency Initiative (EITI), to which many resource-rich countries subscribe, has had some success, but many countries still do not tackle the underlying issues. EITI requires EI companies to publish what they pay, and governments what they receive, and that these amounts be audited and reconciled. (Confidentiality barriers must be removed.) Initiatives extending this approach now include Section 1504 of the US Dodd-Frank Act, requiring SEC-listed EI companies to report payments to governments; similar disclosure is required by a proposed modification of the EU Transparency Directive. While EITI has led to important progress, more needs to be done. For example, some countries now publish one-off tax agreements, but have not moved to taxing companies on the basis of published legislation. And government accounting remains poor. 29 The IMF’s Guide on Resource Revenue Transparency (2007) considers the issues comprehensively.
  • 32. 32 IV. REVENUES FROM EIS This section reviews revenue raised from the EIs. A. Government Revenues from the EIs 60. Data on government revenues from the EIs are poor—a current IMF initiative aims to improve them. Difficulties include the sector-specific and conventionally “non-tax” nature of many of the instruments used (bonuses, royalties and production sharing, or concessional state participation, for instance), the need to identify resource-related components of the CIT and other standard instruments, and fragmented and inefficient data collection across ministries and agencies. The Statistics Department plans pilot work toward routine collection of such data (Appendix VIII). The discussion that follows uses data provided by country desks on 57 resource-rich countries for 2001–10 (Appendix IX). 61. Government revenue from EIs is substantial in many countries, with reliance especially high in some developing countries (Figures 5–7, the last covering countries for which revenue cannot be distinguished by sector.) Petroleum revenue can be especially large: over 10 percent of GDP in 22 countries. These revenues are also substantial in many advanced and emerging economies, but dependence upon them is especially marked in some developing economies: revenues from petroleum accounted for about 93 percent of all government revenue in Timor-Leste (2008), for instance, and around 82 percent in Angola (2007).30 30 Not discussed here are the implications of resource revenues for non-resource tax policies. The data assembled for this paper suggest that a one percentage point increase in EI-related revenue (in percent of GDP) is associated with a reduction in other revenues of around 0.2 points—broadly consistent with estimates for oil in Bornhorst, Gupta, and Thornton (2009) and reported for resources in sub-Saharan Africa in IMF (2011).
  • 33. 33 Figure 5. Petroleum: Government Revenue by Country 2001–10 70 60 50 40 30 20 10 Oman Source: IMF staff estimates. Angola Congo Republic Figure 6. Mining: Government Revenue by Country, 2001–10 20 18 16 14 12 10 Source: IMF staff estimates. 100 90 80 70 60 50 40 30 20 10 Venezuela Chad Norway Sudan Syria Mexico Ecuador Malaysia Cameroon Myanmar Uzbekistan Ivory Coast Namibia United Kingdom Figure 7. Mining and Petroleum: Government Revenue by Country, 2001–10 20 18 16 14 12 10 8 6 4 2 Source: IMF staff estimates. 0 0 Iraq Kuwait Libya Brunei Timor-Leste Saudi Arabia Equatorial Guinea Algeria Nigeria Qatar Bahrain Yemen United Arab Emirates Iran Trinidad and Tobago Azerbaijan Kazakhstan Niger Philippines percent Total Revenue percent GDP Avg revenue %GDP Avg revenue %total revenue 50 45 40 35 30 25 20 15 10 0 5 0 2 4 6 8 Botswana Mongolia Chile Guinea Zambia Kyrgyz Republic Lesotho Ghana Sierra Leone Tanzania percent Total Revenue percent GDP Avg revenue %GDP Avg revenue %total revenue 50 45 40 35 30 25 20 15 10 5 0 0 Russia Bolivia Papua New Guinea Vietnam Indonesia Mauritania DRC Colombia Australia Brazil Canada percent Total Revenue percent GDP Avg revenue %GDP Avg revenue %total revenue
  • 34. 34 62. Revenues from the EIs increased over the past decade, most consistently in petroleum producing countries (Figures 8 and 9).31 Revenues from petroleum rose in the countries shown from an average (GDP-weighted) of 8 percent of GDP to 12 percent, and from 26 percent of government revenue to 35 percent. For mining countries, the increase in revenue has been somewhat less marked relative to GDP, but much greater (and very volatile) relative to all government revenue—reflecting that mining-intensive countries are relatively low income, so tend to have fewer alternative revenue sources. In both sectors, revenues appear to have moved more or less in line with commodity prices (movement in mining tracking less the strong rise in gold prices than the evolution in the prices of the other main metals—copper, aluminum, iron ore, tin, nickel, zinc, lead, and uranium). In neither case (and this emerges too from simple regressions) is there sign that revenues are strongly progressive in current prices, though this would be hard to detect from these data for oils given that price movements may also powerfully affect the denominator of the revenue/GDP ratio. Figure 8. Petroleum: Government Revenue, 2001–10 Figure 9. Mining: Government Revenue, 2001–10 Source: IMF staff calculation using data described in Appendix VIII. 30 25 20 15 10 5 mineral revenue, %GDP (weighted avg) mineral revenue, % tot revenue (weighted avg) Gold Price Index (2005=100) Commodity Metals Price Index (2005=100)* Source: IMF staff estimates. 200 180 160 140 120 100 80 60 40 20 0 B. Effective Tax Rates in Practice 63. Appendix IX elaborates on two complementary (but crude) methods to evaluate (somewhat different concepts of) effective tax rates on EI activities: simulation methods (using the FARI model described below), and analysis of accounting data. Each method has its strengths and weaknesses: simulation exercises, for instance, can take full account of all taxes over the lifetime of a project, but require the analyst to project future prices and costs and may overstate effective tax rates as they do not capture all possible sources of revenue 31 Similarly, EI exports rose from a weighted average of 7.7 percent of GDP in 2001 to 12.3 percent in 2010. Petroleum dominates these exports, though its share decreased over this period from 93 percent to 87 percent. 40 35 30 25 20 15 10 5 - 2001 2002 2003 2004 2005 2006 2007 2008 2009 2010 Price Index percent oil revenue, %GDP (weighted avg) oil revenue, % tot revenue (weighted avg) Crude Oil (petroleum) Price index (2005=100) 300 250 200 150 100 50 0 - 2001 2002 2003 2004 2005 2006 2007 2008 2009 2010 Price Index percent *includes Copper, Aluminum, Iron Ore, Tin, Nickel, Zinc, Lead, and Uranium Price Indices
  • 35. 35 erosion (through imperfect administration, for instance); accounting data reflect actual outcomes, but provide only a snapshot across a miscellany of activities.32 The results are thus no more than suggestive—and the methods capable of further refinement. 64. These exercises suggest that effective tax rates are commonly higher in petroleum (around 65–85 percent) than in mining (45–65 percent), and increase with earnings, most markedly for petroleum. These conclusions broadly match general perceptions on these issues. 65. The reasons for these differences between petroleum and mining are not fully understood. Possible explanations include that the expectation of rents, and the shaping of fiscal regimes to capture them, may simply be longer established for petroleum (mineral commodity prices having until fairly recently been in a slow decline that most thought would continue); the perception of greater non-fiscal benefits from mining (especially relative to offshore oil) may have led to more intense tax competition; and/or asymmetric information (on exploration and development risk), with related administrative challenges (from the absence of spot prices for some commodities, for instance) may have been a greater constraint in mining. While in some respects currently narrowing (rent capture having emerged as a greater a focus in mining), it may be that these differences will reassert themselves: some see substantial potential supply that will dilute rents in minerals, whereas in petroleum, restricted access to reserves and increasing costs of marginal production (Canadian oil sands or ultra-deep water) mean that significant rents for lower cost producers will remain. V. SELECTED CURRENT ISSUES A. Stability and Credibility 66. Stability and credibility of the fiscal regime for the EIs—critical to overcoming the hold-up problem—do not necessarily require a contractual assurance of fiscal stability. Such an assurance is unlikely to substitute for a credible commitment by government to maintain predictability in its fiscal regime. Predictability is needed not only for the fiscal regime itself but, not least, for a process and/or criteria by which a regime may be modified (Daniel and Sunley, 2010; Osmundsen, 2010).33 67. A stability assurance can have the strengths and weaknesses of fiscal rules more generally (Debrun and Kumar, 2008). For the government, it may be a commitment 32 Staff experimented with a third method, comparing companies’ actual market values with estimates of what, given reserves and current costs and prices, it would be expected to be in the absence of taxes. Further work is needed, however, to have reasonable confidence in the results. 33 Investment agreements may also have an important role in relation to expropriation risk.
  • 36. 36 technology aimed at binding all parts of government and future governments. Or it could be a signaling device aimed principally at encouraging other investors to enter. In some cases, it could function as a ‘smokescreen,’ with the government intending to make less visible changes to other aspects of the legal arrangements over time. The value to investors is not always clear—and if the assurance has to be invoked, relations with government have already broken down to a point where continued operation will be hard. General legislation versus imposition by contract 68. Administrative costs, political difficulties, and, probably, investors’ perceived risk can be reduced by legislating terms applicable to all EI projects. The alternative of setting them out in a model agreement can make them little more than a basis for negotiation. 69. The advantages to governments of case-by-case negotiation of fiscal terms are frequently exaggerated, requiring as they do detailed knowledge of the prospective profitability of a deposit, about which investors are likely to be better informed.34 They also require concentration of administrative effort, negotiating skills, and detailed assessment of each investor’s requirements which, in many circumstances, may be difficult to achieve. 70. Countries that have attracted substantial mining investments in recent decades have used general fiscal terms rather than case-by-case negotiation. These include not only advanced countries such as Australia, Canada, or Norway, but also Bolivia, Brazil, Chile, Indonesia, Namibia, Peru, and South Africa. Use of general rather than negotiated terms seems much more prevalent in South America than it remains in sub-Saharan Africa. 71. Sometimes negotiation is inevitable.35 The key for governments is then access to project-specific information (for example, known deposits), to information on fiscal regimes available elsewhere, and to expert advice. A general rule favoring publication of negotiated outcomes deters corruption, and is more likely to produce an outcome that is sustainable and in the mutual interests of host country and companies. 72. While the obligation to respect contracts is vital, renegotiations do and sometimes should occur. Renegotiation can be warranted when terms have become egregiously out of line with international practice, or with terms in comparable 34 Optimal tax design in the presence of asymmetric information in principle requires offering a menu of fiscal regimes: for instance, one involving a royalty and high rate rent tax, another no royalty and a lower rate of rent taxation (the former appealing where the investor knows the project to be high cost)—as in Box 6 of Boadway and Keen (2010), for instance. Negotiation might be seen as a way of presenting such a menu of options, too complex to set out in legislation. The theory remains far from practical implementation, however, and a willingness to negotiate carries implications for relative bargaining strengths. 35 The Fund’s policy has been not to advise on specifics of (re)negotiations, while recognizing that it is when these are taking place—indeed, especially then—that advice on general EI fiscal regimes is most valuable.
  • 37. 37 circumstances: no contract can anticipate all conceivable outcomes. When this happens through consultation, or by mutual agreement, the investment climate may be strengthened rather than weakened. In contract schemes, provisions for periodic reviews are increasingly common. B. International Issues 73. International tax issues for the EIs merit more attention than they have often received.36 Most of these issues are not specific to the EIs, and are of increasing importance to developing countries more generally—but they arise with special force in the EIs. 74. The tax treatment of gains on the transfer of an interest in mining or petroleum rights has become a pressing and controversial issue. This has become a major concern as large gains were achieved by sellers in transactions in exploration projects, for example, in Ghana and Uganda; the tax amount at issue in one case in the latter, for instance, was around $400 million.37 Appendix III reviews the highly complex and very material tax issues that arise. 75. Tax treaties sometimes erode the tax base of EI projects. They frequently reduce permitted levels of border WHTs or even eliminate them altogether. “Treaty shopping”— routing and characterizing remittances so as to exploit advantageous treaty provisions—can substantially reduce withholding tax (WHT) obligations on dividends, interest, and management or technical service fees. Developing countries with substantial investment inflows to EI sectors, and negligible outward investments of their own, need to design treaty strategies that minimize base erosion and consider adopting rules against treaty shopping. 76. Vulnerability to abusive transfer pricing exists for EI as for other sectors. Higher taxes on upstream activities increase this risk, the companies involved are often integrated multinationals, and the use of tax havens is common. On the other hand, features of EI mitigate these risks: there are observable physical operations and outputs, there are standard measurements and benchmark international prices, and (in petroleum) the joint venture structure creates conflicting interests that work in the government’s favor in controlling costs. Good practice requires clear and transparent transfer pricing rules producing a reasonable approximation of arm’s length prices, using industry-specific practices where possible, and reflecting upstream input and output values. EI sectors have useful pricing benchmarks for outputs and transparent practices, such as transfer at cost, for some inputs; these benchmarks provide a comparable uncontrolled price with which to value transactions. The onus should be on the taxpayer to use the rules and show they have done so. Published 36 Mullins (2010) provides an overview of international tax issues for the EIs; FAD held a workshop exploring these topics in more detail in May 2012 and plans a book on the topic. 37 Myers (2010).