Best Services Dividend Stock Buy Picks 2013 By http://long-term-investments.blogspot.com

Dividend income investors seeking for a high income stream from dividends. In addition, capital gains from stocks trades are a welcome bonus for a long-term investor like me. Over a long period, such capital gains are much higher than the amount of dividends. I personally have a ratio of 1:2. This means for every dollar in dividends I could generate additional two dollars of stock gains. Most of my capital gains are unrealized because I hold them for a very long time. However, I started a new screen from the services sector. I wanted to know what stocks picks could be the best for next year. Last year’s picks gained 31.16 percent while the sector was up 23.16 percent compared to the previous year. These are my criteria: - Forward P/E under 15 - Past 5Y Sales growth over 10 percent - Earnings per share growth for the next five years over 10 percent - Operating Margin over 10 percent - Market capitalization above USD 2 billion Fourteen stocks fulfilled these criteria of which eight pay dividends and twelve are currently recommended to buy. The results are dominated by business services stocks and discount, variety store concepts. Thanks to http://long-term-investments.blogspot.com

Recommended
Recommended
More Related Content
What's hot
What's hot (19)
Similar to Best Services Dividend Stock Buy Picks 2013 By http://long-term-investments.blogspot.com
Similar to Best Services Dividend Stock Buy Picks 2013 By http://long-term-investments.blogspot.com (20)
More from Dividend Yield
More from Dividend Yield (20)
Recently uploaded
Recently uploaded (20)
Best Services Dividend Stock Buy Picks 2013 By http://long-term-investments.blogspot.com
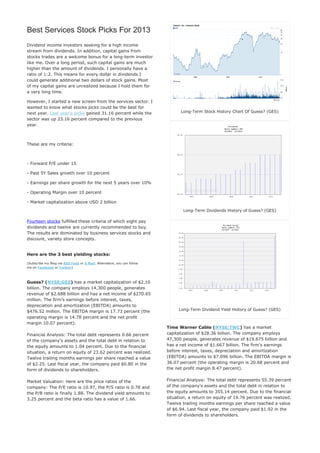
- 1. Best Services Stock Picks For 2013 Dividend income investors seeking for a high income stream from dividends. In addition, capital gains from stocks trades are a welcome bonus for a long-term investor like me. Over a long period, such capital gains are much higher than the amount of dividends. I personally have a ratio of 1:2. This means for every dollar in dividends I could generate additional two dollars of stock gains. Most of my capital gains are unrealized because I hold them for a very long time. However, I started a new screen from the services sector. I wanted to know what stocks picks could be the best for next year. Last year’s picks gained 31.16 percent while the Long-Term Stock History Chart Of Guess? (GES) sector was up 23.16 percent compared to the previous year. These are my criteria: - Forward P/E under 15 - Past 5Y Sales growth over 10 percent - Earnings per share growth for the next 5 years over 10% - Operating Margin over 10 percent - Market capitalization above USD 2 billion Long-Term Dividends History of Guess? (GES) Fourteen stocks fulfilled these criteria of which eight pay dividends and twelve are currently recommended to buy. The results are dominated by business services stocks and discount, variety store concepts. Here are the 3 best yielding stocks: (Subscribe my Blog via RSS Feed or E-Mail. Alternative, you can follow me on Facebook or Twitter) Guess? (NYSE:GES) has a market capitalization of $2.10 billion. The company employs 14,300 people, generates revenue of $2.688 billion and has a net income of $270.65 million. The firm’s earnings before interest, taxes, depreciation and amortization (EBITDA) amounts to $476.52 million. The EBITDA margin is 17.73 percent (the Long-Term Dividend Yield History of Guess? (GES) operating margin is 14.78 percent and the net profit margin 10.07 percent). Time Warner Cable (NYSE:TWC) has a market Financial Analysis: The total debt represents 0.66 percent capitalization of $28.36 billion. The company employs of the company’s assets and the total debt in relation to 47,300 people, generates revenue of $19.675 billion and the equity amounts to 1.04 percent. Due to the financial has a net income of $1.667 billion. The firm’s earnings situation, a return on equity of 23.62 percent was realized. before interest, taxes, depreciation and amortization Twelve trailing months earnings per share reached a value (EBITDA) amounts to $7.096 billion. The EBITDA margin is of $2.25. Last fiscal year, the company paid $0.80 in the 36.07 percent (the operating margin is 20.68 percent and form of dividends to shareholders. the net profit margin 8.47 percent). Market Valuation: Here are the price ratios of the Financial Analysis: The total debt represents 55.39 percent company: The P/E ratio is 10.97, the P/S ratio is 0.78 and of the company’s assets and the total debt in relation to the P/B ratio is finally 1.88. The dividend yield amounts to the equity amounts to 355.14 percent. Due to the financial 3.25 percent and the beta ratio has a value of 1.66. situation, a return on equity of 19.76 percent was realized. Twelve trailing months earnings per share reached a value of $6.94. Last fiscal year, the company paid $1.92 in the form of dividends to shareholders.
- 2. Market Valuation: Here are the price ratios of the of the company’s assets and the total debt in relation to company: The P/E ratio is 13.53, the P/S ratio is 1.44 and the equity amounts to 76.84 percent. Due to the financial the P/B ratio is finally 3.93. The dividend yield amounts to situation, a return on equity of 24.50 percent was realized. 2.39 percent and the beta ratio has a value of 0.80. Twelve trailing months earnings per share reached a value of $7.76. Last fiscal year, the company paid $1.64 in the form of dividends to shareholders. Market Valuation: Here are the price ratios of the company: The P/E ratio is 12.28, the P/S ratio is 2.28 and the P/B ratio is finally 3.00. The dividend yield amounts to 2.37 percent and the beta ratio has a value of 1.09. Long-Term Stock History Chart Of Time Warner Cable (TWC) Long-Term Stock History Chart Of Copa Holdings (CPA) Long-Term Dividends History of Time Warner Cable (TWC) Long-Term Dividends History of Copa Holdings (CPA) Long-Term Dividend Yield History of Time Warner Cable (TWC) Copa Holdings (NYSE:CPA) has a market capitalization of $4.22 billion. The company employs 7,527 people, generates revenue of $1.830 billion and has a net income of $310.42 million. The firm’s earnings before interest, Long-Term Dividend Yield History of Copa Holdings (CPA) taxes, depreciation and amortization (EBITDA) amounts to $460.44 million. The EBITDA margin is 25.15 percent (the operating margin is 21.03 percent and the net profit margin 16.95 percent). Take a closer look at the full list of the best stock picks from the services sector for next year. The average P/E Financial Analysis: The total debt represents 34.83 percent ratio amounts to 18.10 and forward P/E ratio is 11.08. The
- 3. dividend yield has a value of 2.51 percent. Price to book ratio is 1.81 and price to sales ratio 2.90. The operating margin amounts to 24.97 percent. The average stock has a debt to equity ratio of 0.42. Here is the full table with some fundamentals (TTM): Best Services Stock Picks For 2013 (Click to enlarge) If you like this list, please give us a Facebook Like! Or post a comment on Twitter! Related stock ticker symbols: GES, TWC, CPA, FMCN, FIS, TW, AAN, GPN, DG, DLTR, RYAAY, DTV, WXS, ADS Selected Articles: · 13 Best Dividend Paying Services Stocks · The Best Yielding Large Cap Services Stocks · The 20 Biggest Dividend Stocks Within The Service Sector * I have no positions in any stocks mentioned, and no plans to initiate any positions within the next 72 hours. I receive no compensation to write about any specific stock, sector or theme. Monthly Yield Fact Book | Yields Dividend Champions | Yields Dividend Contenders | Yields Dividend Challengers | High-Yield Large Cap | +10% Yielding Stocks |