SlideShare a Scribd company logo
1 of 10
Download to read offline
Comparison of 100 ball and 120 ball tournament using the 
predictive modelling method keeping the structure of 
tournament same 
 
Introduction 
Cricket, a game meant for social entertainment of the early Englishmen, is now popular in more
than half the world and is one of the most attractive platform.The game spreads across 5
continents and 10 countries are continuously competing for the top spot. It has a core following
of more than 2.5 billion which makes is second most popular sport in the world (Kimber, 2008).
Since the arrival of T20 cricket in 2003, the game has reached a new height of popularity and a
there are many top T20 leagues that have been setup across the globe. With high viewership
the game has been attracting a lot of money with an always increasing number of players
wages, sponsorship money and betting of both legal and illegal nature. And so that all this
money doesn’t end up in disappointment, every game have to have a winner and in case there
is none, a fair practice have to be used to declare one.
England is planning to disrupt this by launching a format that is even shorter, can be enjoyed by
core fans enjoy and garner more casual eyeballs. When England and Wales Cricket Board
proposed for a 100 ball cricket format instead of T20, it was received with both excitement and
suspicion.Dubbed 'The Hundred', the new format could feature 20 five-ball overs per side, with
the eight-team tournament to begin in 2020. With each match 40 balls shorter than a T20, the
action will be cut to around two and a half hours. It is hoped families with younger children will
be attracted to attend evening games.
But can the reduced length of the match will affect the match result? Can a lower ranked team
will have more chances of beating a higher ranked team? Will there be an increase in number of
the boundaries? And many more question like these are in the spotlight in this discussion.
 
Models of sports performance are produced by analysing previous cases where key variables of
interest and outcomes are known. Once the model is produced, future performances can be
simulated where the key variables for these matches are known providing predictions for
outcomes. We also need to be aware of the limitations of simulations and the assumptions that
they make.
This does not invalidate such a simulation study but we do need to be aware of the limitations.
The most important thing to understand about simulation studies is that they do not actually
predict match outcomes!
In the pre-computer days, Philip (2011) fit the geometric distribution to individual runs scored
based on results from test cricket. probabilities for selected ranges of individual scores in test
cricket using product-limit estimators. More recently, Sirsai (2016) simulates batting outcomes
between a specified test batsman and bowler using career batting and bowling averages as the
key inputs without regard to the state of the match (e.g., the score, the number of wickets lost,
the number of overs completed).
In this article, we develop a simulator for 100 BALL cricket matches. The approach extends the
work of Swartz et al. (2006) who investigate the Modelling and Simulator in ODI cricket. In
addition, we now provide a method of generating runs in the second innings. Given that only a
finite number of outcomes can occur on each ball that is bowled, a discrete generator on a finite
set is developed where the outcome probabilities are estimated from historical data involving
T20 cricket matches. The probabilities depend on the batsman, the bowler, the number of
wickets lost, the number of balls bowled and the current score of the match.
In Section 2, we develop a simulator for 100 ball cricket which is based upon a Binary logistic
model. Particular attention is given to second innings batting where the state of the match (e.g.,
score, wickets, balls) affects the aggressiveness of batsmen. In Section 3, we consider the
adequacy of the approach by comparing simulated results against actual data. The simulator is
constructed using data from recent T20 matches. In Section 4, we demonstrate how the
simulator can be used to address questions of interest. We conclude with a short discussion in
Section 5.
 
 
Methods 
There are many factors that influence performance in sport; these factors have varying degrees 
of complexity and validity. The computer-based predictions modeled the relationship between 
the result of a match and three relevant factors in the 120 matches of the previous 2 cricket T20 
World Cup and the matches in between(2104-2016). There are 3 different factors, one for each 
innings.  
The three factors used were for 1st innings: 
1. World ranking points 
2. Balls remaining  
3. Wickets left  
 
The three factors used were for 2nd innings: 
1. World ranking points 
2. Balls remaining  
3. Wickets left  
4. Runs remaining to win 
 
These data were chosen because the reliable data for other factors were not available and once 
consider constant. Here we chose the Ranking points instead of the rank to get more sensitive 
to data. It is because the difference between the consecutively ranked team doesn’t justify the 
actual gap. Sri Lanka is ranked 1 with 135 points and India is ranked 2 with 124 points. Here the 
difference is of 11 points whereas New Zealand and South Africa is ranked 6 and 7 but the 
difference between them is of 0 points. That’s why the ranking points difference was chosen 
instead of the rank difference. 
The next variable is the balls remaining which is the total balls left after the x balls are bowled; 
120-x, Wickets remaining is also calculated in the same way. It is the wicket remaining after the 
x batsman are out; 10-x 
The variable used in the second innings Is the runs remaining. The pattern of play of the chasing 
team largely depends on how many runs to chase. They adjust their attacking and defensive 
strategy accordingly. 
  
 
Models 
First innings model (A teams bat first) 
Independent Variables 
This model used 3 independent variables which were all determined with respect to the higher 
ranked of the two teams within matches according to the ICC World Rankings at the time 
matches were played: 
* The difference in World Ranking Points, Rankδ: higher ranked team’s value – lower’ranked 
team’s value. 
* Number of balls remaining: 120 - balls bowled 
* Number of wickets remaining: 10-wickets out 
 
Second innings model 
Independent Variables 
* The difference in World Ranking Points, Rankδ: higher ranked team’s value – lower’ranked 
team’s value. 
* Number of balls remaining: 120- balls bowled 
* Number of wickets remaining: 10-wickets out 
* Runs remaining to win: this is calculated as Runs scored by team A - the current run scored by 
team B. 
 
Dependent Variable 
Dependent variable is the event that can happen on each ball. This can be either run scored 
{0,1,2,4,6,} or a wicket is a fallen 


Tournament Prediction 
The 2016 ICC World T-20 was the sixth edition of the world championship of Twenty20 
International cricket. Participating teams were 16; the number of teams being for the second 
time in its history of the championship. Ten teams already qualified through their full status 
from the ICC (International Cricket Council) and six qualified through 2015 edition qualifiers. 
Tournament was of 3 stages; first stage being of eight lowest ranking teams playing out of 
which two qualifying and joining the eight highest ranked teams to become the Super 10 stage. 
Finally, the top four teams made it to the knockout stage. 
 
  
Fig. 1 Tournament structure of the T20 world cup in 2016  
  
 
There is a role for the simulation to determine the chances of different squads reaching                             
different stages of tournaments and simulations studies have highlighted factors influencing                     
success. 
 
In this case, the structure of the tournament is not altered instead the format of the game is                                   
changed to a 100 ball tournament and see if there are changes in the team qualifying or even                                   
winning the tournament. 
The 2016 T20 World Cup is used as an example because its the latest tournament conducted.                               
Therefore, we are dealing with latest progression the matches as well as the ranking  
 
Modelling 
We consider the simulation of runs in the first innings for predetermined batting and bowling                             
orders. We initially investigate the first innings runs since second innings strategies are affected                           
by the number of runs scored in the first innings. By a predetermined batting and bowling order,                                 
we mean that a set of rules has been put in place which dictates the batsman and bowler at any                                       
given point in the match. These rules could be simple such as maintaining a fixed batting and                                 
bowling order. The rules for determining batting and bowling orders could also be very complex.                             
For example, the rules could be Markovian in nature where a specified bowler may be                             
substituted at a state in the match dependent upon the number of wickets lost, the number of                                 
overs, the number of runs and the current batsmen. The key point is that they need to be                                   
specified in advance for the purpose of simulation. 
In 100 ball cricket, there are a finite number of outcomes arising from each ball bowled.                               
Suppose that the first innings terminate on the mth ball bowled where m ≤ 100. Ignoring certain                                 
rare events (such as scoring 5 runs), and temporarily ignoring wide-balls and no-balls,  


Fig 2. Showing the event that can happen on each ball 


These ​includes the possibility of scoring due to byes and leg byes. Byes and leg byes occur                                 
when the batsman has not hit the ball with his bat but decides to run. 
  
 
Modelling assumptions 
The runs scored on each ball depend on many factors including 
the batsman; 
the bowler; 
the number of wickets left; 
the number of balls left; 
the current score of the match; the opposing team; 
the location of the match; 
the coach’s advice; 
the condition of the pitch, etc. 
Since, we don't have the quality data for other events we are considering them constant. Hence                               
only the following factors were taken. 


For the first innings, we consider three factors 
● Balls left 
● Wickets left 
● Ranking points difference of each team 
The three factors used were for 2nd innings: 
● World ranking points 
● Balls remaining  
● Wickets left  
● Runs remaining to win 
 
Our data are based on 84 T20 matches from January 2014 until July 2016 amongst the 10 full                                   
member nations of the International Cricket Council (ICC). These matches are those for which                           
ball by ball commentary is available on the Cricinfo website (www.cricinfo.com) and include                         
almost all matches amongst the 10 nations during the specified time period. In the 84 matches,                               
20,012 balls were bowled involving I = 435 batsman and J = 360 bowlers. In the first innings,                                   
10000 balls were bowled. Over these matches, we calculate vˆ = 895/20012 = 0.044 as the total                                 
number of wide- balls and no-balls divided by the total number of balls bowled hence ignored. 
 
   
Table 1: ICC T20 rankings of team as per 2016 
 
Modelling stage 
The first stage is to identify the type of model that can be applied to the dependent and                                   
independent variable. We will try to find a relationship between the dependent and independent                           
variable individually first and then all together. The significant value helps in determining                         
whether there is a relationship between the variables exist or not. 
 
The model being used here is a binary logistic model. This is an extension of the commonly                                 
used linear regression model. In the binary logistic model, the probability of the dependent                           
variable is taken out in terms of independent variable. For each probable outcome of a x0, x1,                                 
x2, x3, x4, x6, xW, a function is formed. For the first innings, the function is based on the balls                                       
remaining, wickets remaining and the rank difference of both the teams and for the second                             
innings an additional independent variable of runs remaining is added. Probability is calculated                         
on each ball for each of the possible outcomes. 
 
For 1st Inning 
1. x0 = - 0.00007*Rank_diff + 0.01856*Ball_remaining - 0.215148*Wicket_remainig - 0.05479 
2. x1 = 0.00057*Rank_diff - 0.00838*Ball_remaining + 0.055152*Wicket_remainig - 0.34979 
3. x2 = 0.00099*Rank_diff - 0.01164*Ball_remaining + 0.080700*Wicket_remainig - 2.44566 
4. x4 = - 0.00107*Rank_diff - 0.00387*Ball_remaining + 0.160612*Wicket_remainig - 3.13587 
5. x6 = - 0.00165*Rank_diff - 0.02436*Ball_remaining + 0.314123*Wicket_remainig - 4.15646 
6. xW = - 0.00199*Rank_diff - 0.01238*Ball_remaining + 0.014393*Wicket_remainig - 2.31583 
 
 
For 2nd Inning 
1. x0 = - 0.000257*rank_diff + 0.018408*Ball_remaining - 0.004386*Runs_remaining - 
0.125313*Wktremain -0.34237 
2. x1 = 0.00018*rank_diff - 0.011771*Ball_remaining + 0.002616*Runs_remaining +               
0.053257*WktRemain - 0.397337 
3. x2 = 0.000994*rank_diff - 0.007598*Ball_remaining + 0.000396*Runs_remaining +               
0.024646*Wktremain -2.238433 
4. x4 = -0.000979*rank_diff - 0.0024*Ball_remaining + 0.002929*Runs_remaining +               
0.098909*Wktremain - 2.95531 
5. x6 = 0.000733*rank_diff - 0.023353*Ball_remaining + 0.005015*Runs_remaining +               
0.152199*Wktremain - 3.29799 
6. xW = -0.003198*rank_diff - 0.011384*Ball_remaining + 0.003907*Runs_remaining -               
0.018718*Wktremain -2.507615 
 
Formula to calculate the probability of event happening on each ball 


P: probability of Y occuring  
e: natural logarithm base  
b0: interception at y-axis  
b1: line gradient  
bn: regression coefficient of Xn  
X1: predictor variable 
 
The X1 predicts the probability of Y. The difference between the linear model and the logistics is                                 
that the linear regression predicts the value of Y whereas in the Logistic model it predicts the                                 
probability of Y by taking a specific value. In this case x1, x2...xW is calculated. Then those                                 
values were put in the above equation and the probability is calculated. The final probability is                               
normalized so that it doesn’t exceed one. 
 
These equations are formed by the binary logistic model. The rank_diff was not significant but                             
still, we took as it is better if to have one more variable. 
 
 
Results : 
A simulator was implemented in Matlab to run the 2016 T20 Cricket world cup. For the                               
tournament each version i.e. 120 balls tournament and 100 ball tournament were run for 10000                             
times. There are 23 matches with 20 league and 3 knockout including the finals. 10 teams were                                 
distributed in 2 groups of 5.  
From the simulation results, we can see the probability of winning for the lower ranked team has                                 
increased in the knockout stage compare to the higher ranked team whereas it has decreased in                               
the league stage. It implies that the clearing group stage is more difficult than winning the                               
knockout matches. The striking feature is Pakistan and New Zealand decrease in the chances                           
of qualifying to -4.62%. 3rd in pool implies that they won’t be finishing 3rd and hence more                                 
chances of qualifying in the knockout stages or lower in pool. Whereas Higher ranked team like                               
india and Sri Lanka has ~3.6% higher chance to finish 3rd.  
 
 
Stage   Sri Lanka  India  Australia  West Indies  Pakistan 
New 
Zealand 
South 
Africa  England  Bangladesh  Afghanistan 
Winners  -52  -87  -49  -37  64  74  50  12  13  12 
Finalists  -215  -98  -87  -49  18  47  149  89  148  -2 
Losing SF  -265  -286  -25  -42  156  56  147  149  37  73 
3rd in pool  369  331  -99  -58  -462  -462  -65  -119  281  284 
4th in pool  -45  -65  213  152  195  264  -93  -40  -307  -274 
5th in pool  208  205  47  34  29  21  -188  -91  -172  -93 
Table 2. Shows the difference of team winning in 100 and 120 ball tournament. (Number of times winning in                                     
100 minus the number of times winning in 120 ball) 
 
Another feature is the increase in the Average number of boundaries and decrease in the zeros                               
and ones. There are increase in the percentage of 4s more in compare to 6s. More the number                                   
of boundaries scored throughout match demands more power hitter and an aggressive                       
approach 


Table 3. Shows the average percentage changes in occuring of each event. (Percentage in 100 minus the                                 
percentage in 120 ball) 


Fig 3. Graphical representation of average percentage changes in occuring of each event. (Percentage in                             
100 minus the percentage in 120 ball) 


Conclusion​: 
It is clearly seen from the results that the shorter the format higher the chances of winning a                                   
team in knockout stages though in the league format the higher ranked has more chances of                               
qualifying. The scoring pattern demands for more batsman who can hit boundaries than who                           
can take 1s and 2s. More boundaries mean more entertainment which is good for game and the                                 
money. 
 
 
Bibliography 
Alan C. Kimber and Alan R. Hansford, Journal of the Royal Statistical Society. Series A                             
(Statistics in Society), Vol. 156, No. 3 (1993), pp. 443-455 
 
Philip Scarf, Xin Shi and Sohail Akhtar, Journal of the Royal Statistical Society. Series A                             
(Statistics in Society), Vol. 174, No. 2 (APRIL 2011), pp. 471-497 
 
Sirsai, ​A Bayesian stochastic model for team performance evaluation in T20 cricket:                       
Effectiveness of Power Hitting & Consistency, ​July 20, 2016 
 
Tim B. SWARTZ, Paramjit S. GILL and Saman MUTHUKUMARANA, The Canadian Journal of                         
Statistics / La Revue Canadienne de Statistique, Vol. 37, No. 2 (June/juin 2009), pp. 143-160 


More Related Content

Similar to Sports performance modelling in 100 ball

Loras College 2014 Business Analytics Symposium | Dan Conway: Sports Analytics
Loras College 2014 Business Analytics Symposium | Dan Conway: Sports AnalyticsLoras College 2014 Business Analytics Symposium | Dan Conway: Sports Analytics
Loras College 2014 Business Analytics Symposium | Dan Conway: Sports AnalyticsCartegraph
 
PREDICTIVE MODELS FOR GAME OUTCOMES IN WOMEN’S LACROSSE
PREDICTIVE MODELS FOR GAME OUTCOMES IN WOMEN’S LACROSSEPREDICTIVE MODELS FOR GAME OUTCOMES IN WOMEN’S LACROSSE
PREDICTIVE MODELS FOR GAME OUTCOMES IN WOMEN’S LACROSSEmathsjournal
 
PREDICTIVE MODELS FOR GAME OUTCOMES IN WOMEN’S LACROSSE
PREDICTIVE MODELS FOR GAME OUTCOMES IN WOMEN’S LACROSSEPREDICTIVE MODELS FOR GAME OUTCOMES IN WOMEN’S LACROSSE
PREDICTIVE MODELS FOR GAME OUTCOMES IN WOMEN’S LACROSSEmathsjournal
 
PREDICTIVE MODELS FOR GAME OUTCOMES IN WOMEN’S LACROSSE
PREDICTIVE MODELS FOR GAME OUTCOMES IN WOMEN’S LACROSSEPREDICTIVE MODELS FOR GAME OUTCOMES IN WOMEN’S LACROSSE
PREDICTIVE MODELS FOR GAME OUTCOMES IN WOMEN’S LACROSSEmathsjournal
 
PREDICTIVE MODELS FOR GAME OUTCOMES IN WOMEN’S LACROSSE
PREDICTIVE MODELS FOR GAME OUTCOMES IN WOMEN’S LACROSSEPREDICTIVE MODELS FOR GAME OUTCOMES IN WOMEN’S LACROSSE
PREDICTIVE MODELS FOR GAME OUTCOMES IN WOMEN’S LACROSSEmathsjournal
 
PREDICTIVE MODELS FOR GAME OUTCOMES IN WOMEN’S LACROSSE
PREDICTIVE MODELS FOR GAME OUTCOMES IN WOMEN’S LACROSSEPREDICTIVE MODELS FOR GAME OUTCOMES IN WOMEN’S LACROSSE
PREDICTIVE MODELS FOR GAME OUTCOMES IN WOMEN’S LACROSSEmathsjournal
 
PREDICTIVE MODELS FOR GAME OUTCOMES IN WOMEN’S LACROSSE
PREDICTIVE MODELS FOR GAME OUTCOMES IN WOMEN’S LACROSSEPREDICTIVE MODELS FOR GAME OUTCOMES IN WOMEN’S LACROSSE
PREDICTIVE MODELS FOR GAME OUTCOMES IN WOMEN’S LACROSSEmathsjournal
 
Football predictions
Football predictionsFootball predictions
Football predictionsponton42
 
Analysis of the D/L method used for target resetting in interrupted limited o...
Analysis of the D/L method used for target resetting in interrupted limited o...Analysis of the D/L method used for target resetting in interrupted limited o...
Analysis of the D/L method used for target resetting in interrupted limited o...RohanGdeSilva
 
Pressure Index in Cricket
Pressure Index in CricketPressure Index in Cricket
Pressure Index in CricketIOSR Journals
 
Data Visualization and Clustering of Players in Major League Baseball
Data Visualization and Clustering of Players in Major League BaseballData Visualization and Clustering of Players in Major League Baseball
Data Visualization and Clustering of Players in Major League BaseballKaushik Nuvvula
 
[Scorebook final]
[Scorebook final][Scorebook final]
[Scorebook final]Freelancer
 
m503 Project1 FINAL DRAFT
m503 Project1 FINAL DRAFTm503 Project1 FINAL DRAFT
m503 Project1 FINAL DRAFTBrian Becker
 
Clustering of Players in Major League Baseball
Clustering of Players in Major League Baseball Clustering of Players in Major League Baseball
Clustering of Players in Major League Baseball Srinivas Osuri
 
Effects of Travel Distance on Away Team Win Percentage in the NFL
Effects of Travel Distance on Away Team Win Percentage in the NFLEffects of Travel Distance on Away Team Win Percentage in the NFL
Effects of Travel Distance on Away Team Win Percentage in the NFLKyle Waters
 
Machine Learning Based Selection of Optimal Sports team based on the Players ...
Machine Learning Based Selection of Optimal Sports team based on the Players ...Machine Learning Based Selection of Optimal Sports team based on the Players ...
Machine Learning Based Selection of Optimal Sports team based on the Players ...IRJET Journal
 
A Hybrid Constraint Programming And Enumeration Approach For Solving NHL Play...
A Hybrid Constraint Programming And Enumeration Approach For Solving NHL Play...A Hybrid Constraint Programming And Enumeration Approach For Solving NHL Play...
A Hybrid Constraint Programming And Enumeration Approach For Solving NHL Play...Shannon Green
 

Similar to Sports performance modelling in 100 ball (20)

Loras College 2014 Business Analytics Symposium | Dan Conway: Sports Analytics
Loras College 2014 Business Analytics Symposium | Dan Conway: Sports AnalyticsLoras College 2014 Business Analytics Symposium | Dan Conway: Sports Analytics
Loras College 2014 Business Analytics Symposium | Dan Conway: Sports Analytics
 
PREDICTIVE MODELS FOR GAME OUTCOMES IN WOMEN’S LACROSSE
PREDICTIVE MODELS FOR GAME OUTCOMES IN WOMEN’S LACROSSEPREDICTIVE MODELS FOR GAME OUTCOMES IN WOMEN’S LACROSSE
PREDICTIVE MODELS FOR GAME OUTCOMES IN WOMEN’S LACROSSE
 
PREDICTIVE MODELS FOR GAME OUTCOMES IN WOMEN’S LACROSSE
PREDICTIVE MODELS FOR GAME OUTCOMES IN WOMEN’S LACROSSEPREDICTIVE MODELS FOR GAME OUTCOMES IN WOMEN’S LACROSSE
PREDICTIVE MODELS FOR GAME OUTCOMES IN WOMEN’S LACROSSE
 
PREDICTIVE MODELS FOR GAME OUTCOMES IN WOMEN’S LACROSSE
PREDICTIVE MODELS FOR GAME OUTCOMES IN WOMEN’S LACROSSEPREDICTIVE MODELS FOR GAME OUTCOMES IN WOMEN’S LACROSSE
PREDICTIVE MODELS FOR GAME OUTCOMES IN WOMEN’S LACROSSE
 
PREDICTIVE MODELS FOR GAME OUTCOMES IN WOMEN’S LACROSSE
PREDICTIVE MODELS FOR GAME OUTCOMES IN WOMEN’S LACROSSEPREDICTIVE MODELS FOR GAME OUTCOMES IN WOMEN’S LACROSSE
PREDICTIVE MODELS FOR GAME OUTCOMES IN WOMEN’S LACROSSE
 
PREDICTIVE MODELS FOR GAME OUTCOMES IN WOMEN’S LACROSSE
PREDICTIVE MODELS FOR GAME OUTCOMES IN WOMEN’S LACROSSEPREDICTIVE MODELS FOR GAME OUTCOMES IN WOMEN’S LACROSSE
PREDICTIVE MODELS FOR GAME OUTCOMES IN WOMEN’S LACROSSE
 
PREDICTIVE MODELS FOR GAME OUTCOMES IN WOMEN’S LACROSSE
PREDICTIVE MODELS FOR GAME OUTCOMES IN WOMEN’S LACROSSEPREDICTIVE MODELS FOR GAME OUTCOMES IN WOMEN’S LACROSSE
PREDICTIVE MODELS FOR GAME OUTCOMES IN WOMEN’S LACROSSE
 
Football predictions
Football predictionsFootball predictions
Football predictions
 
Capstone
CapstoneCapstone
Capstone
 
Analysis of the D/L method used for target resetting in interrupted limited o...
Analysis of the D/L method used for target resetting in interrupted limited o...Analysis of the D/L method used for target resetting in interrupted limited o...
Analysis of the D/L method used for target resetting in interrupted limited o...
 
Pressure Index in Cricket
Pressure Index in CricketPressure Index in Cricket
Pressure Index in Cricket
 
Lineup Efficiency
Lineup EfficiencyLineup Efficiency
Lineup Efficiency
 
B036307011
B036307011B036307011
B036307011
 
Data Visualization and Clustering of Players in Major League Baseball
Data Visualization and Clustering of Players in Major League BaseballData Visualization and Clustering of Players in Major League Baseball
Data Visualization and Clustering of Players in Major League Baseball
 
[Scorebook final]
[Scorebook final][Scorebook final]
[Scorebook final]
 
m503 Project1 FINAL DRAFT
m503 Project1 FINAL DRAFTm503 Project1 FINAL DRAFT
m503 Project1 FINAL DRAFT
 
Clustering of Players in Major League Baseball
Clustering of Players in Major League Baseball Clustering of Players in Major League Baseball
Clustering of Players in Major League Baseball
 
Effects of Travel Distance on Away Team Win Percentage in the NFL
Effects of Travel Distance on Away Team Win Percentage in the NFLEffects of Travel Distance on Away Team Win Percentage in the NFL
Effects of Travel Distance on Away Team Win Percentage in the NFL
 
Machine Learning Based Selection of Optimal Sports team based on the Players ...
Machine Learning Based Selection of Optimal Sports team based on the Players ...Machine Learning Based Selection of Optimal Sports team based on the Players ...
Machine Learning Based Selection of Optimal Sports team based on the Players ...
 
A Hybrid Constraint Programming And Enumeration Approach For Solving NHL Play...
A Hybrid Constraint Programming And Enumeration Approach For Solving NHL Play...A Hybrid Constraint Programming And Enumeration Approach For Solving NHL Play...
A Hybrid Constraint Programming And Enumeration Approach For Solving NHL Play...
 

Recently uploaded

Top profile Call Girls In Begusarai [ 7014168258 ] Call Me For Genuine Models...
Top profile Call Girls In Begusarai [ 7014168258 ] Call Me For Genuine Models...Top profile Call Girls In Begusarai [ 7014168258 ] Call Me For Genuine Models...
Top profile Call Girls In Begusarai [ 7014168258 ] Call Me For Genuine Models...nirzagarg
 
Kings of Saudi Arabia, information about them
Kings of Saudi Arabia, information about themKings of Saudi Arabia, information about them
Kings of Saudi Arabia, information about themeitharjee
 
In Riyadh ((+919101817206)) Cytotec kit @ Abortion Pills Saudi Arabia
In Riyadh ((+919101817206)) Cytotec kit @ Abortion Pills Saudi ArabiaIn Riyadh ((+919101817206)) Cytotec kit @ Abortion Pills Saudi Arabia
In Riyadh ((+919101817206)) Cytotec kit @ Abortion Pills Saudi Arabiaahmedjiabur940
 
Jodhpur Park | Call Girls in Kolkata Phone No 8005736733 Elite Escort Service...
Jodhpur Park | Call Girls in Kolkata Phone No 8005736733 Elite Escort Service...Jodhpur Park | Call Girls in Kolkata Phone No 8005736733 Elite Escort Service...
Jodhpur Park | Call Girls in Kolkata Phone No 8005736733 Elite Escort Service...HyderabadDolls
 
Digital Advertising Lecture for Advanced Digital & Social Media Strategy at U...
Digital Advertising Lecture for Advanced Digital & Social Media Strategy at U...Digital Advertising Lecture for Advanced Digital & Social Media Strategy at U...
Digital Advertising Lecture for Advanced Digital & Social Media Strategy at U...Valters Lauzums
 
Digital Transformation Playbook by Graham Ware
Digital Transformation Playbook by Graham WareDigital Transformation Playbook by Graham Ware
Digital Transformation Playbook by Graham WareGraham Ware
 
Top profile Call Girls In Bihar Sharif [ 7014168258 ] Call Me For Genuine Mod...
Top profile Call Girls In Bihar Sharif [ 7014168258 ] Call Me For Genuine Mod...Top profile Call Girls In Bihar Sharif [ 7014168258 ] Call Me For Genuine Mod...
Top profile Call Girls In Bihar Sharif [ 7014168258 ] Call Me For Genuine Mod...nirzagarg
 
Dubai Call Girls Peeing O525547819 Call Girls Dubai
Dubai Call Girls Peeing O525547819 Call Girls DubaiDubai Call Girls Peeing O525547819 Call Girls Dubai
Dubai Call Girls Peeing O525547819 Call Girls Dubaikojalkojal131
 
Top profile Call Girls In bhavnagar [ 7014168258 ] Call Me For Genuine Models...
Top profile Call Girls In bhavnagar [ 7014168258 ] Call Me For Genuine Models...Top profile Call Girls In bhavnagar [ 7014168258 ] Call Me For Genuine Models...
Top profile Call Girls In bhavnagar [ 7014168258 ] Call Me For Genuine Models...gajnagarg
 
+97470301568>>weed for sale in qatar ,weed for sale in dubai,weed for sale in...
+97470301568>>weed for sale in qatar ,weed for sale in dubai,weed for sale in...+97470301568>>weed for sale in qatar ,weed for sale in dubai,weed for sale in...
+97470301568>>weed for sale in qatar ,weed for sale in dubai,weed for sale in...Health
 
Top profile Call Girls In Tumkur [ 7014168258 ] Call Me For Genuine Models We...
Top profile Call Girls In Tumkur [ 7014168258 ] Call Me For Genuine Models We...Top profile Call Girls In Tumkur [ 7014168258 ] Call Me For Genuine Models We...
Top profile Call Girls In Tumkur [ 7014168258 ] Call Me For Genuine Models We...nirzagarg
 
TrafficWave Generator Will Instantly drive targeted and engaging traffic back...
TrafficWave Generator Will Instantly drive targeted and engaging traffic back...TrafficWave Generator Will Instantly drive targeted and engaging traffic back...
TrafficWave Generator Will Instantly drive targeted and engaging traffic back...SOFTTECHHUB
 
Top profile Call Girls In Purnia [ 7014168258 ] Call Me For Genuine Models We...
Top profile Call Girls In Purnia [ 7014168258 ] Call Me For Genuine Models We...Top profile Call Girls In Purnia [ 7014168258 ] Call Me For Genuine Models We...
Top profile Call Girls In Purnia [ 7014168258 ] Call Me For Genuine Models We...nirzagarg
 
Top profile Call Girls In Chandrapur [ 7014168258 ] Call Me For Genuine Model...
Top profile Call Girls In Chandrapur [ 7014168258 ] Call Me For Genuine Model...Top profile Call Girls In Chandrapur [ 7014168258 ] Call Me For Genuine Model...
Top profile Call Girls In Chandrapur [ 7014168258 ] Call Me For Genuine Model...gajnagarg
 
Discover Why Less is More in B2B Research
Discover Why Less is More in B2B ResearchDiscover Why Less is More in B2B Research
Discover Why Less is More in B2B Researchmichael115558
 
Gartner's Data Analytics Maturity Model.pptx
Gartner's Data Analytics Maturity Model.pptxGartner's Data Analytics Maturity Model.pptx
Gartner's Data Analytics Maturity Model.pptxchadhar227
 
Predicting HDB Resale Prices - Conducting Linear Regression Analysis With Orange
Predicting HDB Resale Prices - Conducting Linear Regression Analysis With OrangePredicting HDB Resale Prices - Conducting Linear Regression Analysis With Orange
Predicting HDB Resale Prices - Conducting Linear Regression Analysis With OrangeThinkInnovation
 
Top profile Call Girls In dimapur [ 7014168258 ] Call Me For Genuine Models W...
Top profile Call Girls In dimapur [ 7014168258 ] Call Me For Genuine Models W...Top profile Call Girls In dimapur [ 7014168258 ] Call Me For Genuine Models W...
Top profile Call Girls In dimapur [ 7014168258 ] Call Me For Genuine Models W...gajnagarg
 
Sealdah % High Class Call Girls Kolkata - 450+ Call Girl Cash Payment 8005736...
Sealdah % High Class Call Girls Kolkata - 450+ Call Girl Cash Payment 8005736...Sealdah % High Class Call Girls Kolkata - 450+ Call Girl Cash Payment 8005736...
Sealdah % High Class Call Girls Kolkata - 450+ Call Girl Cash Payment 8005736...HyderabadDolls
 
High Profile Call Girls Service in Jalore { 9332606886 } VVIP NISHA Call Girl...
High Profile Call Girls Service in Jalore { 9332606886 } VVIP NISHA Call Girl...High Profile Call Girls Service in Jalore { 9332606886 } VVIP NISHA Call Girl...
High Profile Call Girls Service in Jalore { 9332606886 } VVIP NISHA Call Girl...kumargunjan9515
 

Recently uploaded (20)

Top profile Call Girls In Begusarai [ 7014168258 ] Call Me For Genuine Models...
Top profile Call Girls In Begusarai [ 7014168258 ] Call Me For Genuine Models...Top profile Call Girls In Begusarai [ 7014168258 ] Call Me For Genuine Models...
Top profile Call Girls In Begusarai [ 7014168258 ] Call Me For Genuine Models...
 
Kings of Saudi Arabia, information about them
Kings of Saudi Arabia, information about themKings of Saudi Arabia, information about them
Kings of Saudi Arabia, information about them
 
In Riyadh ((+919101817206)) Cytotec kit @ Abortion Pills Saudi Arabia
In Riyadh ((+919101817206)) Cytotec kit @ Abortion Pills Saudi ArabiaIn Riyadh ((+919101817206)) Cytotec kit @ Abortion Pills Saudi Arabia
In Riyadh ((+919101817206)) Cytotec kit @ Abortion Pills Saudi Arabia
 
Jodhpur Park | Call Girls in Kolkata Phone No 8005736733 Elite Escort Service...
Jodhpur Park | Call Girls in Kolkata Phone No 8005736733 Elite Escort Service...Jodhpur Park | Call Girls in Kolkata Phone No 8005736733 Elite Escort Service...
Jodhpur Park | Call Girls in Kolkata Phone No 8005736733 Elite Escort Service...
 
Digital Advertising Lecture for Advanced Digital & Social Media Strategy at U...
Digital Advertising Lecture for Advanced Digital & Social Media Strategy at U...Digital Advertising Lecture for Advanced Digital & Social Media Strategy at U...
Digital Advertising Lecture for Advanced Digital & Social Media Strategy at U...
 
Digital Transformation Playbook by Graham Ware
Digital Transformation Playbook by Graham WareDigital Transformation Playbook by Graham Ware
Digital Transformation Playbook by Graham Ware
 
Top profile Call Girls In Bihar Sharif [ 7014168258 ] Call Me For Genuine Mod...
Top profile Call Girls In Bihar Sharif [ 7014168258 ] Call Me For Genuine Mod...Top profile Call Girls In Bihar Sharif [ 7014168258 ] Call Me For Genuine Mod...
Top profile Call Girls In Bihar Sharif [ 7014168258 ] Call Me For Genuine Mod...
 
Dubai Call Girls Peeing O525547819 Call Girls Dubai
Dubai Call Girls Peeing O525547819 Call Girls DubaiDubai Call Girls Peeing O525547819 Call Girls Dubai
Dubai Call Girls Peeing O525547819 Call Girls Dubai
 
Top profile Call Girls In bhavnagar [ 7014168258 ] Call Me For Genuine Models...
Top profile Call Girls In bhavnagar [ 7014168258 ] Call Me For Genuine Models...Top profile Call Girls In bhavnagar [ 7014168258 ] Call Me For Genuine Models...
Top profile Call Girls In bhavnagar [ 7014168258 ] Call Me For Genuine Models...
 
+97470301568>>weed for sale in qatar ,weed for sale in dubai,weed for sale in...
+97470301568>>weed for sale in qatar ,weed for sale in dubai,weed for sale in...+97470301568>>weed for sale in qatar ,weed for sale in dubai,weed for sale in...
+97470301568>>weed for sale in qatar ,weed for sale in dubai,weed for sale in...
 
Top profile Call Girls In Tumkur [ 7014168258 ] Call Me For Genuine Models We...
Top profile Call Girls In Tumkur [ 7014168258 ] Call Me For Genuine Models We...Top profile Call Girls In Tumkur [ 7014168258 ] Call Me For Genuine Models We...
Top profile Call Girls In Tumkur [ 7014168258 ] Call Me For Genuine Models We...
 
TrafficWave Generator Will Instantly drive targeted and engaging traffic back...
TrafficWave Generator Will Instantly drive targeted and engaging traffic back...TrafficWave Generator Will Instantly drive targeted and engaging traffic back...
TrafficWave Generator Will Instantly drive targeted and engaging traffic back...
 
Top profile Call Girls In Purnia [ 7014168258 ] Call Me For Genuine Models We...
Top profile Call Girls In Purnia [ 7014168258 ] Call Me For Genuine Models We...Top profile Call Girls In Purnia [ 7014168258 ] Call Me For Genuine Models We...
Top profile Call Girls In Purnia [ 7014168258 ] Call Me For Genuine Models We...
 
Top profile Call Girls In Chandrapur [ 7014168258 ] Call Me For Genuine Model...
Top profile Call Girls In Chandrapur [ 7014168258 ] Call Me For Genuine Model...Top profile Call Girls In Chandrapur [ 7014168258 ] Call Me For Genuine Model...
Top profile Call Girls In Chandrapur [ 7014168258 ] Call Me For Genuine Model...
 
Discover Why Less is More in B2B Research
Discover Why Less is More in B2B ResearchDiscover Why Less is More in B2B Research
Discover Why Less is More in B2B Research
 
Gartner's Data Analytics Maturity Model.pptx
Gartner's Data Analytics Maturity Model.pptxGartner's Data Analytics Maturity Model.pptx
Gartner's Data Analytics Maturity Model.pptx
 
Predicting HDB Resale Prices - Conducting Linear Regression Analysis With Orange
Predicting HDB Resale Prices - Conducting Linear Regression Analysis With OrangePredicting HDB Resale Prices - Conducting Linear Regression Analysis With Orange
Predicting HDB Resale Prices - Conducting Linear Regression Analysis With Orange
 
Top profile Call Girls In dimapur [ 7014168258 ] Call Me For Genuine Models W...
Top profile Call Girls In dimapur [ 7014168258 ] Call Me For Genuine Models W...Top profile Call Girls In dimapur [ 7014168258 ] Call Me For Genuine Models W...
Top profile Call Girls In dimapur [ 7014168258 ] Call Me For Genuine Models W...
 
Sealdah % High Class Call Girls Kolkata - 450+ Call Girl Cash Payment 8005736...
Sealdah % High Class Call Girls Kolkata - 450+ Call Girl Cash Payment 8005736...Sealdah % High Class Call Girls Kolkata - 450+ Call Girl Cash Payment 8005736...
Sealdah % High Class Call Girls Kolkata - 450+ Call Girl Cash Payment 8005736...
 
High Profile Call Girls Service in Jalore { 9332606886 } VVIP NISHA Call Girl...
High Profile Call Girls Service in Jalore { 9332606886 } VVIP NISHA Call Girl...High Profile Call Girls Service in Jalore { 9332606886 } VVIP NISHA Call Girl...
High Profile Call Girls Service in Jalore { 9332606886 } VVIP NISHA Call Girl...
 

Sports performance modelling in 100 ball

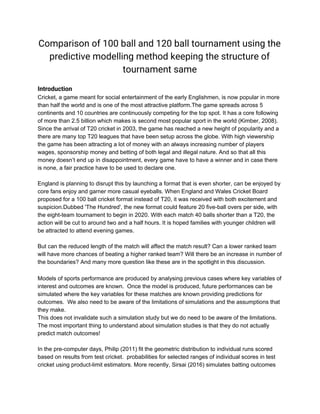
  • 1. Comparison of 100 ball and 120 ball tournament using the  predictive modelling method keeping the structure of  tournament same    Introduction  Cricket, a game meant for social entertainment of the early Englishmen, is now popular in more than half the world and is one of the most attractive platform.The game spreads across 5 continents and 10 countries are continuously competing for the top spot. It has a core following of more than 2.5 billion which makes is second most popular sport in the world (Kimber, 2008). Since the arrival of T20 cricket in 2003, the game has reached a new height of popularity and a there are many top T20 leagues that have been setup across the globe. With high viewership the game has been attracting a lot of money with an always increasing number of players wages, sponsorship money and betting of both legal and illegal nature. And so that all this money doesn’t end up in disappointment, every game have to have a winner and in case there is none, a fair practice have to be used to declare one. England is planning to disrupt this by launching a format that is even shorter, can be enjoyed by core fans enjoy and garner more casual eyeballs. When England and Wales Cricket Board proposed for a 100 ball cricket format instead of T20, it was received with both excitement and suspicion.Dubbed 'The Hundred', the new format could feature 20 five-ball overs per side, with the eight-team tournament to begin in 2020. With each match 40 balls shorter than a T20, the action will be cut to around two and a half hours. It is hoped families with younger children will be attracted to attend evening games. But can the reduced length of the match will affect the match result? Can a lower ranked team will have more chances of beating a higher ranked team? Will there be an increase in number of the boundaries? And many more question like these are in the spotlight in this discussion.   Models of sports performance are produced by analysing previous cases where key variables of interest and outcomes are known. Once the model is produced, future performances can be simulated where the key variables for these matches are known providing predictions for outcomes. We also need to be aware of the limitations of simulations and the assumptions that they make. This does not invalidate such a simulation study but we do need to be aware of the limitations. The most important thing to understand about simulation studies is that they do not actually predict match outcomes! In the pre-computer days, Philip (2011) fit the geometric distribution to individual runs scored based on results from test cricket. probabilities for selected ranges of individual scores in test cricket using product-limit estimators. More recently, Sirsai (2016) simulates batting outcomes
  • 2. between a specified test batsman and bowler using career batting and bowling averages as the key inputs without regard to the state of the match (e.g., the score, the number of wickets lost, the number of overs completed). In this article, we develop a simulator for 100 BALL cricket matches. The approach extends the work of Swartz et al. (2006) who investigate the Modelling and Simulator in ODI cricket. In addition, we now provide a method of generating runs in the second innings. Given that only a finite number of outcomes can occur on each ball that is bowled, a discrete generator on a finite set is developed where the outcome probabilities are estimated from historical data involving T20 cricket matches. The probabilities depend on the batsman, the bowler, the number of wickets lost, the number of balls bowled and the current score of the match. In Section 2, we develop a simulator for 100 ball cricket which is based upon a Binary logistic model. Particular attention is given to second innings batting where the state of the match (e.g., score, wickets, balls) affects the aggressiveness of batsmen. In Section 3, we consider the adequacy of the approach by comparing simulated results against actual data. The simulator is constructed using data from recent T20 matches. In Section 4, we demonstrate how the simulator can be used to address questions of interest. We conclude with a short discussion in Section 5.     Methods  There are many factors that influence performance in sport; these factors have varying degrees  of complexity and validity. The computer-based predictions modeled the relationship between  the result of a match and three relevant factors in the 120 matches of the previous 2 cricket T20  World Cup and the matches in between(2104-2016). There are 3 different factors, one for each  innings.   The three factors used were for 1st innings:  1. World ranking points  2. Balls remaining   3. Wickets left     The three factors used were for 2nd innings:  1. World ranking points  2. Balls remaining   3. Wickets left   4. Runs remaining to win    These data were chosen because the reliable data for other factors were not available and once  consider constant. Here we chose the Ranking points instead of the rank to get more sensitive  to data. It is because the difference between the consecutively ranked team doesn’t justify the  actual gap. Sri Lanka is ranked 1 with 135 points and India is ranked 2 with 124 points. Here the 
  • 3. difference is of 11 points whereas New Zealand and South Africa is ranked 6 and 7 but the  difference between them is of 0 points. That’s why the ranking points difference was chosen  instead of the rank difference.  The next variable is the balls remaining which is the total balls left after the x balls are bowled;  120-x, Wickets remaining is also calculated in the same way. It is the wicket remaining after the  x batsman are out; 10-x  The variable used in the second innings Is the runs remaining. The pattern of play of the chasing  team largely depends on how many runs to chase. They adjust their attacking and defensive  strategy accordingly.       Models  First innings model (A teams bat first)  Independent Variables  This model used 3 independent variables which were all determined with respect to the higher  ranked of the two teams within matches according to the ICC World Rankings at the time  matches were played:  * The difference in World Ranking Points, Rankδ: higher ranked team’s value – lower’ranked  team’s value.  * Number of balls remaining: 120 - balls bowled  * Number of wickets remaining: 10-wickets out    Second innings model  Independent Variables  * The difference in World Ranking Points, Rankδ: higher ranked team’s value – lower’ranked  team’s value.  * Number of balls remaining: 120- balls bowled  * Number of wickets remaining: 10-wickets out  * Runs remaining to win: this is calculated as Runs scored by team A - the current run scored by  team B.    Dependent Variable  Dependent variable is the event that can happen on each ball. This can be either run scored  {0,1,2,4,6,} or a wicket is a fallen        Tournament Prediction  The 2016 ICC World T-20 was the sixth edition of the world championship of Twenty20  International cricket. Participating teams were 16; the number of teams being for the second  time in its history of the championship. Ten teams already qualified through their full status  from the ICC (International Cricket Council) and six qualified through 2015 edition qualifiers. 
  • 4. Tournament was of 3 stages; first stage being of eight lowest ranking teams playing out of  which two qualifying and joining the eight highest ranked teams to become the Super 10 stage.  Finally, the top four teams made it to the knockout stage.       Fig. 1 Tournament structure of the T20 world cup in 2016        There is a role for the simulation to determine the chances of different squads reaching                              different stages of tournaments and simulations studies have highlighted factors influencing                      success.    In this case, the structure of the tournament is not altered instead the format of the game is                                    changed to a 100 ball tournament and see if there are changes in the team qualifying or even                                    winning the tournament.  The 2016 T20 World Cup is used as an example because its the latest tournament conducted.                                Therefore, we are dealing with latest progression the matches as well as the ranking     Modelling  We consider the simulation of runs in the first innings for predetermined batting and bowling                              orders. We initially investigate the first innings runs since second innings strategies are affected                            by the number of runs scored in the first innings. By a predetermined batting and bowling order,                                  we mean that a set of rules has been put in place which dictates the batsman and bowler at any                                        given point in the match. These rules could be simple such as maintaining a fixed batting and                                  bowling order. The rules for determining batting and bowling orders could also be very complex.                              For example, the rules could be Markovian in nature where a specified bowler may be                              substituted at a state in the match dependent upon the number of wickets lost, the number of                                  overs, the number of runs and the current batsmen. The key point is that they need to be                                    specified in advance for the purpose of simulation.  In 100 ball cricket, there are a finite number of outcomes arising from each ball bowled.                                Suppose that the first innings terminate on the mth ball bowled where m ≤ 100. Ignoring certain                                  rare events (such as scoring 5 runs), and temporarily ignoring wide-balls and no-balls,  
  • 5.        Fig 2. Showing the event that can happen on each ball        These ​includes the possibility of scoring due to byes and leg byes. Byes and leg byes occur                                  when the batsman has not hit the ball with his bat but decides to run.       Modelling assumptions  The runs scored on each ball depend on many factors including  the batsman;  the bowler;  the number of wickets left;  the number of balls left;  the current score of the match; the opposing team;  the location of the match;  the coach’s advice;  the condition of the pitch, etc.  Since, we don't have the quality data for other events we are considering them constant. Hence                                only the following factors were taken.        For the first innings, we consider three factors  ● Balls left  ● Wickets left  ● Ranking points difference of each team  The three factors used were for 2nd innings: 
  • 6. ● World ranking points  ● Balls remaining   ● Wickets left   ● Runs remaining to win    Our data are based on 84 T20 matches from January 2014 until July 2016 amongst the 10 full                                    member nations of the International Cricket Council (ICC). These matches are those for which                            ball by ball commentary is available on the Cricinfo website (www.cricinfo.com) and include                          almost all matches amongst the 10 nations during the specified time period. In the 84 matches,                                20,012 balls were bowled involving I = 435 batsman and J = 360 bowlers. In the first innings,                                    10000 balls were bowled. Over these matches, we calculate vˆ = 895/20012 = 0.044 as the total                                  number of wide- balls and no-balls divided by the total number of balls bowled hence ignored.        Table 1: ICC T20 rankings of team as per 2016    Modelling stage  The first stage is to identify the type of model that can be applied to the dependent and                                    independent variable. We will try to find a relationship between the dependent and independent                            variable individually first and then all together. The significant value helps in determining                          whether there is a relationship between the variables exist or not.    The model being used here is a binary logistic model. This is an extension of the commonly                                  used linear regression model. In the binary logistic model, the probability of the dependent                            variable is taken out in terms of independent variable. For each probable outcome of a x0, x1,                                  x2, x3, x4, x6, xW, a function is formed. For the first innings, the function is based on the balls                                        remaining, wickets remaining and the rank difference of both the teams and for the second                              innings an additional independent variable of runs remaining is added. Probability is calculated                          on each ball for each of the possible outcomes. 
  • 7.   For 1st Inning  1. x0 = - 0.00007*Rank_diff + 0.01856*Ball_remaining - 0.215148*Wicket_remainig - 0.05479  2. x1 = 0.00057*Rank_diff - 0.00838*Ball_remaining + 0.055152*Wicket_remainig - 0.34979  3. x2 = 0.00099*Rank_diff - 0.01164*Ball_remaining + 0.080700*Wicket_remainig - 2.44566  4. x4 = - 0.00107*Rank_diff - 0.00387*Ball_remaining + 0.160612*Wicket_remainig - 3.13587  5. x6 = - 0.00165*Rank_diff - 0.02436*Ball_remaining + 0.314123*Wicket_remainig - 4.15646  6. xW = - 0.00199*Rank_diff - 0.01238*Ball_remaining + 0.014393*Wicket_remainig - 2.31583      For 2nd Inning  1. x0 = - 0.000257*rank_diff + 0.018408*Ball_remaining - 0.004386*Runs_remaining -  0.125313*Wktremain -0.34237  2. x1 = 0.00018*rank_diff - 0.011771*Ball_remaining + 0.002616*Runs_remaining +                0.053257*WktRemain - 0.397337  3. x2 = 0.000994*rank_diff - 0.007598*Ball_remaining + 0.000396*Runs_remaining +                0.024646*Wktremain -2.238433  4. x4 = -0.000979*rank_diff - 0.0024*Ball_remaining + 0.002929*Runs_remaining +                0.098909*Wktremain - 2.95531  5. x6 = 0.000733*rank_diff - 0.023353*Ball_remaining + 0.005015*Runs_remaining +                0.152199*Wktremain - 3.29799  6. xW = -0.003198*rank_diff - 0.011384*Ball_remaining + 0.003907*Runs_remaining -                0.018718*Wktremain -2.507615    Formula to calculate the probability of event happening on each ball        P: probability of Y occuring   e: natural logarithm base   b0: interception at y-axis   b1: line gradient   bn: regression coefficient of Xn   X1: predictor variable   
  • 8. The X1 predicts the probability of Y. The difference between the linear model and the logistics is                                  that the linear regression predicts the value of Y whereas in the Logistic model it predicts the                                  probability of Y by taking a specific value. In this case x1, x2...xW is calculated. Then those                                  values were put in the above equation and the probability is calculated. The final probability is                                normalized so that it doesn’t exceed one.    These equations are formed by the binary logistic model. The rank_diff was not significant but                              still, we took as it is better if to have one more variable.      Results :  A simulator was implemented in Matlab to run the 2016 T20 Cricket world cup. For the                                tournament each version i.e. 120 balls tournament and 100 ball tournament were run for 10000                              times. There are 23 matches with 20 league and 3 knockout including the finals. 10 teams were                                  distributed in 2 groups of 5.   From the simulation results, we can see the probability of winning for the lower ranked team has                                  increased in the knockout stage compare to the higher ranked team whereas it has decreased in                                the league stage. It implies that the clearing group stage is more difficult than winning the                                knockout matches. The striking feature is Pakistan and New Zealand decrease in the chances                            of qualifying to -4.62%. 3rd in pool implies that they won’t be finishing 3rd and hence more                                  chances of qualifying in the knockout stages or lower in pool. Whereas Higher ranked team like                                india and Sri Lanka has ~3.6% higher chance to finish 3rd.       Stage   Sri Lanka  India  Australia  West Indies  Pakistan  New  Zealand  South  Africa  England  Bangladesh  Afghanistan  Winners  -52  -87  -49  -37  64  74  50  12  13  12  Finalists  -215  -98  -87  -49  18  47  149  89  148  -2  Losing SF  -265  -286  -25  -42  156  56  147  149  37  73  3rd in pool  369  331  -99  -58  -462  -462  -65  -119  281  284  4th in pool  -45  -65  213  152  195  264  -93  -40  -307  -274  5th in pool  208  205  47  34  29  21  -188  -91  -172  -93  Table 2. Shows the difference of team winning in 100 and 120 ball tournament. (Number of times winning in                                      100 minus the number of times winning in 120 ball)    Another feature is the increase in the Average number of boundaries and decrease in the zeros                                and ones. There are increase in the percentage of 4s more in compare to 6s. More the number                                    of boundaries scored throughout match demands more power hitter and an aggressive                        approach     
  • 9.   Table 3. Shows the average percentage changes in occuring of each event. (Percentage in 100 minus the                                  percentage in 120 ball)          Fig 3. Graphical representation of average percentage changes in occuring of each event. (Percentage in                              100 minus the percentage in 120 ball)              Conclusion​:  It is clearly seen from the results that the shorter the format higher the chances of winning a                                    team in knockout stages though in the league format the higher ranked has more chances of                                qualifying. The scoring pattern demands for more batsman who can hit boundaries than who                            can take 1s and 2s. More boundaries mean more entertainment which is good for game and the                                  money.   
  • 10.   Bibliography  Alan C. Kimber and Alan R. Hansford, Journal of the Royal Statistical Society. Series A                              (Statistics in Society), Vol. 156, No. 3 (1993), pp. 443-455    Philip Scarf, Xin Shi and Sohail Akhtar, Journal of the Royal Statistical Society. Series A                              (Statistics in Society), Vol. 174, No. 2 (APRIL 2011), pp. 471-497    Sirsai, ​A Bayesian stochastic model for team performance evaluation in T20 cricket:                        Effectiveness of Power Hitting & Consistency, ​July 20, 2016    Tim B. SWARTZ, Paramjit S. GILL and Saman MUTHUKUMARANA, The Canadian Journal of                          Statistics / La Revue Canadienne de Statistique, Vol. 37, No. 2 (June/juin 2009), pp. 143-160