
Recommended
More Related Content
What's hot
Viewers also liked
Similar to Spreadsheet analysis
Similar to Spreadsheet analysis (20)
Recently uploaded
Recently uploaded (20)
Spreadsheet analysis
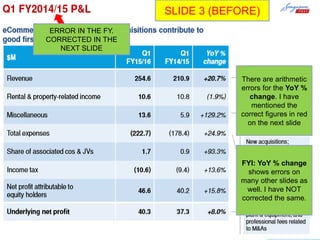
- 1. | 0 SLIDE 3 (BEFORE) ERROR IN THE FY. CORRECTED IN THE NEXT SLIDE There are arithmetic errors for the YoY % change. I have mentioned the correct figures in red on the next slide FYI: YoY % change shows errors on many other slides as well. I have NOT corrected the same.
- 2. | Q1 FY2015/16 P&L 1 9.4 0.9 5.9 1.7 Underlying net profit 40.3 Share of associated company & JVs 222.7 178.4 37.3 Net profit attributable to equity holders 46.6 40.2 Income tax 10.6 Total expenses 210.9 Revenue 254.6 10.6 13.6 Rental & property- related income Miscellaneous 10.8 Q1 FY15-16Q1 FY14-15 eCommerce related growth and acquisitions contribute to good first quarter performance YoY % change +130.5 +24.8 +88.9 +12.8 +15.9 +20.7 (1.9) +129.2 +24.9 +93.3 +13.6 +15.8 +8.0 $ Millions Excluding one-off gains on disposals of subsidiaries, property, plant & equip- ment; and professional fees related to M&As New acquisitions; ecommerce related growth One-off gains on disposals of subsidiaries. Property, plant & equipment New acquisitions; investment in transformation SLIDE 3 (AFTER)
- 3. | 2 SLIDE 4 (BEFORE)
- 4. | Mail & Digital Services: Q1 FY2015/16 Performance 3 123.2 28.4% Operating profit* OP margin* 31.1% 38.9 35.0 Revenue 125.1 Q1 FY14-15 Q1 FY15-16 • Decline in hybrid mail revenue from the disposal of novation solutions and Datapost HK in Q1; Datapost sale expected to be completed in Q2 • Improved profitability from the group’s focus on productivity and efficiency to manage higher operating costs 0.7 9.8 0.8 8.0 International mail 50.3 50.3 Hybrid mail Domestic mail 62.5 Philatelic 66.1+1.6 +10.9 +5.7 (18.7) +22.2 +0.1 $ millions Mail & Digital Services segment performance Mail & Digital Services revenue breakdown % YoY % change * Excluding one-off gain from disposal of subsidiaries SLIDE 4 (AFTER) VERSION 1
- 5. | Mail & Digital Services: Q1 FY2015/16 Performance 4 31.1% Operating profit* 38.9 Revenue 123.2 28.4% 35.0 OP margin* 125.1 Q1 FY15-16Q1 FY14-15 • Decline in hybrid mail revenue from the disposal of novation solutions and Datapost HK in Q1; Datapost sale expected to be completed in Q2 • Improved profitability from the group’s focus on productivity and efficiency to manage higher operating costs +1.6 +10.9 +1.6 (18.7) +22.2 +0.1 $ millions Mail & Digital Services segment performance Mail & Digital Services revenue breakdown % YoY % change * Excluding one-off gain from disposal of subsidiaries 9.8 62.5 Philatelic Domestic mail Internat- ional mail 125.2 66.1 50.3 0.7 Hybrid mail8.0 50.3 0.8 123.3 +5.7 SLIDE 4 (AFTER) VERSION 2
- 6. | 5 SLIDE 5 (BEFORE)
- 7. | Logistics: Q1 FY2015/16 Performance 6 3.8 6.7 OP margin 4.7% Operating profit 3.9% Revenue 140.1 97.6 Q1 FY14-15 Q1 FY15-16 • Acquisitions and growth in ecommerce related business underpinned Logistics division’s performance • Higher operating profit from inclusion of new subsidiaries Others* Famous holdings 46.6 22.5 40.2 34.8 23.5 Quantum solutions 69.9 +43.6 +74.6 +74.0 +33.9 +4.2 $ millions Logistics segment performance Logistics revenue breakdown % YoY % change * Others comprise General storage and Singapore Parcels SLIDE 5 (AFTER) VERSION 1
- 8. | 7 SLIDE 6 (BEFORE)
- 9. | Retail & eCommerce: Q1 FY2015/16 Performance 8 2.9 1.1 12.5% Operating profit Revenue 4.7% OP margin 24.1 22.8 Q1 FY15-16Q1 FY14-15 • Growth in ecommerce business with customer acquisitions and higher traffic; decline in financial services • Continued investments in developing ecommerce business 6.0 6.3 5.5 7.8 eCommerce Agency services & retail products 10.8 10.5 Financial services +5.6 (60.6) +23.3 (9.2) 3.5 $ millions Retail & eCommerce segment performance Retail & eCommerce revenue breakdown % YoY % change * Others comprise General storage and Singapore Parcels SLIDE 6 (AFTER) VERSION 1