DESIGN MONOPILE FOUNDATION OF OFFSHORE WIND TURBINES
Exjobb_Rapport-Dejan_Koren-v2.8-RedQual
1. IN ,DEGREE PROJECT ENGINEERING MECHANICS 120 CREDITS
SECOND CYCLE
,STOCKHOLM SWEDEN 2015
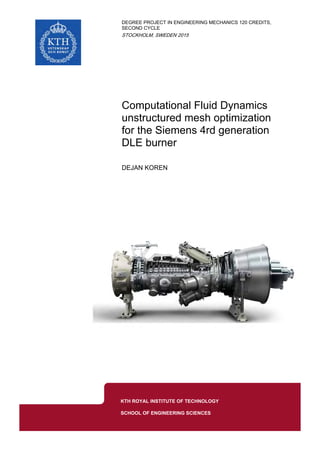
Computational Fluid Dynamics
unstructured mesh optimization
for the Siemens 4rd generation
DLE burner
DEJAN KOREN
KTH ROYAL INSTITUTE OF TECHNOLOGY
SCHOOL OF ENGINEERING SCIENCES
2. Master’s thesis
Computational Fluid Dynamics unstructured mesh
optimization for the Siemens 4rd
generation DLE
burner
Dejan Koren
Industrial Supervisors: Dr. Daniel Lörstad
Dr. Darioush Gohari Barhaghi
Siemens Turbomachinery AB, Finspång, Sweden
Academic Supervisor: Dr. Bernhard Semlitsch
KTH, Royal Institute of Technology
Examiner: Dr. Mihai Mihaescu
KTH, Royal Institute of Technology
Finspång, October 2015
6. vi
ABSTRACT
Every computational fluid dynamics engineer deals with a never ending story – limited
computer resources. In computational fluid dynamics there is practically never enough
computer power. Limited computer resources lead to long calculation times which result in
high costs and one of the main reasons is that large quantity of elements are needed in a
computational mesh in order to obtain accurate and reliable results.
Although there exist established meshing approaches for the Siemens 4th
generation DLE
burner, mesh dependency has not been fully evaluated yet. The main goal of this work is
therefore to better optimize accuracy versus cell count for this particular burner intended for
simulation of air/gas mixing where eddy-viscosity based turbulence models are employed.
Ansys Fluent solver was used for all simulations in this work. For time effectivisation
purposes a 30° sector model of the burner was created and validated for the mesh
convergence study. No steady state solutions were found for this case therefore time
dependent simulations with time statistics sampling were employed. The mesh convergence
study has shown that a coarse computational mesh in air casing of the burner does not affect
flow conditions downstream where air/gas mixing process is taking place and that a major
part of the combustion chamber is highly mesh independent. A large reduction of cell count in
those two parts is therefore allowed. On the other hand the RPL (Rich Pilot Lean) and the
pilot burner turned out to be highly mesh density dependent. The RPL and the Pilot burner
need to have significantly more refined mesh as it has been used so far with the established
meshing approaches. The mesh optimization has finally shown that at least as accurate results
of air/gas mixing results may be obtained with 3x smaller cell count. Furthermore it has been
shown that significantly more accurate results may be obtained with 60% smaller cell count as
with the established meshing approaches.
A short mesh study of the Siemens 3rd
generation DLE burner in ignition stage of operation
was also performed in this work. This brief study has shown that the established meshing
approach for air/gas mixing purposes is sufficient for use with Ansys Fluent solver while
certain differences were discovered when comparing the results obtained with Ansys Fluent
against those obtained with Ansys CFX solver. Differences between Fluent and CFX solver
were briefly discussed in this work as identical simulation set up in both solvers produced
slightly different results. Furthermore the obtained results suggest that Fluent solver is less
mesh dependent as CFX solver for this particular case.
8. viii
ACKNOWLEDGMENTS
This work was carried out as the final part of the Master’s program in Engineering
Mechanics at KTH, Royal Institute of Technology in Stockholm. Since everything started
there I would like to thank this great institution with dr. Gunnar Tibert as, at that time, the
Engineering Mechanics program director for giving me the honor of exploring a challenging
but very interesting field of Fluid mechanics at the Department of Mechanics.
The project was carried out exclusively at Siemens Industrial Turbomachinery AB in
Finspång therefore I would like to thank the Combustion group with Anders Häggmark as
its manager for giving me the honor of performing my master thesis at their division.
I would like to express special gratitude to my first supervisor at Siemens, dr. Daniel
Lörstad, whose expertise, understanding, patient guidance and all time positive energy
added considerably to my master thesis project experience. I appreciate his vast knowledge
and experience in Computational Fluid Dynamics and besides that also his strong pedagogic
skills.
Furthermore I would like to thank my second supervisor dr. Darioush Gohari Barhaghi for
helping me with his kind guidance. I would also like to thank Daniel Moëll and Anders
Ljung for providing me with technical help regarding setting up simulations and meshing
procedures.
I would like to thank Charlotte Eklöf for being a great project manager in the group.
I wish to acknowledge also my master thesis colleague Johan Sjölander for a great project
collaboration and for being a great residence company during my stay in Finspång.
A very special thank goes to my girlfriend Polona Gunde for her love and endless support
especially during critical phases of my studies and this thesis work.
My gratitude goes out as well to dr. Marta Klanjšek Gunde and dr. Jasmina Kožar Logar for
giving me a great deal of motivation boost to pursue a Master’s Degree in this challenging
branch of classical mechanics.
I would also like to thank my supervisor dr. Bernhard Semlitch and examiner dr. Mihai
Mihaescu at KTH for helping me with the final shaping of this work.
Lastly I wish to thank my family; mother Vera, father Franc and brother Matej, for
supporting me in my desire to broaden my views and horizons abroad through my studies
and this work.
10. x
CONTENTS
Abstract ........................................................................................................................................... vi
Acknowledgments.........................................................................................................................viii
Contents............................................................................................................................................ x
List of figures .................................................................................................................................. xi
List of tables................................................................................................................................... xii
Nomenclature ................................................................................................................................xiii
List of abbreviations and acronyms................................................................................................ xv
1 Introduction......................................................................................................................... 1
1.1 Background.................................................................................................................... 1
1.2 Objective........................................................................................................................ 1
1.3 Siemens and gas turbines............................................................................................... 2
1.4 Gas turbines ................................................................................................................... 3
1.5 The Dry Low Emissions Combustors............................................................................ 9
2 Theoretical background ................................................................................................... 13
2.1 Governing equations in Fluid Mechanics .................................................................... 13
2.2 Turbulence ................................................................................................................... 14
2.3 Turbulence modelling.................................................................................................. 15
2.4 Species transport.......................................................................................................... 21
2.5 Numerical methods...................................................................................................... 22
3 Methodology...................................................................................................................... 30
3.1 Geometry and mesh creation ....................................................................................... 30
3.2 Models and solution methods ...................................................................................... 31
3.3 Computational mesh optimization............................................................................... 33
3.4 Representation of results.............................................................................................. 34
4 A short study of the 3rd
generation DLE burner............................................................ 35
4.1 Geometrical model....................................................................................................... 35
4.2 Computational mesh .................................................................................................... 35
4.3 Boundary conditions and solution methods................................................................. 36
4.4 Results.......................................................................................................................... 39
4.5 Conclusion remarks for the short 3rd
generation DLE burner study............................ 44
5 The 4th
generation DLE burner computational mesh optimization............................. 45
5.1 Geometrical model....................................................................................................... 45
5.2 Boundary conditions and time step size....................................................................... 47
5.3 The reference mesh...................................................................................................... 48
5.4 Validation of the 30° sector model .............................................................................. 49
5.5 The mesh optimization................................................................................................. 54
6 Discussion and suggestions for future work................................................................... 72
References............................................................................................................................. 75
Appendix............................................................................................................................... 77
11. xi
LIST OF FIGURES
Figure 1: The portfolio of Siemens gas turbines [34]........................................................................................... 3
Figure 2: Two-shaft gas turbine [6]...................................................................................................................... 4
Figure 3: Brayton cycle pressure-volume diagram for a unit mass of working fluid [6] ..................................... 4
Figure 4: Examples of gas turbine configurations: (1) turbojet, (2) turboprop, (3) turboshaft, (4) high-bypass
turbofan, (5) low-bypass turbofan with afterburner [8] .............................................................................. 5
Figure 5: Two-shaft gas turbine Siemens SGT-700 [9]........................................................................................ 5
Figure 6: An early combustion chamber [12]....................................................................................................... 6
Figure 7: Flame stabilizing and general airflow pattern [12] ............................................................................... 6
Figure 8: Multiple combustion chambers [12] ..................................................................................................... 7
Figure 9: Tubo-annular combustion chamber [12]............................................................................................... 8
Figure 10: Annular combustion chamber [12] ..................................................................................................... 8
Figure 11: A schematic comparison of a typical DLE combustor and a conventional combustor....................... 9
Figure 12: The SGT-800 [35]............................................................................................................................. 10
Figure 13: The Siemens 3rd
generation DLE burner [2]..................................................................................... 10
Figure 14: The SGT-750 [37]............................................................................................................................. 11
Figure 15: The 4th
generation DLE burner [38].................................................................................................. 11
Figure 16: Illustration of cell-centered (left) and vertex-centered (right) type control volume constructions [23]
.................................................................................................................................................................. 24
Figure 17: Dual median grid construction [24] .................................................................................................. 24
Figure 18: Median dual control volume constructed at sharp edge corner [22]................................................. 24
Figure 19: Solution reconstruction for vertex-centered and cell-centered formulation in 2D unstructured mesh
[22] ........................................................................................................................................................... 25
Figure 20: Flowchart illustrating Fluent solver algorithms [25] ........................................................................ 28
Figure 21: Cutting the geometry through the air casings damp holes ................................................................ 30
Figure 22: Normalized velocity in two different monitor points........................................................................ 32
Figure 23: Splitting a tetrahedron [30]............................................................................................................... 33
Figure 24: Geometrical model of the 3rd generation DLE burner computational domain................................. 35
Figure 25: Comparison of the original and splitted surface computational mesh .............................................. 36
Figure 26: Monitor points locations for the 3rd
generation DLE burner............................................................. 37
Figure 27: Monitoring velocity in the Point 1, 3 and 5 and monitoring methane mass fraction in Point 1........ 37
Figure 28: Comparison of the time averaged velocity field results between the two meshes on the Plane 1..... 39
Figure 29: The planes on which the evaluation lines can be seen...................................................................... 39
Figure 30: Comparison of the time averaged velocity field results between the two meshes ............................ 40
Figure 31: Comparison of the predicted velocity field between Fluent and CFX.............................................. 40
Figure 32: Comparison of the predicted turbulence kinetic energy distribution between Fluent and CFX ....... 41
Figure 33: Time averaged equivalence ratio distribution for all four cases ....................................................... 42
Figure 34: Time averaged velocity distribution along the lines for all cases ..................................................... 43
Figure 36: The geometric model of the 90° sector of the burner........................................................................ 46
Figure 37: The geometric model of the 30° sector of the burner........................................................................ 47
Figure 38: Boundary conditions......................................................................................................................... 47
Figure 39: The reference computational mesh for the 30° sector model (SIT4.2M). The inflation layer is
marked with the red line. .......................................................................................................................... 49
Figure 40: Positions of the monitor points used for validating the 30° sector model (data obtained from the
points shaded with red color can be seen in the Figure 41) ...................................................................... 49
Figure 41: Monitoring velocity and methane mass fraction in the chosen points .............................................. 50
Figure 42: Positions of the evaluation lines for all cases ................................................................................... 51
Figure 43: Comparison of the time averaged velocity field between the 30° and 90° sector model.................. 51
Figure 44: Comparison of the time averaged equivalence ratio field between the 30° and 90° sector model.... 52
12. xii
Figure 45: Comparison of the time averaged velocity and equivalence ratio between the models along the lines
which are illustrated in the combustor cross section view........................................................................ 53
Figure 46: The original generated mesh with 0.55 million cells – 0.55M mesh ................................................ 54
Figure 47: Positions of the new monitor points.................................................................................................. 56
Figure 48: Monitored velocity and methane mass fraction in “the three meshes” in the points shown in the
cross section view of the combustor and additionally also remaining two meshes in the Point 16 (the
My1.9M and the SIT4.2M mesh) ............................................................................................................. 57
Figure 49: Comparison of time averaged velocity field in the whole domain and instantaneous axial velocity
field in the RPL burner obtained with the four meshes ............................................................................ 58
Figure 50: Comparison of time averaged equivalence ratio field in the whole domain obtained with the four
meshes ...................................................................................................................................................... 58
Figure 51: Velocity and equivalence ratio distribution along the lines obtained from different meshes ........... 60
Figure 53: Monitored velocity and methane mass fraction in the same chosen points as shown in the Figure 48
but with included monitored data obtained from the optimized mesh (OPT1.4M) .................................. 62
Figure 54: Positions of the interfaces at which the data in the Table 4 is extracted (shaded with red color)..... 63
Figure 56: Comparison of the time averaged velocity field in the whole domain and instantaneous axial
velocity field in the RPL burner obtained with the optimized mesh (OPT1.4M), the reference mesh
(SIT4.2M) and the fine mesh (35M)......................................................................................................... 65
Figure 58: Velocity and equivalence ratio distribution along the lines obtained from different meshes with
added results obtained from the optimized mesh...................................................................................... 67
Figure 59: Velocity and equivalence ratio distribution along the line marked in the bottom picture and
corresponding scatter diagram of node values on the plane the line is lying on. The scatter diagram of
two-dimensional data recreates the lines almost exactly and thereby confirms that there is nearly no
variation of velocity and equivalence ratio on this plane in the tangential direction................................ 68
Figure 60: Time averaged velocity and equivalence ratio distribution at the pilot tip ....................................... 69
Figure 61: The region in which the grid cells are adapted (splitted) .................................................................. 69
Figure 62: Equivalence ratio distribution directly downstream the pilot exit obtained with the OPT1.8M mesh
and the 35M mesh..................................................................................................................................... 70
Figure 63: Equivalence ratio distribution discrepancy along Line 1 corrected with the OPT1.8M mesh.......... 70
Figure 64: Predicted time averaged equivalence ratio distribution at the pilot tip obtained with the OPT1.8M
and the 35M mesh..................................................................................................................................... 71
LIST OF TABLES
Table 1: Model coefficients values [16]............................................................................................................. 20
Table 2: Boundary conditions for all runs ......................................................................................................... 48
Table 3: The main meshes for the mesh study and normalized physical simulation time (= number of flow-
throughs) of the time dependent runs with the corresponding mesh......................................................... 55
Table 4: Comparison of time and area averaged normalized velocity, instantaneous mass flow, time and
area averaged equivalence ratio and mass flow averaged equivalence ratio on the crucial interfaces
between specific passages in the domain. The values are compared against the 35M mesh. The
differences are max 2% except in the cells shaded with green or red color.............................................. 63
13. xiii
NOMENCLATURE
specific heat capacity at constant volume / ∙
internal energy per unit volume /
body force per unit mass vector /
enthalpy per unit volume /
length scale
mass flow /
normalized mass flow
normal vector
pressure
fluctuation part of pressure /
heat flux vector /
vector pointing from vertex j to vertex j m
time
flow-through time
velocity component in x direction /
, velocity vector /
fluctuation part of velocity vector /
spatial coordinate
non-dimensional wall distance
turbulent model constant
turbulent model constant
turbulent model constant
arbitrary spatial discretization
turbulent diffusivity /
total energy per unit volume /
convective flux terms
viscous flux terms
diffusion flux of species /
kinetic energy per unit mass /
length
mean pressure
kinetic energy production term /
external heat source per unit volume /
specific gas constant / ∙
surface area
turbulent Schmidt number
mean flow strain rate tensor
user defined source term for turbulence kinetic energy
user defined source term for turbulent frequency
temperature °
conservative variables terms
mean velocity vector /
left state for upwind discretization
right state for upwind discretization
velocity scale /
volume
mass fraction of species
14. xiv
Greek letters
turbulent model constant
smoothing constant for exponential moving average
turbulent model constant
nonlinear blending function for High resolution scheme in CFX
Cronecker delta function
turbulence kinetic energy dissipation rate /
length scale
dynamic viscosity / ∙
(dynamic) turbulent viscosity / ∙
kinematic viscosity /
(kinematic) turbulent viscosity /
invariant of the mean flow strain rate tensor
viscous stress tensor
density /
̅ average density /
turbulent model constant
turbulent model constant
turbulent model constant
arbitrary quantity
general turbulent model coefficient
equivalence ratio –
limiter function at vertex j
turbulence frequency
15. xv
LIST OF ABBREVIATIONS AND ACRONYMS
CFD Computational Fluid Dynamics
DBCS Density Based Coupled Solver
DLE Dry Low Emissions
EMA Exponential Moving Average
HRIC High Resolution Interface Capturing
IP Integration Point
LES Large Eddy Simulation
MMA Modified Moving Average
MUSCL Monotone Upstream-Centered Schemes for Conservation Laws
PBCS Pressure Based Coupled Solver
QUICK Quadratic Upstream Interpolation for Convective Kinematics
RANS Reynolds Averaged Navier-Stokes Equation
RPL Rich Pilot Lean
RSM Reynolds Stress Model
SGT Siemens Gas Turbine
SIMPLE Semi-Implicit Method for Pressure-Linked Equations
SIT Siemens Industrial Turbomachinery
SST Shear Stress Transport
STAL Svenska Turbinfabriks Aktiebolaget Ljungström
WLE Wet Low Emissions
16. -1-
1 Introduction
1.1 Background
Design and operation of today’s modern gas turbines and their combustion systems face the
need to combine high efficiency with low emissions, good flame stability and at the same
time to reduce development and production costs. Computational Fluid Dynamics (CFD)
implemented with different combustion models has become a powerful tool to address this
issue. Combustion modelling using CFD has certainly reduced costs of developing a
combustion chamber of a gas turbine. Although available computer power is continuously on
the rise so are also the turbulence models and combustion models more and more advanced.
Consequently our demand for computer resources is also constantly on the rise. In fact in the
case of Computational Fluid Dynamics there is never enough computer power. Every CFD
engineer eventually faces the fact that there is always a limited computer power available and
if a commercial CFD code is used, there is also a limited number of costly parallel licences
available.
There is always a need to make a consensus. How detailed has to be the physical model?
Which part of the combustor is a point of interest? Computer resources are often associated
with the choice of turbulence model. Which level of details is needed when resolving the
turbulence? More detailed models always need considerably more computer resources but
detailed models are not always of engineering interest. One solution to reduce demanding
computer power is to optimally choose the level of details and the other important aspect in
Computational Fluid Dynamics is also to choose an optimum computational mesh. The
resolution of a computational mesh greatly affects computer power demands. Higher mesh
resolution in most cases contribute to better results but there is, however, often some room to
reduce mesh resolution in order to save some solution time and still obtain acceptable results.
1.2 Objective
This thesis work deals mainly with a computational mesh study for the combustor of the new
Siemens gas turbine SGT-750. One of the most important contributions to achieve desired
quality of combustion is effective mixing of fuel and oxidant. As an efficient combustion
process always starts with efficient mixing of reactants the mesh study is conducted on the
basis of merely fuel and oxidant mixing. There already exists an established meshing
approach for the new 4th
generation DLE burner but due to highly complex geometry
relatively high amount of grid cells are needed. The primary objective of this thesis is
consequently to answer to the question if it is possible to reduce the number of grid cells for
the burner and still obtain acceptable results and thereby reduce solution times or with other
words – solution costs. A side objective in this work was also to present the main differences
between commercial CFD codes Ansys CFX and Ansys Fluent with application of the codes
on the combustor which is employed in the older Siemens gas turbine, the SGT-800.
Summarizing the main objectives of this thesis would thus be:
Computational mesh optimization for the 4th
generation DLE burner with the main goal
to minimize the cell count using Ansys Fluent software
Show the differences in results between CFD codes Ansys Fluent and Ansys CFX with
application on the ignition stage of the 3rd
generation DLE burner
17. -2-
1.3 Siemens and gas turbines
1.3.1 A brief history of Siemens establishment
The global company Siemens has evolved from a small back building workshop in Berlin in
1847 known then as the Telegraphenbauanstalt von Siemens & Halske. Within a few decades
the small precision-engineering and electrical telegraph systems primarily producing
workshop developed into one of the world’s largest companies in electrical engineering and
electronics. The founder Werner Siemens, who was known as Werner von Siemens after
1888, had discovered the dynamoelectric principle in 1866 and after that the potential
applications for electricity were limitless. With the help of Siemens innovations, heavy-
current engineering began to evolve at a breath taking pace. The first electric railway operated
at the Berlin Trade Fair in 1879 together with the first electric streetlights installation in the
Kaisergalerie. In 1880 the first electric elevator was built in Mannheim and in 1881 the
world’s first electric streetcar went into operation in Berlin-Lichterfelde. The name of
Siemens had then become synonymous with electrical engineering. After Werner von
Siemens’ death in 1892 his successors followed the course he had set and constantly
advancing the company. Lighting, medical engineering, wireless communication, and in the
1920s household appliances were introduced. After World War II those were followed by
components, data processing systems, automotive systems and semiconductors. The goal was
apparent – to cover the whole electrical engineering, both light- and heavy-current electrical
engineering. [1]
In spite of the difficult political and economic conditions after World War I and after World
War II when the company was nearly completely destroyed had Siemens again regained its
former leading position in the world marketplace. The year 1966 represented a milestone in
the company’s development when the various activities and competences of the company,
Siemens & Halske AG, Siemens-Schuckertwerke AG and Siemens-Reiniger-Werke AG
merged to form Siemens AG. [1]
GAS TURBINES AT SIEMENS
As in 1866 Werner von Siemens discovered the dynamo-electric principle and thus enabled to
convert mechanical energy into electrical energy in an economical way, the invention gave
obvious means to manufacture also steam and gas turbines. Experimental gas turbines had
been however around in different forms since the early 1900s [4]. The first successful gas
turbine using rotary compressor and turbine was built by a Norwegian Aegidius Elling in
1903. It produced excess power of about 8kW [7]. Siemens established the first commercial
gas turbine power plant in Switzerland in the year of 1939 and then the year 1972 represents
the start of series production of a gas turbine with power output of 62.5 MW at the Berlin
plant. In 1980 was at the same site produced the world’s largest gas turbine (125 MW). The
record is still being held by Siemens as in 2011 the world record was set by the SGT5-8000H
which has a power output of mighty 400 MW. [3]
FROM STAL TO SIEMENS IN FINSPÅNG, SWEDEN
Roots of the industry in Finspång go all the way back to 1400s. The serious industry started in
1631 when the Dutchman Louis De Geer bought Finspongs Bruk from the royal family and
after that was Finspång one of the biggest cannon manufacturers in the world for a few
centuries. [5]
Swedish turbine history goes back to 1893 when Gustav De Laval starts De Laval Ångturbin
AB in Stockholm. In 1913 start brothers Birger och Fredrik Ljungström manufacture their
18. -3-
counter rotating radial steam turbine in Finspång under the name Svenska Turbinfabriks
Aktiebolaget Ljungström - STAL. With the end of 1950 the two companies unite under the
name Stal-Laval and develop steam turbine powered boats with great success. Already in
1944 begins development in the area of gas turbines. Under commission of Swedish Air
Forces development of three different jet engines was performed but at the end the Air Forces
choose a foreign engine. STAL quickly turns the knowledge into stationary turbines. In 1955
the turbine GT35 was presented which was based on the intended jet engine. The turbine had
originally output of 10MW and is today in its fourth generation and gives 17 MW – the model
is in fact SGT-500. The company has had many names but today is it known as Siemens
Industrial Turbomachinery AB since 2003 when the concern Siemens bought the company
then known as Alstom Power Sweden AB. [5]
Figure 1: The portfolio of Siemens gas turbines [34]
The Figure 1above shows the complete portfolio of the gas turbines produced by Siemens.
The wide gas turbine range has been designed and tailored to meet the challenges of the
dynamic market environment. With capacities ranging from 4 to 400 MW those models fulfill
the high requirements of a wide spectrum of applications in terms of efficiency, reliability,
flexibility and environmental compatibility. [34]
1.4 Gas turbines
A gas turbine is a type of internal combustion engine which in its most basic form consists of
an upstream rotating compressor coupled to a downstream turbine with a combustion chamber
in between. In the Figure 2 it can be seen the more advanced two-shaft gas turbine similar to
in the thesis mainly studied the new model SGT-750. The most simple single shaft turbine is
on the other hand without the power turbine shown in the Figure 2 (no 3’- 4 stage). An
example of a single shaft engine combustor is also briefly studied in this work, more
particularly the burner of the model SGT-800.
19. -4-
Figure 2: Two-shaft gas turbine [6]
As opposed to the internal combustion piston engine, gas turbine combustion is a continuous
process. For a turbine to produce a useful power, it must have a higher inlet pressure than the
pressure at the exit. To achieve this compressor is used to compress the ambient air to a
higher pressure (stage 1-2), energy is then added in the combustor by adding fuel in the air
and igniting it so that the combustion process generates a high-temperature flow (stage 2-3).
This high temperature and high pressure gas then enters the turbine which produces shaft
work output (stage 3-3’). The turbine shaft work is in the first place used to drive its own
compressor (approximately two thirds) and the net produced power (indicated by curve 3’- 4
in Figure 3) can finally be used for many different applications although gas turbines are
generally associated with aircraft jet propulsion systems. [7]
Figure 3: Brayton cycle pressure-volume diagram for a unit mass of working fluid [6]
The Figure 4 summarizes the basic applications of the net produced power and thereby the
basic types of gas turbine configurations. If the net power is not transferred further we can
basically speak about a turbojet engine where hot high-speed exhaust gases exit the turbine
and consequently push usually an aircraft in the opposite direction. If the shaft is coupled to a
propeller then we usually speak about turbo propeller or shortly turpoprop.
20. -5-
Figure 4: Examples of gas turbine configurations: (1) turbojet, (2) turboprop, (3) turboshaft, (4) high-bypass
turbofan, (5) low-bypass turbofan with afterburner [8]
Instead of a propeller a larger ventilator can be installed and so we get a (high-bypass)
turbofan engine which is nowadays mostly used by commercial passenger aircraft. Low-
bypass turbofans with afterburner are generally used by supersonic military aircraft. When a
turbine is employed to produce mechanical power we usually refer to a turboshaft engine and
in this group of gas turbines we can also find industrial turbines employed to drive various
loads such as electric generators, process compressors, pumps etc. [7]
As illustrated in the Figure 2 the hot gases exiting the main turbine (usually referred as the
compressor turbine) can drive another turbine (power turbine) which is disconnected from the
main shaft and this way we get two-shaft gas turbine. Gas turbines operating with a power
turbine are often used when there is a significant variation in the speed needed for the load.
Examples are pipelines compressors or pumps where conditions can demand a low speed load
but with high power demand. In those situations the gas turbine can operate at its maximum
speed (to achieve maximum power) and the power turbine can run at the speed of the load. [7]
Figure 5: Two-shaft gas turbine Siemens SGT-700 [9]
21. -6-
1.4.1 Combustion chambers
Let us start with the introduction to the main topic of this work – combustion chambers or
combustors. Combustor design is a complex task, often referred to as a “black art”, as it is
among all gas turbine engines’ components usually perceived as the least understood.
Discharged air from the engine compressor exits at a very high velocity. In order to avoid
unnecessary losses the first thing to after the compressor exit is to decelerate velocity – to
diffuse it and raise its static pressure. After the reduction of the dynamic pressure, the air then
enters the combustor burner and/or cooling system. [2] [10]
Figure 6: An early combustion chamber [12]
Since the speed of burning air and fuel mixture is usually only of the order of a few meters per
second the flame would still be blown away even in the diffused air stream. Therefore a
region of low or even negative axial velocity has to be created in the chamber and this is
achieved by swirl vanes. The flow from the swirl blades creates a region of low velocity
recirculation and it takes the form of a toroidal vortex (similar to a smoke ring). The vortex
thereby stabilizes and anchors the flame as seen in the Figure 7. It could for example be
arranged that the fuel injection from the nozzles intersects the recirculation vortex where the
fuel is together with general turbulence effectively mixed. [12]
Figure 7: Flame stabilizing and general airflow pattern [12]
A typical combustion process releases gases with temperature at about 1800-2000°C which is
far too hot for entry to the guide vanes of the turbine. Some portion of compressed air is
therefore not used for combustion but is on the other hand progressively introduced into the
flame tube. Another portion of the compressor air can be used for cooling the walls of the
22. -7-
flame tube. Certainly the design of a combustion chamber can vary considerably, but the
airflow distribution used to affect and maintain combustion is always very similar to the
described. [12]
There are, however, three main types of combustion chamber in use for gas turbines. These
are the multiple chamber (Figure 8), the tubo-annular chamber (Figure 9) and the annual
chamber (Figure 10). The former type is often used in industrial gas turbine engines and so is
in the case of SGT-750.
MULTIPLE COMBUSTION CHAMBER
The chambers at multiple chambers combustor are arrayed around the engine. Compressor air
is directed by ducts to pass into the individual chambers where each chamber has an inner
flame tube around which there is an air casing. In the Figure 8 the flame tubes are all
interconnected which allows each tube to operate at the same pressure. This also allows
combustion to propagate around the flame tubes during engine starting but this is, however,
not the case for the SGT-750. The former has air casings interconnected instead and to be able
to ignite the chambers has each chamber its own ignitor. [12]
Figure 8: Multiple combustion chambers [12]
CAN-ANNULAR COMBUSTION CHAMBER
The can-annular combustion chamber is an example of an evolution link between the multiple
chamber and the annular type of chamber. A number of flame tubes are arrayed inside a
common air casing. Airflow in the flame tube is similar to the flow of the multiple chambers
already described. This configuration combines the easiness of maintenance and overhaul
with the compactness of the annular system. [12]
23. -8-
Figure 9: Tubo-annular combustion chamber [12]
ANNULAR COMBUSTION CHAMBER
The annual combustion chamber consists of a single flame tube which is completely in
annular form and contained in an inner and outer casing. The liner consists of continuous,
circular, inner and outer shrouds with distinctive holes in the shrouds which allow secondary
air to enter the combustion chamber and thereby keeping the flame away from the shrouds.
Fuel is introduced through a series of nozzles or burners equipped with swirler vanes at the
upstream end of the liners so that the airflow through the flame tube is still similar to the
already described. [12] [13]
Figure 10: Annular combustion chamber [12]
The main advantage of the annular chamber is that it is able to use the limited space most
effective. The construction itself is relatively simple but still permits high quality air and fuel
mixing. Because in comparison with a comparable tubo-annular chamber the wall area is
much higher, the amount of cooling air required to prevent flame tube overheating is less.
This reduction of cooling air raises the combustion efficiency to greatly eliminate unburned
24. -9-
fuel and oxidizes the carbon monoxide to carbon dioxide and thus reducing air pollution.
Another advantage is that the turbine inlet flow and temperature distribution in tangential
direction is more even which results in easier optimization of a turbine for high efficiency.
This type of combustion chamber has many advantages and at the same time considerably
saves weight and production costs but employing and developing this type of combustor has
two distinctive disadvantages – maintenance and testing. The construction does not allow
simple assembly, disassembly and inspection of the combustor chambers as the other two
types do. From testing point of view can combustors may be easily tested in single burner
high pressure combustion tests rigs without compromising the hat side design, while drastic
simplifications are required for basic tests of annular systems. A consequence of this
downside is that annular combustion system development projects have a larger risk of a
delay to fulfil project goals. This types of combustors are obviously the best candidates to be
employed in aircraft engines but not always in large industrial gas turbines. [12] [13]
1.5 The Dry Low Emissions Combustors
In the middle of the 1970s increased focus on environmental issues led to increased research
on new and better gas turbines with water and steam cooling methods which was called “Wet
Low Emission” (WLE). The best technology was in 1980s able to reduce NOx emissions to
42ppm and later to 25ppm. In the late 1980s the gas turbine producers started to develop “Dry
Low Emission” technology (DLE) to be able to avoid the technology that demanded water or
steam injection. The technology was then in the next ten years developed leading to a
reduction of NOx emissions less than 25ppm. [15]
This approach is to burn most (at least 75%) of the fuel at cool and fuel lean conditions to
prevent any major production of NOx. The principal strategy of such combustion systems is
to premix fuel and air before the mixture enters combustion chamber and to have a lean
mixture in order to lower the flame temperature and thus reduce NOx emission. Figure 11
shows a schematic comparison of a typical DLE combustor parallel with a conventional
combustor. Both are equipped with a swirler to create required flow conditions to stabilize the
flame but DLE burner has on the other hand much larger injector because it contains the
fuel/air premixing chamber. [15]
Figure 11: A schematic comparison of a typical DLE combustor and a conventional combustor
25. -10-
The DLE injector has (at least) two fuel circuits: main fuel and pilot fuel. Generally is most of
the fuel (the main fuel) injected into the airstream immediately downstream of the swirler at
the inlet to the premixing chamber. The pilot fuel is on the other hand injected directly into
the combustion chamber with little or no premixing. As the flame temperature is now closer
to the lean limit than in the conventional combustion system, the flame is now much more
prone to combustion instabilities and flame out. This tends to happen often when the engine
load is reduced and it would happen if no action was taken. The mixture would at this point
become either too lean to burn or would lead to combustion instabilities. A small proportion
of the fuel is therefore always burned richer to provide a stable “piloting” zone and the
remainder is burned lean. [15]
1.5.1 The Siemens SGT-800 and 3rd
generation DLE burner
In this work the new gas turbine SGT-750 is mainly discussed but beside this there is also a
brief mesh study and a comparison of the CFD results between two different solvers used
(Ansys CFX and Ansys Fluent) to simulate fuel and air mixing of the 3rd
generations DLE
burner during the ignition stage.
Figure 12: The SGT-800 [35]
The SGT-800 is available in three versions with power output of 47.5, 50.5 and 53.0 MW
respectively. The main design features of the most powerful version of the single shaft turbine
are 15-stage axial compressor with pressure ratio of 21.4:1, annular combustion chamber with
thirty 3rd
generation DLE burners and a 3-stage turbine design. It is used for electrical power
generation with possibility for combined heat and power generation. Electrical efficiency is
rated at 39 % and NOx emissions are kept below 15 ppm. [36]
Figure 13: The Siemens 3rd
generation DLE burner [2]
26. -11-
1.5.2 The Siemens SGT-750 and 4th
generation DLE burner
The new Siemens SGT-750 is a low-weight industrial gas turbine designed to incorporate size
and weight advantages whilst maintaining the robustness, flexibility and longevity of the
traditional heavy-duty industrial gas turbine. The two-shaft gas turbine has a power output of
37 MW for power generation, or of 38.2 MW for mechanical drive. [37]
Figure 14: The SGT-750 [37]
The turbine was specifically designed for long operation times with extended overhaul
intervals and features easy maintenance. Its main design features are 13-stage axial
compressor, a two stage air cooled compressor turbine and a two-stage counter rotating non-
cooled axial flow power turbine. The combustion chamber (see Figure 15) system consists of
eight tubular combustion chambers. The design has been developed with focus on high
reliability and easy maintenance. Individual combustion chambers can be simply replaced
from the compressor side without disassembling the turbine module. [37]
Figure 15: The 4th
generation DLE burner [38]
The dual fuel option has DLE capability on gas and for liquid fuel operation water injection
can be used to reduce NOx emission. The 4th
generation DLE burner is specifically designed
for extremely low emissions over a wide operation range of the turbine. A compressor
discharge air bleed is also available to further reduce the emissions at very low loads. Further
important improvements over the older DLE burner are optimized aerodynamics and fuel/air
mixing. Expected values for NOx and CO are below 15 ppm. [38]
RPL burner
Pilot burner
Main 1 gas Main 2 gas
Quarl
Convective combustor cooling
27. -12-
This system is thus designed to operate in the lean premixed combustion mode. The
aerodynamics of the burner is designed so that a well-defined recirculation zone is formed and
is bounded by the quarl and aerodynamically anchored at the pilot tip to minimize axial
movement. The burner design features four independently controlled fuel lines for maximum
flexibility, see Figure 15. The burner is based on central stabilization technique which means
that the separate fuel lines feed the centrally located RPL (Rich-Pilot-Lean) burner, the pilot
burner and the two main passages (Main 1 and Main 2). [33]
The RPL burner represents a small pre-combustion chamber that is operated mostly in the fuel
rich regime at slightly higher temperature than the main flame. This small device has two
major purposes:
it plays a role of an ignition burner, like a small torch that ignites the pilot and the main
flames
it supports the main flame and widens the operating window of the main burner
The pilot burner features swirler wings with an internal gas supply. Its location provides that
the hot exhaust gases from the RPL burner are in close contact with oncoming fresh gas/air
mixture. This central stabilization technique gives the possibility to optimize the fuel profiles
of the main stages where the majority of the fuel is injected. [33]
28. -13-
2 Theoretical background
This chapter is intended to present the basic theoretical background used in the CFD
simulations performed within this project. Not are details are given here therefore a more
interested reader is advised to refer to literature that will be pointed out.
2.1 Governing equations in Fluid Mechanics
The set of governing equations used in fluid mechanics is based on conservation laws which
are conservation of mass, momentum and energy. These partial differential equations are also
known as the Navier-Stokes equations as they were derived independently by Claude-Louis
Navier and George Gabriel Stokes in the early nineteenth century. They have no known
general analytical solution but can be discretized and solved numerically. Equations
describing other processes such as combustion or fuel/air mixing can also be solved in
conjunction with the Navier-Stokes equations. [16] Details about derivation of the following
conservation laws can be found in Ansys Documentation [17].
2.1.1 Mass Conversation Equation
The general equation for conservation of mass or known also as the continuity equation can
be written as follows:
∙ 0 (2.1)
The first term describes the rate of change of density in an (infinitesimally small) control
volume and the second term describes the mass flux rate through the surface of the control
volume.
2.1.2 Momentum Conservation Equation
Conservation of momentum in an inertial reference frame can be derived from the Newton’s
second law and combining it with the continuity equation it can be written as:
∙ Π (2.2)
where the substantial derivative is defined as:
∙ 2.3
If we expand the equation (2.2) with help of (2.3) we get:
∙ ∙ 2.4
The first term on the left hand side describes the rate of change of momentum in a control
volume and the second term on the left hand side describes the momentum flux through the
surface of a control volume. The first term on the right hand side represents the body force per
unit volume and the second term on the right hand side describes the surface force per unit
volume applied on a fluid element. It consists of shear and normal stresses and the so called
viscous stress tensor Π for a Newtonian fluid is given by:
2
3
2.5
29. -14-
To get the final form of the momentum equation or the Navier-Stokes equation we combine
the Equations (2.4) and (2.5):
2
3
2.6
2.1.3 Conservation of energy
The conversation of energy equation can be derived by the first law of thermodynamics on an
infinitesimal fixed control volume to yield the equation with being the total energy per unit
volume:
∙ ∙ ∙ ∙ 2.7
The left hand side terms describe the rate of change of total energy in a control volume and
the total energy flux through the boundaries of a control volume respectively. On the right
hand side we have the rate of heat from external sources, heat flux through the boundaries,
work done on a control volume by body and surface forces respectively. The in the second
term can written as
2.8
which is known as Fourier’s law for heat transfer where is thermal conductivity.
2.1.4 Equation of state
To close the equation system formed by Equations (2.1), (2.6) and (2.7) we use the equation
of state. If we consider a compressible flow and disregard external heat addition or body
forces and use Equation (2.1) for the mass conservation equation, the momentum equation
(2.6) separated into three scalar equations and the energy equation (2.7) we have five scalar
equations. They contain, however, seven unknowns , , , , , . The perfect gas equation
of state is valid for gases whose intermolecular forces are negligible:
2.9
where is the specific gas constant. For low temperatures the specific heat capacity at
constant volume is constant therefore the internal energy can be defined as:
2.10
Now we have additional two equations that make seven equations with seven unknowns and
hence a closed system.
2.2 Turbulence
Nearly all flows in the nature and engineering practice are turbulent. Winds and currents in
the atmosphere and ocean or flows past transportation devices (vehicles, aircraft, ships …),
flows through all sorts of engines or in our case flow through the combustion chamber are all
turbulent. Turbulence is an enigmatic state of fluid flow which involves unpredictable
fluctuations that can be both beneficial and problematic. Both can be encountered in a
combustion chamber –turbulence is exploited for mixing of air and fuel but within the same
device it can lead to noise and efficiency losses. A summary of some of the most
characteristic features of turbulent flows would be: [18]
Chaotic fluctuations in space and time
A wide spectrum of scales of swirling flow structures (eddies)
30. -15-
High diffusivity
High Reynolds number
Dissipation of kinetic energy into heat
One of the most important numbers in fluid mechanics, commonly used for description of the
turbulent flow regime, is the non-dimensional Reynolds number which is defined as a ratio
between the inertial and viscous forces:
2.11
Density , characteristic velocity and characteristic length scale represent the inertial
forces while the viscous forces are represented by dynamic viscosity . A high Reynolds
number therefore states the dominance of inertial forces over viscous forces in a turbulent
flow. At high Reynolds number a separation of flow scales occurs. The highly energetic large
scales (integral scales) limited by the geometrical restrictions break up and the energy is then
successively transferred to smaller and smaller eddies in a process known as the energy
cascade. At the final stage the molecular viscosity is effectively dissipating the kinetic energy
of the smallest eddies into heat. [19]
If we consider a turbulent flow not undergoing any rapid changes in the mean flow, the
turbulence can be assumed to be in a state of quasi-equilibrium. That is in the sense that the
dissipation occurring at the smallest scales is in balance with the kinetic energy transfer from
the large scales. This important assumption is a basis for turbulence modeling. [20] [21]
2.3 Turbulence modelling
Turbulent flow is fully governed by the Navier-Stokes equations and can be solved
numerically by Direct Numerical Simulation (DNS). The DNS simulation is three-
dimensional and time dependent but the range of time and length scales are large and increase
rapidly with the Reynolds number. To cover the ranges we need very fine computational
meshes and small time step sizes which lead to extremely high demand of computer
resources. An alternative to solving for all scales exists in form of solving the mean flow
characteristics averaged in time. [20] [21]
2.3.1 Raynolds Averaged Navier-Stokes equations
There are, however, several ways to model turbulent flow but the most widely used and also
used in this work is the Reynolds Averaged Navier Stokes equation approach abbreviated and
known as RANS or Reynolds averaging. It is obtained by splitting the total velocity and
pressure fields into a mean and a fluctuating part. This is called the Reynolds decomposition
and can be written as i.e.: [20] [21]
2.12
and
2.13
where the mean components are denoted by capital letters and the fluctuation parts with a
prime. Inserting the decompositions into continuity and momentum equation and averaging
the whole equations yields Reynolds averaged continuity equation and Reynolds averaged
momentum equation. A similar procedure can be applied to the energy equation where the
total enthalpy can be decomposed into average and fluctuating part. All the derivations can be
found in [21] where the subject of turbulence is well covered. [20] [21]
31. -16-
The mean flow equation is usually referred to as the Reynolds equation. For simplicity a
simpler Reynolds equation which is valid for incompressible flows will be presented here. We
start with the incompressible version of the Navier-Stokes equation:
1
2.14
and after applying the Reynolds decomposition (2.12) we get the mean flow incompressible
Reynolds equation:
1
2.15
We can see that the Equations (2.14) and (2.15) look quite similar where the “turbulence
interaction term” takes a role similar to that of the viscous stress tensor. Hence there is
defined the turbulent stress or so called Reynolds stress tensor as:
2.16
This tensor represents the turbulence closure problem since the continuity (1) and Reynolds
equation (3) make up four equations while after averaging we have ten unknowns. These are
the mean velocity and pressure , i.e. four unknowns and the six Reynolds stress tensor
components. To be able to close the system of equations the Reynolds stress tensor is the
subject of modeling. [20] [21]
2.3.1.1 Eddy viscosity models
Similarly as we can isolate the isotropic part (pressure) of the stress tensor for a Newtonian
fluid we can also isolate isotropic part of the Reynolds stress tensor which is in this case
kinetic energy (per unit mass) of the turbulent fluctuations: [20] [21]
1
2
2.17
with which we can rewrite the Reynolds stress as (for the details about derivation please refer
to Pope [21]):
2
3
2
3
2.18
This expression is often referred to as Bousinesq expression. In analogy with the contribution
from pressure, 2/3 times the kinetic energy of the fluctuations gives an isotropic contribution
to the Reynolds stress. The second part represents the anisotropic part and this is the part that
is primarily described when an eddy viscosity concept is used to model turbulence. The
isotropic part is on the other hand usually included in a modified pressure term. The eddy
viscosity model, directly analogous to the Newtonian fluid stress description, can be written:
[20] [21]
2
3
2.19
or for a simple shear flow
2.20
32. -17-
In the expressions (2.19) and (2.20) the eddy viscosity is a property of the flow while the
molecular viscosity is a property of fluid. The eddy viscosity is not considered constant but
is governed by length scale (Λ) and velocity scale (V): [20] [21]
~ 2.21
In most turbulent flows the momentum mixing is prevailed by large energetic eddies.
Modeling of Reynolds stress tensor with six components in general three-dimensional flow is
so reduced to model the large eddy length and velocity scales. This is a large reduction in
complexity and therefore very suitable for implementation in CFD codes for general flows.
[20] [21]
Eddy viscosity models can be classified into three main groups:
ALGEBRAIC MODELS OR ZERO EQUATION MODELS
In algebraic or zero equation models length and velocity scales are related to the mean flow
velocity field and geometry of the flow via for example velocity gradient or distance to the
wall etc. These models work relatively well for specific cases they are designed for, like
attached boundary layers for example but they are, however, not very general. [20] [21]
ONE EQUATION MODELS
Here one is typically solving the transport equation for kinetic energy, , or the eddy
viscosity, . These models work also well for specific cases like attached boundary layers
and other thin shear flows, but are not well suited for complex flows. A good example is the
Spalart-Allmaras model which solves for eddy viscosity. This model has been used
extensively for aeronautical applications. [20] [21]
TWO EQUATION MODELS
In two equation models two transport equations for two quantities are solved that can be used
for determining length and velocity scales needed to determine eddy viscosity. Most common
quantities are the turbulence kinetic energy ( ), its dissipation rate ( ) and the turbulence
frequency ( ). No additional global information is generally needed thus such models are
referred to as complete. Therefore they are most widely used and they have also been chosen
to employ in this work. [20] [21]
2.3.1.1.1 The standard eddy viscosity model
The turbulence kinetic energy ( ) and its dissipation rate ( ) are computed from the two
model transport equations which are solved together with RANS equations for the mean flow.
The model equations which can be derived from transport equation for turbulent kinetic
energy read
2.22
2.23
where is turbulent kinetic energy production term,
2 and 2.24
33. -18-
For details please refer to Pope [21] or any other good book about modeling turbulence.
However the values , , , , are model coefficients with standard values which are
usually not changed. II is invariant of the mean flow strain rate tensor which reads [20] [21]
2.25
where the mean flow strain rate tensor is
1
2
2.26
2.3.1.1.2 The eddy viscosity model
Other alternatives to the eddy dissipation, , as the length scale determining quantity have
been proposed. One of the advantages of the model is near wall treatment for low
Reynolds number flows. The model does not involve complex nonlinear damping functions
that need to be applied to the model for near wall treatment. Therefore the
turbulence model developed by Wilcox is generally more accurate and robust for such flow
conditions. [16][20]
In most models the turbulence frequency is defined as [20]
2.27
The furthermore assumes that the turbulence viscosity is linked to the turbulence
kinetic energy and dissipation with relation:
2.28
Similarly as in molecular viscosity there is a relation
2.29
The model equations read
2.30
2 2.31
where , , , , and are again model constants with standard values.
A major problem with the standard is turbulence interfaces treatment. An example
would be the boundary layer edge where the use of this model leads to unphysical sensitivity
to free-stream values of kinetic energy and turbulence frequency . In practice this results
for example in over prediction of computed turbulence energy in the stagnation region of an
airfoil and general sensitivity to the conditions in the free stream. There are some different
proposals to correct the problematic behavior, however, the best known and very popular
solution was proposed by Menter. [20] [21]
2.3.1.1.3 The SST model
Menter proposed basically a hybrid model which combines advantages of both models.
is thus used in the free stream and blends with help of a blending function to a
34. -19-
formulation near the wall. In the Menter model, which is known as the Shear Stress Transport
turbulence model, the blending between those two models is achieved by transforming the
model into equations based on and . This leads to introduction of a cross-diffusion
term added to the equation: [20][21]
2 1
1
2.32
Both combined models still fail to properly predict the onset and amount of flow separation
from smooth surfaces where the main reason is that both models do not account for the
transport of the turbulent shear stress. This results in overprediction of turbulent viscosity.
The proper behavior of the transport of shear stress is thus obtained by a limiter function to
the formulation of the turbulent viscosity . [16]
THE SST TURBULENCE MODEL IN ANSYS CFX AND FLUENT
Let us take a look little closer at how the SST model is implemented in Ansys CFX and in
Fluent, but however, more interested reader should refer to Ansys documentation [16] where
all the details are thoroughly explained. Although the basic model formulation is very similar
in both solvers, the implementation of the model differs slightly, which may besides different
discretization approaches contribute to slightly different results. The turbulence model
equations are presented in a slightly different form in the software documentation therefore
they have been rewritten in a new form to be able to more easily compare the equations.
ANSYS CFX
,
2.33
,
2 1
1
2.34
The first right hand side terms in both equations represent effective diffusivities where ,
and , are the turbulent Prantl number for and respectively. The third term on the right
hand side in the Equation (2.33) represents the dissipation of . The second term in the
Equation (2.34) may be already recognized as the cross-diffusion term where F is the first
blending function based on the distance to the nearest surface and on the flow variables. The
second blending function F , similar to F , is included in the formulation for calculation of
turbulent viscosity which restricts the already mentioned limiter function to the wall
boundary layer. Formulations for blending functions are not given here so for details please
refer to Ansys documentation [16]. The third right hand side term in the Equation (2.34)
represents the production of and the fourth term represents dissipation of . [16]
and are additional buoyancy production terms which are turned on in CFX only
when buoyancy is modelled. All coefficients of the new model are in CFX simply a linear
combination of the corresponding coefficients of the underlying models ( and ):
[16]
1 2.35
where the coefficients are listed in the Table 1. [16]
35. -20-
ANSYS FLUENT
,
2.36
,
2 1
1
2.37
The SST turbulence model in Fluent rewritten in a form suitable for comparison seems to be
almost identical to the formulation in CFX. The terms S , S , are user defined source terms
that can among others also be used to model buoyancy turbulence as in CFX. However, note
that the production term is evaluated differently and although most of the model
coefficients are the same, they are treated slightly differently in Fluent. The coefficient can
be for example even dependent on and speed of the sound when compressibility correction
is turned on but in this work has been, however, turned off as this function is not
recommended for general use. The coefficients and are otherwise dependent on ,
, , , and , , , respectively, but are with the standard values of the named
coefficients almost identical to those used in CFX as seen in the Table 1. [16]
Table 1: Model coefficients values [16]
, , , ,
CFX 0.09 0.555 0.075 2 2 0.44 0.0828 1 1.168
Fluent 0.09 0.553 0.075 1.176 2 0.44 0.0828 1 1.168
Blending of the coefficients and is accomplished in the same manner as in CFX, that is
according to the Equation (2.35) while there is noticeable difference in blending of the
coefficients , and , . Fluent uses here nonlinear recipe which can be written as: [16]
1
2.38
On the first sight identical SST turbulence model in both solvers can therefore in practice
contribute to slightly different results when comparing CFX and Fluent calculations.
However, if the coefficients and are manually changed in both solvers so that
, , , 2.39
and
, , , 2.40
then we can obtain a new turbulence model which is theoretically identical in both solvers and
can be valid for comparison between Fluent and CFX results. This statement holds if the
relation (2.28) can be used in the production term in the Equation (2.37) which makes the
model equations identical for both solvers. There is an uncertainty how the production term
is evaluated in Fluent therefore this issue will be addressed to Ansys customer support.
The details about blending functions, production limiters, wall scale and near wall treatment
employed in the Menter SST model can be found in Ansys documentation [16]. This
turbulence model is becoming more and more popular as it can be used for wide variety of
flows especially when dealing with flow separation. It is the Airbus standard turbulence
model and also exclusively used in this thesis work. [20]
36. -21-
2.3.2 Reynolds stress models (RSM)
The eddy viscosity turbulence models rely on the Bussinesq assumption which is a major
simplification. Some of the deficits of these models are the modeling of the production term
where the model production is insensitive to rotation, has incorrect asymptotic behavior for
large shear rates. In the Reynolds stress model the production is exact as it includes the
rotation rate tensor and not only the strain rate tensor as in Equation (2.24). However, as the
Reynolds stress tensor has six independent components we need here six additional partial
differential equations to solve together with a length scale determining property such as the
dissipation rate . Thus we end up with seven additional equations. This approach gives better
results but is computationally expensive and not as robust and easy to implement into CFD
codes as the eddy viscosity models. [20] [21]
2.3.3 Large Eddy Simulation (LES)
There exist many other different turbulent models which are often hybrids between different
formulations but they will not be presented here as they are not associated with this thesis
work. However, it might be interesting to briefly present Large Eddy Simulation approach. As
the name itself suggests it resolves large eddies. It resolves the large scale turbulence and
models only the smallest scales. The smallest scale tend to be more isotropic and more in the
equilibrium than the large scales and are therefore easier to model. As already mentioned
most of the turbulence kinetic energy is contained in the large scales which means that
resolving the smallest scales is not that critical for the complete simulation. LES is still rather
expensive compared to eddy viscosity models but it is being gradually introduced also in the
industry. [20]
2.4 Species transport
In this work we are dealing with air/gas mixing which also needs a certain model to employ.
Most of the calculations in this work are done in Ansys Fluent therefore equations for species
transport employed by Fluent are presented here. The software predicts the local mass fraction
of each species through the solution of convection-diffusion equation for the ith
species
which takes the following form:
∙ ∙ 2.41
In the above equation is the net rate of production of species i by chemical reaction. This
term is applicable when we are dealing with simulation of combustion together with which
is the rate of creation by addition from the dispersed phase plus any eventual user defined
sources. [16]
2.4.1 Mass diffusion in turbulent flows
In case of turbulent flows the mass diffusion term J in the Equation (2.41) is solved by
, , 2.42
In the above equation is the turbulent Schmidt number which is defined as
2.43
where is turbulent viscosity and is turbulent diffusivity. The dimensionless number
describes thus the ratio between the turbulent transport of momentum and the turbulent
37. -22-
transport of mass or eventually any other passive scalar. The Schmidt number may be
adjusted to increase or decrease mixing to compensate for turbulence model errors, however,
in this work the default value of 0.7 has been used. [16]
2.4.2 Species transport in the energy equation
For multicomponent mixing flow the transport of enthalpy due to species diffusion is included
in the energy equation: [16]
∙ 2.44
2.4.3 Equivalence ratio
Solution of the species transport equation is a mass fraction or eventually a molar fraction of a
specific species. However, a very useful parameter in internal combustion engines is fuel to
oxidant equivalence ratio or also reciprocal parameter oxidant to fuel equivalence ratio . In
this work fuel-oxidant equivalence ratio will be used as it is commonly used in gas turbine
industry. It is defined as:
/
/
2.45
This means that when 1 there is an excess of oxidant present in the mixture or the
mixture is “lean” and when 1 there is an excess of fuel or the mixture is “rich”. When
1 then the actual mixture is equal to an ideal or stoichiometric mixture which
theoretically means that the amount of oxidant present in the mixture is just enough to
completely burn all the fuel. [26]
2.5 Numerical methods
There exist different numerical approaches for solving the set of partial differential equations
describing the behaviour of fluid flow like finite differences, finite elements, Boltzmann
method etc. All approaches have certain advantages and disadvantages but, however, for fluid
flow the finite volume method is the most suitable and natural method as it involves directly
the approximation of conservation laws and is robust also in complex geometries. [19]
Most of commercial and in-house CFD codes implement finite volume method although
discretization of the governing equations may differ. In this work was mainly used Ansys
Fluent solver but a brief comparison of results using both Ansys Fluent and CFX was made
therefore in the next section the main differences between those two solvers are also
presented.
2.5.1 Discretization
The governing equations need to be discretized on discrete mesh grid points and evaluated at
discrete times when dealing with time dependent flows. The set of equations can be
practically ordered accordingly to their characteristic behaviour and can thereby be written in
the following form: [19]
2.46
38. -23-
where represents conservative variables, contain convective fluxes, contains viscous
fluxes and are source terms, e.g. gravity. The mentioned flux terms can be written as:
,
3
,
0
2.47
Equation (2.46) represents a differential equation but in order to be able to discretize
governing equation using the fine volume method we have to write it in conservative form or
integral form. Using Gauss divergence theorem we rewrite the Equation (2.46) for each
control volume outlined by surface elements as: [19]
2.48
In the Equation (2.48) is the normalized normal vector on a surface element which we
get after applying the Gauss divergence theorem. For a discretized finite volume the surface
integrals can be transformed into algebraic expressions as discrete sums: [19]
, , , , , 2.49
where index 0 refers to the current control volume and is the total number of bounding
surfaces of the control volume which is six in an example of hexahedral volume element.
Furthermore the index refers to an individual surface of the current control volume. [19]
The flux terms in the governing equations are grouped according to their physical behaviour
as seen in the Equation (2.47) so that different appropriate discretization schemes can be used
for each term category. [19]
2.5.1.1 Cell-centered and vertex-centered Finite Volume Methods
Both cell-centered and cell-vertex discretization are successfully used in finite volume codes
but it is still very difficult to draw a conclusion which one is a better choice for a CFD code
discretized on an unstructured grid. In this work Ansys Fluent represents the first choice and
Ansys CFX the other one. It has been debated for a long time which commercial code is a
better choice but, however, generally speaking Fluent has a reputation that it is more difficult
to achieve satisfactory convergence but when converged it gives slightly better results. Ansys
CFX is on the other hand more forgiving in sense of robustness and efficiency.
Measuring performances using above discretization approaches highly depend on the
computational environments, such as programming languages, operating systems and so on,
therefore it is necessary to assess cell-centered and vertex-centered discretizations in identical
working environments. G. Whang in the article [22] presents an interesting study of
comparing and evaluation of both approaches using the DLR TAU code which offers both
finite volume formulations within its solver. [22]
BASIC DIFFERENCES
The basic difference between the formulations lies in the construction of control volumes. In
the cell-centered (Fluent) approach the control volumes are identical with primarily generated
grid cells as shown on the left side of the Figure 16 where we can see both formulations
applied on the same part of a two-dimensional grid. The unknowns are thus defined at the cell
39. -24-
Figure 18: Median dual control volume
constructed at sharp edge corner [22]
centroids while in the vertex-centered approach solution variables are located at the primal
grid vertices and the control volumes are reformed around each primal grid node. This is
achieved by a median dual mesh construction which connects the centroids of primal cells
with surrounding midpoints of faces and edges. The dual-median grid construction is shown
in the Figure 17.
Figure 16: Illustration of cell-centered (left) and vertex-centered (right) type control volume constructions [23]
The Figure 16 shows only an illustration to show the basic difference between the approaches
as there exist different approaches even within the same vertex-centered discretization
category. The control volume construction shown in the right side of the Figure 16 represents
more precisely a Voronoi volume [24] while Ansys CFX employs the more popular dual
median construction shown in the Figure 17.
Another important difference between the cell-centered
and vertex-centered grid approach relates to the number
of control volumes or degrees of freedom which is
determined by the number of primary grid cells and
vertices for the respective formulation. The ratio between
number of grid cells and vertices varies with grid
topology and so for pure three-dimensional tetrahedral
mesh it is in the range of 5 to 6 while in pure structured
meshes this ratio closes to one. This fact leads to the
argument that the cell-centered scheme should be more
accurate on the same unstructured grid. On the other hand
has a control volume in the cell-centered grid formulation a smaller number of neighbor cell
comparing to a control volume in the vertex-centered grid formulation which can affect
accuracy of the linear reconstruction of gradients as the gradient of a flow variable is
approximated at each control volume center taking into
account the neighboring control volumes.
It is perhaps worth to point out that the construction of
the median dual mesh can produce control volumes of
bad quality. This can happen especially for grids with
large distortions. A typical example is when a prism layer
is generated at some sharp boundary like a trailing edge
of an airfoil (see Figure 18). In this case an arrow-shaped
control volumes will be formed which can greatly
decrease performance of a solver. [22]
For details about differences in flux integration, gradient evaluation and boundary treatment
please refer to G. Wang [22] and/or Ansys documentation [16]. In the next section flux
integration and with respect to the two finite volume methods will be briefly presented.
Figure 17: Dual median grid
construction [24]
40. -25-
FLUX INTEGRATION
One characteristic of the cell-vertex approach is that the edges of the dual mesh always cross
the midpoints of the face connected with two corresponding vertices while in the cell-centered
approach this property generally cannot be achieved. This advantage brings a lot of benefits in
surface flux computing, especially for central discretization. Therefore Ansys CFX uses
central discretization as default spatial discretization. The upwind discretization is on the
other hand better choice for Fluent solver.
a) Vertex-centered b) Cell-centered
Figure 19: Solution reconstruction for vertex-centered and cell-centered formulation in 2D unstructured mesh
[22]
Just in order to briefly present the basic difference between approaches shown in the Figure
19 an example with Roe flux splitting scheme extracted from the article [22] is considered.
The convective flux over the control volume face with edge can be written as:
,
1
2
| | 2.50
If we assume that the solution has piecewise linear reconstruction over the control volume
then the left and right states for vertex-centered formulation can be reconstructed as:
1
2
∙ 2.51
1
2
∙ 2.52
where is the gradient of and is the value of limiter function at vertex , represents
the vector from vertex to vertex as seen in Figure 19. The factor ½ is a result from the
midpoint property of median dual grid. [22]
For cell-centered approach the above formulation should be modified as
∙ 2.53
∙ 2.54
where and represent vectors pointing from cell centers to the barycenter of the control
volume face.
TESTING OF CELL-CENTERED AND VERTEX-CENTERED SCHEME
G.Wang [22] conducted several test cases with three different airfoil designs at different flow
conditions such as low and high Mach number flows. On a turbulent flat plate case he tested
also performance when using structured grid. All comparisons were supported also with
experimental results. His conclusions actually confirmed what has already been said about
Ansys Fluent’s reputation.
41. -26-
G. Wang’s results indicate that the cell-centered scheme and the cell-vertex scheme have
nearly the same accuracy and efficiency for most of the structured grid test cases. This is
expected as the number of degrees of freedom is the same. For the test cases with unstructured
grid in general the cell-centered formulation is less efficient but more accurate compared to
vertex-centered on the same mesh. [22]
2.5.1.2 Spatial discretization
ANSYS CFX
A number of spatial discretisation schemes have been developed either for specific flows or
for more general application. Ansys CFX offers technically only two types of spatial
discretization schemes. These are the 1st
order upwind difference scheme and 2nd
order central
difference scheme. The default option used in CFX is the High Resolution Scheme which
uses a special “recipe” shown in the expression below: [16]
∙ ∆ 2.55
In a discretised equation all the variables are stored at the nodes but several terms are
evaluated on the surface of a control volume or in the integration point denoted as . The
advective term for a quantity is now calculated using a mix of both available discretization
schemes. If is equal to zero then a 1st
order upwind scheme is obtained (which is robust but
by its nature tend to smear out steep gradients and is therefore inaccurate) and for is equal to
1 then the scheme is fully second order accurate but may lead to unphysical oscillations. The
value can be manually chosen but the default High Resolution Scheme uses a special
nonlinear function for at each node computed to be as close to 1 as possible. [16]
ANSYS FLUENT
Fluent has many different spatial discretization schemes to choose from and they are generally
1st
order upwind scheme
Power law scheme
2nd
order upwind scheme
2nd
order central differencing scheme
QUICK scheme
3rd
order MUSCL scheme
Modified HRIC scheme
The central differencing scheme can be, however, used only for LES calculations and offers
similar blending as described by the Equation (2.55). Nevertheless the default scheme which
can be used for accurate calculations of a wide variety of flows and mesh types is 2nd
order
upwind scheme. Blending between 1st
and 2nd
order upwind schemes is also possible for cases
with problematic convergence and at a certain flow conditions when a converged solution to
steady-state is not possible due to local flow fluctuations that can be both physical and
numerical. Blending factor can be chosen manually as Fluent does not offer the “smart”
blending function as described in the previous section. For details about specific numerical
scheme please refer to Ansys documentation [16].
42. -27-
2.5.1.3 Gradient evaluation
Gradients are needed for constructing values of a scalar at the control volume boundaries and
on the other hand for computing secondary diffusion terms and velocity derivatives. Ansys
CFX employs the standard finite element approach to accomplish both with use of shape
functions. Ansys Fluent offers three methods to compute gradients: Green-Gauss Cell-Based,
Green-Gaus Node-Based and Least Squares Cell-Based. The default method which is also
used for all the calculations in this work is the latter choice as it is both accurate and
computationally relatively inexpensive. [16]
2.5.1.4 Temporal discretization
For time dependent simulations the governing equations must be discretized in both space and
time. In this work a steady-state solution was needed but none of the calculations with
intermediate mesh density and more that 1st
order accuracy in space converged to a steady-
state solution due to local transient behaviour which can be either physical or numerical. The
solution was then to run transient calculations with time statistics sampling in order to obtain
a time average of the time dependent converged solution. [16]
Both Ansys CFX and Fluent offer 1st
and 2nd
order accurate implicit backward Euler schemes.
In this work the 1st
order accurate scheme was used since the object of interest was time
averaged solution therefore the typical steep temporal gradients diffusion behaviour has been
taken advantage of. The implicit 1st
order backward Euler scheme can be written as: [16]
2.56
where is a scalar quantity, 1 is value at the next time level, is value at the current
time level and function D incorporates any spatial discretization. The implicit scheme is a
good choice as it is unconditionally stable (does not have a time step size limitation). Fluent
offers also explicit time integration which is available only with the density based solver. [16]
2.5.2 Continuity and momentum equation coupling
Since its initial release the Fluent solver has provided two basic solver algorithms. The first is
density-based coupled solver (DBCS in the Figure 20) which solves all the governing fluid
dynamics equations (continuity, momentum and energy) in a coupled manner. This solver is
applicable when there is a strong coupling or interdependence between density, energy and
species. Examples of such flow are high speed compressible flow with combustion,
hypersonic flow and shock interactions. The second solver is pressure-based segregated solver
that solves the equations in a segregated or uncoupled manner and it has proven to be
successfully applicable to wide range of physical models. However in some applications the
convergence rate is not satisfactory generally due to the need for coupling between the
continuity and momentum equations. Those situations in which equation coupling can be
beneficiary include rotating machinery flows and internal flows in complex geometries. The
third, a new option in Fluent, is pressure-based coupled solver (PBCS) which is a similar
solver as the Ansys CFX solver. This algorithm solves the continuity and momentum
equations in a coupled fashion. This approach removes approximations due to isolating the
equations and permits the dependence of momentum and continuity on each other. This
results in more rapid and stable convergence rate and improved robustness so that errors
associated with initial conditions, nonlinearities in physical models or deformed meshes do
not affect stability of the solution process as much as with segregated algorithms. [16] [25]
A flowchart illustrating the pressure-based and density based solvers is shown in Figure 20.
As seen the segregated solver solves momentum equations for the unknown velocity
43. -28-
components one at a time as scalar equations and after that it solves a separate equation for
continuity and pressure. The pressure solution is here used to correct the velocity components
such that continuity is satisfied. In the case when the flow equations are coupled together, the
coefficients computed for each equation contain dependent variables from the other equations.
[25]
Figure 20: Flowchart illustrating Fluent solver algorithms [25]
In the case of segregated solver these variables are supplied merely by using previously
computed values and this introduces a decoupling error. This error can result in delaying
convergence in cases where strong pressure-velocity coupling exists. As the pressure-based
solver solves continuity and momentum equations in a fully coupled fashion this means that a
single matrix equation is solved and for that it is needed about twice the memory per cell for
the coupled solver. In practice this means that the coupled solver needs slightly more
computer time per iteration but on the other hand it takes less iterations to converge to the
final solution. [25]
Some of the facts about the two types of solvers have been confirmed in this project. In this
work the geometry of the 4th
generation DLE burner is extremely complex and the otherwise
computationally less expensive segregated solver’s performance was inferior to the coupled
solver. All attempted steady state runs were therefore run with coupled solver. However, for
transient cases the performance of the segregated solver was superior to the coupled when
simulating the 4th
generation DLE burner. The reason lies in the fact that the segregated solver
needs less computer time per iteration and that if the initial conditions do not differ
significantly from the final solution then even the segregated solver advances towards
converged solution efficiently. Most of the transient cases in this work were run with around
15 iterations per time step. The coupled solver needed about 1 to 2 more iterations to achieve
convergence criteria but net computer time per time step was about 10 - 15 % lower than
when using the segregated solver. On the other hand, when simulating the 3rd
generation DLE
burner in the ignition stage where there is compressible (choked) flow included, the coupled
solver option was more time effective. Obviously because those flow conditions result in
stronger coupling between pressure and velocity.
44. -29-
2.5.3 Calculation procedures at periodic boundaries
All calculations in this work have been performed with help of cost effective 90° and 30°
sector models instead of employing a full model. All periodic sides that come in pairs have to
be specifically defined as rotationally periodic sides. A CFD solver treats the flow at a
periodic boundary as though the opposing periodic plane (called a shadow zone in Fluent) is a
direct neighbour to the cells adjacent to the first periodic boundary. This means that when
calculating the flow through the periodic boundary adjacent to a fluid cell, the flow conditions
at the fluid cell adjacent to the opposite periodic plane (the shadow zone) are used. Therefore
the periodic sides of cut geometry have to be identical. When generating a computational
mesh for a periodic model a special option in a mesh generation software has to be turned on
which ensures that the nodes will line up along an axi-symmetric model and forces the nodes
to be rotationally periodic with one another. [16]
45. -30-
3 Methodology
In this chapter the basic approach and methodology is briefly presented. All details about
procedures and concepts will be discussed in the next sections.
3.1 Geometry and mesh creation
An established meshing approach for a single SGT-750 burner demands between 40 and 75
million grid cells. Since this represents an extensive effort for the available computer
resources some periodic 90° sector models have also been tested and they gave acceptable
results in modelling both air/fuel mixing and combustion. A 90° sector model of the burner
seems a reasonable choice for a mesh study as solution time is only approximately ¼ of the
solution time needed for a full 360° model while the obtained results should be very close to
the full model, moreover it should be fully valid for a mesh convergence study.
New 90° sector geometry was created where special care was taken to cut the full model so
that all details of the complex geometry were correctly captured. At the same time any
eventual sharp corners in the cut geometry have to be strictly avoided in order to be able to
prevent creating sharp edged grid cells. An example is shown in the Figure 21. It can be seen
that the air casing’s geometry is cut exactly through the middle of the damp holes so that the
angle between a circular outline of an opening and cut line is 90°. This theoretically means
that when meshing with unstructured tetrahedral mesh the angle of a tetrahedral (or a triangle
on a surface mesh) is about 90° depending on the mesh density in that region. On the other
hand if the geometry had been cut like the cutting line b) in the Figure 21 suggests then the
cells in that area would have been sharp cornered.
Figure 21: Cutting the geometry through the air casings damp holes
Those cells are generally of bad quality and can greatly reduce performance of the flow
solver. The new geometry was then firstly the basis for the reference computational mesh
creation. Let us call the reference mesh the “SIT mesh”. The SIT mesh was created according
to established meshing parameters and is considered as a “trustworthy” mesh so that other test
meshes can be compared against it. For all generated meshes in this work the mesh quality
was assessed with a general ICEM CFD quality where the lowest limit was 0.3 which in all
cases resulted in only a few elements having the lowest value. Each generated mesh was
smoothed even further to maximize the number of high quality elements.
Besides 90° sector model of the burner a 30° sector model was also created. The idea was to
test the performance and accuracy of the 30° sector periodic model where additional
assumptions were needed to take in account. This approach would greatly reduce computation
time. However, as even the 90° sector model is still relatively computationally expensive and
since no reliable steady state solution was found, most of the calculations were done using the
30° sector model. The 90° sector model was then used merely as a reference to validate the
30° sector model.
46. -31-
3.2 Models and solution methods
Material used in all simulations in this work was Methane Air Mixture which originally
consists of CH4, O2, N2, CO2, H2O but as no combustion was modeled the last two
components were of course not included in the simulations. Species modeling was performed
by Species Transport equations and density was modeled using the ideal gas assumption.
Throughout the whole thesis work only the SST turbulence model was used.
As already mentioned the pressure based solver option was used for all cases however for
simulating the 3rd
generation DLE burner the coupled solver was more stable and time
effective while for simulating the 4th
generation DLE burner the segregated solver was
slightly more efficient. For all runs the default 2nd
order upwind spatial discretization method
was chosen and 1st
order implicit transient formulation was employed for the time dependent
simulations. 1st
order accuracy was chosen as in this project the point of interest was not
transient behavior but average value and therefore diffusive property of this scheme was taken
advantage of.
3.2.1 Monitoring convergence progress
It is often of engineering interest to obtain steady state RANS solution and so it is also in this
study. Steady state solutions give a good picture of the reality needed in industry and are at
the same time very cost effective therefore a lot of effort was put into attempt to acquire a
steady state solution. However, as already mentioned it is not always possible for some cases
to converge to the final steady state solution due to physical or numerical unsteady behaviour.
This unsteady behaviour results in oscillation of the solution field in the computational
domain during convergence process. Oscillations are often of a local nature therefore a
solution may still be valid in the stable parts of the domain. In fact even the unstable part is
not necessarily incorrect. A legally unconverged solution may be used in some cases as a
“snapshot” which can be treated as one of many possible solutions.
3.2.1.1 Steady state runs
To track the oscillations of velocity and methane mass fraction during convergence process a
number of monitor points were allocated to specific parts of the domain. The idea was to keep
the steady state convergence process until the oscillations statistically stabilize. If the
oscillations are less than the differences of a monitored quantity obtained from computing
using different meshes then the steady state solution may be valid even for mesh convergence
study.
To be able to grasp a trend from the oscillations and thereby to tell if the monitored values
have statistically stabilized the oscillations have to be “smoothed” somehow. There exist
many methods for reducing the effect of variation. In industry and financial calculations an
often used technique is using moving average or sometimes called running average. This
technique reveals more clearly the underlying trend of a variating value. There are also a
number of different types of moving averages, in this work a Modified Moving Average
(MMA) or smoothed running average is used. MMA is technically a special case of
Exponential Moving Average (EMA) written as: [28] [29]
1 ∙ ∙ 3.1
MMA is a type of EMA when the smoothing constant is equal to 1/ therefore after
reordering of the expression (3.1) we get
1
∙ ∙ 1 3.2
47. -32-
where is current moving average value is previous moving average value and
is current original value. On the basis of the equation (3.2) a simple MATLAB script was
written in order to calculate the trends in the oscillations. The code can be found in Appendix.
The Figure 22 shows two examples of MMA application. It shows comparison of velocity
evolution in two different points when running a steady state case with three different meshes.
The three meshes have 0.55, 4.3 and 35 million volume cells respectively (details about this
approach are explained in one of the next sections). The left graph shows the desired situation.
The oscillations are less than the (average) differences in velocity which means that
comparison of the results is possible when taking in account deviation from the mean values.
However, that was not the case for all points in the domain. The graph on the right side of the
Figure 22 shows that in one point the oscillations are larger than the average differences in
velocity.
Figure 22: Normalized velocity in two different monitor points
In this case the steady state solutions could still be useful if the frequency of the oscillations
was the same or with other words if the oscillations were in phase. This way a “snapshot” of
the steady state solution would still be valid for comparison. This was, however, not the case
which is already obvious in the Figure 22.
After many other tests i.e. testing different numerical schemes, changing Courant number,
adjusting under-relaxation factors, even removing part of the geometry which is not of
essential importance for air/fuel mixing simulation (air casing) no stable steady state solution
was found. The last resort was therefore to employ time consuming transient runs with
transient statistics sampling.
3.2.1.2 Transient runs with transient statistics
When sampling statistical data during time dependent simulation one is interested in
arithmetic average of the solution field. Sampling data occur every time step and this gives
rise to an important question: For what amount of physical time should the simulation be run
to collect enough data to sufficiently describe the average values? Established rule of thumb is
that a fluid particle should flow from inlet to the outlet (a so called “flow-through”) of the
domain 5 to 10 times. This can be called a “flow-through” and so we can define a “flow-
through time” which can be estimated simply as [2]
̅ ∙
3.3
where ̅ is average density of a fluid in a domain through which a fluid flows, is the total
mass flow and is total volume of a domain. Another approach to estimate the flow-through
time is to use limits function for streamlines in CFX Post software. Both approaches give
similar results, however, it is worth to mention that some fluid particles may theoretically