SlideShare a Scribd company logo
1 of 61
Download to read offline
The Honourable Céline Hervieux-Payette, P.C.
Senator
Review of Free Trade
Agreements and Trade
Policies of Canada 2006-2015
Prepared by: David E. Hamilton
5/25/2015
A Call for National Action
Abstract:
After 1 year of reviewing Canada’s trade performance in the wake of the
2008 financial crisis and the benefits of the new free trade agreements
signed by Canada since 2006, Senator Hervieux-Payette, Deputy Chair of the
Standing Senate Committee on Banking, Trade and Commerce, had this
study conducted in order to separate fact from fiction.
Canada is experiencing a structural shift in its economy, and the
Conservative government has never known how to deal with these changes.
All it did was sign a record number of free trade agreements. But, in this
new context, experience shows that these new agreements will not create
trade surpluses or jobs on their own.
Canada’s trade challenges require a modern approach and a strategic
overhaul in order ensure that Canadians can succeed in today’s global
environment.
Office of The C. Honourable Hervieux-Payette P.C., Senator 1 Review of FTAs and Trade Policies of Canada 2006 - 2015
Office of The C. Honourable Hervieux-Payette P.C., Senator 2 Review of FTAs and Trade Policies of Canada 2006 - 2015
Contents
Executive Summary .........................................................................................................................................4
1.1 Introduction ..........................................................................................................................................6
1.2 The Global Trade Situation....................................................................................................................6
1.3 Canada’s Trade Performance................................................................................................................8
2.1 No Salvation through Currency...........................................................................................................10
2.2 The Disappearing Act of Canada’s Exporting Companies ...................................................................11
2.3 Dutch Disease or Development ..........................................................................................................13
3.1 Will the New Free Trade Agreements Solve this Problem? ................................................................15
3.1.1 NAFTA and Other Current FTAs ...................................................................................................15
3.1.2 Comprehensive and Economic Trade Agreement (CETA)............................................................18
3.1.3 Trans Pacific Partnership .............................................................................................................21
3.1.4 The Remaining FTAs under Negotiation ......................................................................................23
3.1.5 At Best Necessary but not at all Sufficient...................................................................................24
4.1 The Federal Trade Facilitation Services Performance.........................................................................25
4.1.1 Export Development Canada (EDC).............................................................................................25
4.1.2 EDC’s Super-Natural Jobs Facilitation for 2014 ...........................................................................27
4.1.3 Canadian Commercial Corporation (CCC)....................................................................................28
4.1.4 Business Development Bank of Canada (BDC) ............................................................................29
4.1.5 Trade Commissioner Services (TCS).............................................................................................29
4.2 Trade Performance Score ...................................................................................................................30
5.1 Canada’s Export Network and Provincial Trade Promotion................................................................32
5.1.1 Alberta .........................................................................................................................................33
5.1.2 British Columbia...........................................................................................................................34
5.1.3 Ontario.........................................................................................................................................35
5.1.4 Quebec.........................................................................................................................................36
5.2 Overall Provincial Performance ..........................................................................................................37
6.1 Strategic Analysis and Policy Recommendations................................................................................38
6.2 Better Coordination between Foreign and Domestic Commercial Development ..............................38
6.3 Global Value Chains ............................................................................................................................38
6.4 Strategic Basics for High Service Content Manufacturing...................................................................42
6.4.1 Technology and the Four Corners of High Value Added..............................................................42
6.4.2 Continual Education Policy ..........................................................................................................44
6.5 The German Mittelstand.....................................................................................................................45
6.5.1 The German Trade Network........................................................................................................46
Office of The C. Honourable Hervieux-Payette P.C., Senator 3 Review of FTAs and Trade Policies of Canada 2006 - 2015
6.5.2 Central Innovation Program (CIP)................................................................................................47
6.6 Use of the German 3 Pillars by Competitive Economies.....................................................................49
6.7 Coordination with the Provinces and Federal Government ...............................................................50
6.8 Canada’s Parliament Needs Independent Reviews of Trade Agreements and be Responsible for
Ratifying these Agreements ....................................................................................................................................51
7.1 Conclusion...........................................................................................................................................52
List of Recommendations..............................................................................................................................54
Appendix 1.....................................................................................................................................................55
Government has Actively Misled Parliament and the Canadian Public on CETA Figures .........................55
Announcement Document Tabled Without CETA Text ........................................................................55
No 80 000 New Jobs in the Estimates...................................................................................................55
CETA Pre-Study is Out of Date and Inaccurate .....................................................................................55
The WTO’s Doha Round was Not Implemented in 2014 ......................................................................56
Appendix 2.....................................................................................................................................................58
Office of The C. Honourable Hervieux-Payette P.C., Senator 4 Review of FTAs and Trade Policies of Canada 2006 - 2015
Executive Summary
The current export recovery since the Sub-prime Recession is the worst recovery in Canada’s
modern history but to blame this situation on the recession alone would be a gross oversight. Prior to
the crisis Canada’s exports underperformed due to a changing global environment. Where ever
Canadian goods and services are sold they compete against global production. Global Trade has
witnessed high growth in Emerging Markets. Trade is now an exchange of tasks as opposed to an
exchange of goods and services. Trade is being organized into to networks of production known as
Global Supply Chains. This review catalogues the impacts of these global forces on Canada’s exports. It
assesses if the current policy response will enable Canadians to adapt. It provides seven major policy
recommendations: all public foreign and domestic commercial policies and agencies should be placed
under a single ministry; modern trade analysis methods must be used; best practices in technology
development and continuing education program must be adopted; a new organization representing and
operated by the private sector tasked with export promotion needs to be developed; policies are
needed to create a robust network of innovative medium sized firms; a National Program to coordinate
Provincial and Federal trade activities is needed and should periodically review the Canada’s trade
strategy every 2 years and hold a biannual National Public Forum; and finally the Parliamentary budget
officer should have the mandate and the resources to review all Free Trade Agreements when they are
presented to Parliament.
Growth in Canadian Imports has outpaced growth of Exports for a decade. Canada’s trade with
the United States remains the dominant part of Canada’s export markets but exports to the United
States plateaued starting in 2001. The impact of the dollar’s appreciation has led to fewer exporting
firms; however the recent decline of the dollar due to the drop in energy prices will not produce a full
recovery for manufacturing. Many would blame the decline of manufacturing on the Natural resource
sector, but all G7 economies have experienced the same reduction despite not having a natural resource
boom.
Canada’s response has been to sign an unprecedented number of Free Trade Agreements.
Canada’s experience with its free trade partners reveals that these agreements do not create trade
surpluses; they expand the pre-existing balance. From this experience of expanded pre-existing balances
then the new set of agreements will produce a net larger deficit. The study that analyzed the impact of a
Free Trade Agreement with the European Union (CETA) predicts a deficit; but the data for this study is
11 years out of date and ignores the economic turmoil of the past 6 years. At best Canada’s free trade
agreements are necessary but not sufficient to confront the export slump.
Canada has four Trade Facilitation Agencies currently divided between the Department of
Foreign Affairs, Trade, and Development (DFATD) and the Ministry of Industry (MI). All organizations
have witnessed decreases in their performance. Jobs facilitated by Export Development Canada
programs decreased by 20% between 2011 and 2013; and EDC’s reported figures for 2014 have serious
flaws. The total value of Trade Facilitated by the Canadian Commercial Corporation decreased by 44%.
There is a lack of coordination between these organizations. In the Age of Globalization, the barrier
between domestic and foreign commercial activity is evaporating. Placing all Trade Facilitation Agencies
under the Ministry of Industry would be the first step to ensure that Canadian public commercial policy
is coordinated and designed to operate in a modern context.
Office of The C. Honourable Hervieux-Payette P.C., Senator 5 Review of FTAs and Trade Policies of Canada 2006 - 2015
The four largest Canadian provinces (Alberta, British Columbia, Ontario and Quebec) also
maintain their own trade offices and promotion programs with varying degrees of intensity. All four
provinces have yet to fully surpass the pre-recession highs achieved in exports. Slow growth can be
observed in all four with the exception of Alberta’s energy exports. The provinces’ policies and programs
do overlap with each other and with the efforts of the federal government. Efforts should be made to
better coordinate provincial and federal activities.
The nature of trade has changed, international commerce occurs now in tasks as opposed to
goods and services. Production networks are being organized across countries, as such many products
are now “Made in the World” as opposed to a single country. This new geography requires new trade
analysis and assessment methods. Global Value Chain (GVC) analysis was developed for this very
purpose. Using GVC to analyze Canadian trade has revealed that the nature of Canadian exports has
been permanently altered by the Sub-prime Crisis. Services have emerged as the dominate growth
driver and earner of Canadian exports despite the fact that Manufactured exports make up the majority
of Canadian goods sold internationally. High Service Content Manufactured Goods are the future for
Canadian exports; policies that prioritize Science and Technology and adult education are key to success.
Natural Resources have never been the dominate earner for the Canadian economy, and the
development of this sector will not be as beneficial as believed.
GVC also implies that Canada needs a robust network of Medium sized firms. Medium sized
firms are important because they enable the distribution of the benefits of international trade. Without
such a network, the gains from trade will be rewarded as a privilege of wealth. A good example these
policies and programs would be the German Mittelstand. The Mittelstand policies are meant to ensure
that Germany’s Medium Sized Firms adopt and use the latest technologies and most innovative
processes. Germany has managed to maintain a low level of youth unemployment, a high level of SME
exports, and better distribution of the gains from trade throughout the German population due to the
Mittelstand Policies and Programs.
A crucial component to the German system is that the German foreign office network is run by
German private enterprises. This is achieved by extending the German domestic Chamber of Commerce
network abroad to foreign markets. The result of this system is that the export offices are directly
accountable to their clientele; the network represents the German private sector and works with the
relevant ministry and agency to develop commercial policy, resulting in more flexibility, innovation and a
higher level of international competitiveness. This direct accountability between the clientele of an
export program is absolutely crucial in the rapidly changing global environment. This enables German
businesses to develop appropriate trade strategies as opposed to waiting for the government ministry
or agency to lead the way.
The reason for the slow growth in exports is that the global environment has changed and
Canadian efforts to keep pace with this change have been insufficient. Canada is being outcompeted
and has been pushed out of the low-cost to medium cost end of manufacturing. Canada’s manufacturing
future will be in high service content production. This transition can be achieved by: properly organizing
and coordinating all public commercial services; by having a private sector handle part of the
responsibilities for accessing foreign markets; by perceiving and responding to this environment with
modern methods, techniques and public investments; and by implementing a set of policies and
programs to ensure a robust network of medium sized firms capable of international commerce.
Office of The C. Honourable Hervieux-Payette P.C., Senator 6 Review of FTAs and Trade Policies of Canada 2006 - 2015
1.1 Introduction
“Export Wedge”, were the words spoken by Governor Poloz of the Bank of Canada when
describing Canada’s trade deficit during the Senate Bank, Trade and Commerce Standing Committee
meeting on April 30th
of 2014. Governor Poloz pronounced this problem as serious a matter of public
concern. Since the Sub-prime crisis, Canada’s trade performance has revealed itself to be the worst
export recovery in modern times. The problems do not end with the trade deficit. Productivity growth
has not kept pace and the returns of trade are increasingly delivered as a privilege of wealth. Our largest
trade partner continues to dominate our exports; meanwhile emerging markets are gaining ground
whereas Canadian exports have been unable to get a serious foothold abroad. The number of firms and
jobs being created by trade are suffering. This new reality for Canadian trade is not without
opportunities, however the Federal Government Trade Policy must acknowledge the severity of the
current situation and develop policies and programs that will enable all Canadians to benefit from the
trade agreements signed on their behalf. This study analyzes the federal export promotion services in
the context of the current challenges in order to identify whether or not our trade facilitation structure
is up to the task of ensuring Canadian prosperity in an increasingly globalized world.
Graph 1
OECD Economic Surveys: Canada June 2014
1.2 The Global Trade Situation
Trade has experienced 3 major changes: an increase in the number of participating countries; a
change in the composition of trade; and reorganization into global supply chains. The main drivers of
these developments are technology (particularly transport and communications) and political forces
which have promoted, cushioned or resisted international trade. Trade has also benefitted from the
support of global institutions such as the International Monetary Fund (IMF), the United Nations, the
World Bank and the World Trade Organization (WTO). International Trade now has an institutional
0%
20%
40%
60%
80%
100%
120%
140%
160%
Canada's Export Recoveries
1981/82 recession 1990/92 recession 2008/09 recession
Office of The C. Honourable Hervieux-Payette P.C., Senator 7 Review of FTAs and Trade Policies of Canada 2006 - 2015
framework and a vast network. Trade policy is no longer solely about exporting and importing; it
encompasses all interactions with the growing global economy. Modern Trade Policy must synthesize
domestic needs within a greater global context.
Graph 2
World Bank Data: Merchandise trade (% of GDP)
Developing countries and emerging markets are a significant new force with a world export
share at 47% in 2011. A large part of this activity for these economies is amongst each other, which rose
from 8% of world trade in 1990 to 24% in 2011. In the same period, trade volume between developed
and emerging markets countries has also grown from 33 % to 38%. From 1990 to 2011, the only area to
decline in share of world trade was trade between developed economies, now 36% of global trade.
Intra-regional trade (the same “continent” or area) has traditionally been more pronounced, though its
share in Europe and North America has declined or remained unchanged. Asia has attained the largest
share of Intra-regional Trade in exports.1
North America’s Intra-Regional trade declined to 48% in 2011
from 56% in 2001. The rest of the world has gained significant ground in the NAFTA zone; however the
same cannot be said for North American gains abroad.2
World trade and international investment have been organized into inter-linked channels of
activity, known as Global Supply Chains or Global Value Chains (GVC). Wherever the necessary skills are
available for the right price and quality is where production will be located. This has led to an
international fragmentation of production across networks of countries. Global Value Chains include
both large Multinational Enterprises, who provide coordination, and medium-sized enterprises that
operate as local buyers or suppliers.3
Given that countries share GVC, there is demand to ensure that
regulations, which exist for public safety be “harmonized”. Harmonization is the adoption of global best
practices; there is a danger of “best practices” being defined as the lowest level of regulation, which
runs counter to public safety. Twenty first century trade is a brave new world of challenges and
opportunities.
1
If the EU is counted as a single country.
2
World Trade Organization (WTO), World Trade Report, 2013. Viewed at: http://www.wto.org/english/res_e/publications_e/wtr13_e.htm
3
OECD, UNCTAD, and WTO. Implications of global value chains for trade, investment, development and jobs. Viewed at:
http://www.oecd.org/trade/G20-Global-Value-Chains-2013.pdf
0
20
40
60
Growth in Trade
Middle income OECD members
Office of The C. Honourable Hervieux-Payette P.C., Senator 8 Review of FTAs and Trade Policies of Canada 2006 - 2015
1.3 Canada’s Trade Performance
With new trade agreements to be approved and ratified, Canada’s global network of trade
partners has expanded since the signing of the North American Free Trade Agreement. Access in terms
of reduced tariffs has created new possibilities for the Canadian Private Sector. This new reality can be
seen by the changes within the patterns of Canada’s trade relationships. To date the United States
remains Canada’s largest trading partner for both imports and exports. However the importance of the
American market regarding export growth is diminishing. Likewise the products being traded has
changed in nature: exports of manufactured products have given way to professional services and
natural resources.
Graph 3
World Bank Data: Imports of goods and services; Exports of goods and services
As demonstrated by Graph 3, growth in Canadian exports has been outpaced by growth in
imports for the past decade. Growth of Canadian exports to the emerging markets has outpaced export
growth to developed economies. Canada’s trade with the USA has remained relatively unchanged since
2001; however Canada’s trade with the rest of the world has increased by 80% during the same period.4
China, Brazil, India and Mexico have also demonstrated remarkable increases in trade with Canada, but
only Mexico has a Free Trade Agreement with Canada. Accompanying these trends is the growing
importance of the rest of the globe in Canada’s domestic economy. Facilitated by the WTO multilateral
tariff reductions as well as bilateral treaties, Canada’s trade network has become more global. Canada’s
trade policy now exists within a global network and must be properly formulated to deal with the
dynamics of this environment.
4
The Conference Board of Canada 2012, Walking the Silk Road: Understanding Canada’s Changing Trade Patterns. Viewed at:
http://www.conferenceboard.ca/e-library/abstract.aspx?did=5266
-20
-15
-10
-5
0
5
10
15
20
Growth (%) in Imports and Exports
Imports Exports
Office of The C. Honourable Hervieux-Payette P.C., Senator 9 Review of FTAs and Trade Policies of Canada 2006 - 2015
Emerging markets are now acting as the main driver of the trade trends of Canada, both in
terms of what they are buying from Canada and where they are out-competing Canadians business at
home and abroad. Despite the post crisis growth, Canadian exports have yet to regain their pre-crisis
levels in terms of exports as a percentage of GDP.5
Although the countries of the developed world
remain the largest trading partners of the Canadian economy, trade growth with developing countries
and emerging markets has increased its pace accounting for 20% of total export growth. Emerging
markets represented 13% of exports in 2011 up from 6% in 2001. The greatest change in exports has
been a decline in manufacturing (which excludes natural resources), which accounted for 53% of
Canadian exports in 2001, declining to 33% in 2011, most of this occurred in the automotive sector. This
decline has been offset by gains in the non-renewable resource extraction and other manufacturing
sectors. Although there have been positive signs for professional and other services, services continue to
experience “lackluster” performance relative to Canada’s global peers; services account for almost 80%
of Canada’s GDP.6
5
World Bank Indicators, Exports as a Percentage of GDP. Viewed at: http://data.worldbank.org/indicator/NE.EXP.GNFS.ZS?page=1
6
WTO, Trade Policy Review Canada Report by Secretariat 2011. Viewed at: http://www.wto.org/english/tratop_e/tpr_e/tp346_e.htm
Office of The C. Honourable Hervieux-Payette P.C., Senator 10 Review of FTAs and Trade Policies of Canada 2006 - 2015
2.1 No Salvation through Currency
Although the Canadian dollar has experienced a decline from parity, the currency is not
expected to return to the lows of the 1990s that enabled large trade surpluses.7
The Canadian dollar’s
appreciation over the past 15 years is often cited as the source of pain for Canadian exports. The
implication that a lower dollar would eliminate the trade deficit is correct in theory. However the reality
of such a decline occurring for the Canadian dollar is unlikely. Considering the exchange rate it should be
noted that there are two reasons why the dollar will not return to the levels of 64-62 cents. The two
main reasons for this position is first that the American dollar has devalued against all of its peers. The
second reason is that the Canadian dollar in terms of purchasing power holds a value of approximately
88 cents US at the time of writing (though this figure is likely to change with the price of oil).8
Although
currencies can fluctuate over time the main point is that export policy should not rely on sudden
currency depreciation in order to solve the problem. Other avenues for improving the economy’s
exports must be explored. The real focus should be placed on improving Canada’s Terms of Trade which
is a ratio of the price of exports compared to the price of imports; increases in value demonstrate that
our exports are getting more expensive as compared to imports; and a decrease in terms of trade means
exports are getting cheaper relative to imports. The Terms of Trade is the long-run determinant of a
currency’s value.
Graph 4
World Bank Data: Net barter terms of trade index (2000 = 100)
7
National Bank, Financial Markets, Depreciation of Canadian dollar: Lifeline for some manufacturing industries. Viewed at:
http://www.nbc.ca/bnc/files/bncpdf/en/2/SpecialReport_E_20140204.pdf
8
Senate of Canada, Report of the Standing Senate Committee on Foreign Affairs, The Rising Dollar: Explanation and Economic Impacts (Volume
2). Viewed at: http://www.parl.gc.ca/content/sen/committee/372/fore/rep/rep06nov03-e.htm. At the time of writing
0
20
40
60
80
100
120
140
G7 Terms of Trade
CAN GER FRA UK JPN USA ITA
Office of The C. Honourable Hervieux-Payette P.C., Senator 11 Review of FTAs and Trade Policies of Canada 2006 - 2015
As shown by Graph 4, there was an increase Canada’s Terms of Trade since 2001. This increase
is unique to Canada as compared to the rest of the G7. Sustained increases to Terms of Trade indicate
that the increase in dollar value is not temporary since the exchange rate follows the terms of trade.
Most of the G7 experienced a decline in their Terms of Trade meaning that their exports have become
cheaper relative to imports. One way of interpreting these results is that Canada’s non-energy exports
as compared to the other G7 countries have become less competitive whereas the rest of the G7 have
become more competitive. Another interpretation is that Canadian non-energy exports will need to
switch from competing on price to competing on quality; meaning that exports will have to deliver their
price premium if they are to remain competitive. Regardless there are serious challenges facing non-
energy exports, many of which are manufacturing goods produced by medium sized firms. The fate of
Canada’s energy exports has yet to be decided, though the result will be lower volumes and revenues
from these sectors, resulting in a decline in Canada’s Terms of Trade which will help non-energy exports.
As Graph 4 indicates, the experience of the oil price drop in 2009 demonstrates that a major oil price
decline is not sufficient to match the devaluation that occurred in the other G7 economies. This means a
lower dollar due to the Oil Price Collapse will not result in a massive manufacturing export boom
sufficient to rescue Canadians in the short-run.
2.2 The Disappearing Act of Canada’s Exporting Companies
During the crisis the Canadian Economy underwent tremendous strains. One area that has yet to
fully recover is the number of exporting firms, particularly Mid-sized firms. The number of Mid-sized
exporting firms decreased by 17% between 2006 and 2010 and the evidence indicates that this is not
temporary. Both Export Development Canada (EDC) and the Business Development Bank of Canada
(BDC) conducted studies investigating this decrease and the connection to international trade. Although
the EDC report has since been withdrawn officially due to “data concerns”, other findings from the EDC
have highlighted the same results concerning Canada’s export performance. BDC analyzed how global
competition is transforming the economic environment within Canada.
Office of The C. Honourable Hervieux-Payette P.C., Senator 12 Review of FTAs and Trade Policies of Canada 2006 - 2015
Graph 5
EDC, Canada’s Trade Performance 20129
The results of BDC indicate that Canadian Companies are facing tremendous competition from
foreign markets. Some exporting firms stopped exporting and concentrated their efforts on domestic
pursuits. Many companies identified size as a weakness when facing international competition. Difficulty
adjusting to market changes was also identified as a major obstacle. The perspective is that Canada’s
Mid-sized exporting firms are having difficulty competing and adapting to the new realities of global
competition.10
Regional effects demonstrated that since 2006, 4 out of 5 Regions (BC, Prairies, Quebec
and Atlantic) have managed to reverse the trend and increase the number of medium sized firms. Only
Ontario registered a decrease during the same time period. The largest drop in Medium-sized firms
occurred in the Manufacturing sector. Between the years 2000-2010, manufacturing demonstrated a
constant decline of 51% of companies, during the crisis the process accelerated but the overall trend
was observed for the entire decade.11
Many of the disappearing Mid-sized firms traded with the United
States, whereas companies that have been exporting to emerging markets have in fact grown in
number.12
Canadian firms are operating in a different environment; as such they need to upgrade their
capabilities in order to successfully compete. Therefore it is necessary for the Federal Government to
upgrade its trade facilitation services in order to ensure that Canadian enterprise is capable of
prospering in this new environment.
9
EDC Corporate Research Department, Canada’s Trade Performance 2012. Viewed at: http://www.edc.ca/EN/Knowledge-Centre/Economic-
Analysis-and-Research/Documents/canadian-integrative-trade-performance.pdf
10
BDC, What’s Happened to Canada’s Midsized Firms 2013. Viewed at:
http://www.bdc.ca/EN/Documents/other/BDC_study_mid_sized_firms.pdf
11
BDC, What’s Happened to Canada’s Midsized Firms 2013.
12
CGA 2011, Canada’s Global Trade Agenda: Opportunities for SMEs. Viewed at: http://www.theglobeandmail.com/report-on-business/small-
business/article13936900.ece/BINARY/Canada%E2%80%99s+Global+Trade+Agenda%3A+Opportunities+for+SMEs
34000
36000
38000
40000
42000
44000
46000
2000 2001 2002 2003 2004 2005 2006 2007 2008 2009 2010
Number of Canadian Exporting Firms
Office of The C. Honourable Hervieux-Payette P.C., Senator 13 Review of FTAs and Trade Policies of Canada 2006 - 2015
2.3 Dutch Disease or Development
The Canadian Manufacturing Sector has played a leading role in Canadian exports for decades.
However the decline of the sector is often blamed on the natural resource boom. Comparisons with the
Dutch economy have become a fashionably simple explanation; because the Dutch oil sector replaced
the Dutch manufacturing sector during the 1970s. This is known as Dutch Disease. However, this
explanation neglects the fact that all advanced economies have experienced the same decline. As
demonstrated by Graph 6, all other G7 economies have experienced a decline in manufacturing.
Services have risen to make up the gap in output and employment while the manufacturing output
being kept occurs in high service content products.
Graph 6
World Bank Data: Share Employment in Industry
The recent recession and the commodity boom have been scapegoated for the changes in the
manufacturing sector, but the shift started long before the sub-prime crisis. Unemployment in
manufacturing has been decreasing since 2002. Better opportunities in natural resource sectors
attracted workers within the manufacturing sector. The manufacturing sector was either forced to pay
higher wages or innovate and invest in more technology, further reducing the available jobs in the
sector. However, manufacturing accounts for the largest share of Canada’s exports, but the sector’s
total output is 9% of the Canadian economy.13
Services (both public and private sectors), account for
almost 80%. This dominance of services is true for all advanced economies; however their service
exports outperform that of Canada’s.14
Another outcome of Canada’s natural resource boom would be
13
Economist Intelligence Unit, Canada Country Report June 2014. Viewed at:
http://country.eiu.com/FileHandler.ashx?issue_id=291764413&mode=pdf
14
WTO 2011, Trade Policy Review Canada Report by Secretariat.
0
5
10
15
20
25
30
35
40
45
Manufacturing Share of Employment
FRA GER ITA JPN UK USA
Office of The C. Honourable Hervieux-Payette P.C., Senator 14 Review of FTAs and Trade Policies of Canada 2006 - 2015
its lagging productivity growth.15
Effectively the Canadian economy relied on commodity price increases
and a low dollar to grow as opposed to investing into productivity.
The fact that other advanced economies are experiencing the same decline in manufacturing
suggests that Dutch Disease does not complete the picture. The missing part of the explanation is known
as “structural change”; the process of investing into to technology in order to increase productivity. The
determination of which effect is dominant has yet to be decided for the Canadian case.16
What can be
observed is that similar economies have experienced a reduction in manufacturing not as a result of a
natural resource boom but from emerging markets’ trade and from investments into technology. The
“Dutch Disease effect” is likely to phase out over time since it is being driven by a commodity boom;
however the “structural shift effect” from new technologies and foreign competition will continue. The
situation implies that there is a danger of over investment into natural resources which will not pay off
should the boom end. Likewise a full manufacturing recovery cannot be relied on. The real challenge is
to adapt to the reality where private sector services and high service content manufacturing will be the
main modes of exports for Canada. The question remains of whether or not Canada is up to the task of
adjusting.
15
Bank of Canada 2010, The Virtue of Productivity in a Wicked World. Viewed at: http://www.bankofcanada.ca/2010/03/virtue-productivity-
wicked-world/
16
Iscan 2013, Dalhousie University Department of Economics, Windfall Resource Income, Productivity Growth, and Manufacturing Employment.
Viewed at: http://myweb.dal.ca/tiscan/research/papers/dutch.pdf
Office of The C. Honourable Hervieux-Payette P.C., Senator 15 Review of FTAs and Trade Policies of Canada 2006 - 2015
3.1 Will the New Free Trade Agreements Solve this Problem?
In response to the slow pace of the World Trade Organization (WTO) negotiations, many
dissatisfied countries are signing new bilateral and regional Free Trade Agreements (FTAs). Since the
implementation of North American Free Trade Agreement (NAFTA), Canada now has 11 FTAs with 15
countries at the time of writing.17
The number of countries that will sign FTAs with Canada will exceed
50 over the next decade. Canada will have a vast trade network. This section will be divided into 4 parts;
NAFTA and other current FTAs; Comprehensive and Economic Trade Agreement negotiated with the
European Union (CETA); Trans Pacific Partnership (TPP); and the remaining FTAs under negotiation.18
The question to be answered is whether or not new FTAs will be sufficient to improve Canada’s export
performance.
3.1.1 NAFTA and Other Current FTAs
The North American Free Trade Agreement (NAFTA) was a milestone for the participating
countries, and as an international benchmark. Negotiated in parallel to the Uruguay Round, the legacy
of NAFTA is that it served as a model for many FTAs of many countries and for the multilateral
negotiations that led to the creation of the WTO. By initiating a third generation of trade agreements
this treaty included the regular tariff reductions and the elimination of national treatment (with
exceptions).19
The agreement was the first to incorporate new areas such as market access, rules of
origin, intellectual property rights, and foreign investment.20
Graph 7
17
CETA has yet to be passed through Parliament.
18
CETA being the Comprehensive Economic and Trade Agreement between Canada and Europe; TPP being the Trans-Pacific Partnership of the
Asia-Pacific Region.
19
The “Generations” of free trade agreements are distinguished from each other based on the content of the treaty which has expanded with
every new generation. First generation treaties included industrial products but not agricultural products; second generation treaties included
all the areas covered by the first generations and new areas such as intellectual property and trade in goods and services; the third generation
expands the content further in investment, regulations and further developed intellectual property rules
20
Congressional Research Service 2014, NAFTA at 20: Overview and Trade Effects. Viewed at: http://fas.org/sgp/crs/row/R42965.pdf
0
50
100
150
200
250
300
350
400
Trade with the United States in Billions CAD
Exports Imports
Office of The C. Honourable Hervieux-Payette P.C., Senator 16 Review of FTAs and Trade Policies of Canada 2006 - 2015
Data Source: Industry Canada21
The United States remains Canada’s largest trade partner. The bilateral relationship
demonstrates that both imports and exports plateaued around the year 2000, prior to that the effects of
NAFTA grew both imports and exports. Prior to the treaty Canada was running a surplus with the United
States and that the surplus grew until 2000. Since the Sub-prime crisis, imports from the US have begun
to set new all-time highs, whereas Canada’s exports to the United States have yet to recover to the pre-
crisis level. At the moment the surplus seems to be narrowing, whether or not it will become a deficit
would require an in-depth analysis. Focus should be placed on the export plateau which coincides with
the start of the Canadian Manufacturing decline. It seems that the trade growth potential delivered by
NAFTA may be exhausted due to structural change. As such export growth to the US will be dependent
on the value of the Canadian dollar, terms of trade, the growth of the US economy, and the
competitiveness of Canadian goods and services. Without improvements on these fronts, the 1990s
style export expansion with the US will not repeat itself.
Graph 8
Data Source: Industry Canada22
Observing Canada’s trade with Mexico, imports from Mexico were greatly facilitated by NAFTA.
Exports also demonstrated an increase over the past 20 years with the ratio of imports to exports within
the range of 4-5 times exports (meaning for every 1 dollar of exports there were 4 to 5 dollars of
imports). Once again the balance of trade, a deficit, did not change with the treaty. Imports have
continued to grow, whereas exports have plateaued post-crisis. The NAFTA treaty did increase Canada’s
exports and imports to both countries, however the treaty did not create surpluses or deficits. Instead it
magnified both the pre-existing surplus with the United States and the deficit with Mexico.
21
Industry Canada, Online Trade Data. Viewed at: https://www.ic.gc.ca/app/scr/tdst/tdo/crtr.html?&productType=HS6&lang=eng
22
Industry Canada, Online Trade Data.
0
5
10
15
20
25
30
Trade with Mexico in Billions CAD
Exports Imports
Office of The C. Honourable Hervieux-Payette P.C., Senator 17 Review of FTAs and Trade Policies of Canada 2006 - 2015
Graph 9
Data Source: Industry Canada
Table 1
Country FTA Year 2013
Balance
2013
Imports/
Exports
Balance
Before
FTA
FTA
Balance
Change
New
Balance
Post FTA
Mexico 1993 Deficit 4.96 Deficit No -
USA 1993 Surplus 0.69 Surplus No -
Chile 1997 Deficit 2.19 Surplus Yes Deficit
Israel 1997 Deficit 2.78 Deficit No -
Costa Rica 2002 Deficit 5.14 Deficit No -
Iceland 2008 Deficit 1.00 Balanced Yes Deficit
Norway 2008 Deficit 1.83 Deficit No -
Switzerland 2008 Deficit 2.26 Deficit No -
Peru 2009 Deficit 5.07 Deficit No -
Colombia 2011 Surplus 0.97 Balanced No -
Jordan 2012 Surplus 0.68 Surplus No -
Panama 2013 Surplus 0.77 Balanced No -
Korea 2014 Deficit 2.10 Deficit - -
No Data Available for Liechtenstein (FTA in 2008) ; Data Source: Industry Canada
0
1000
2000
3000
4000
5000
6000
7000
8000
MillionssCAD
Trade with Non-Nafta Current FTAs
Iceland Exports
Iceland Imports
Israel Exports
Israel Imports
Chile Exports
Chile Imports
Norway Exports
Norway Imports
Switzerland Exports
Switzerland Imports
Peru Exports
Peru Imports
Korea Exports
Korea Imports
Costa Rica Exports
Costa Rica Imports
Jordan Exports
Jordan Imports
Office of The C. Honourable Hervieux-Payette P.C., Senator 18 Review of FTAs and Trade Policies of Canada 2006 - 2015
In order to properly profile the trade balances, a third category of “Balanced” was given to the
trade relationships that constantly switch between surplus and deficit. As seen in table 1, countries
displaying a Balanced relationship were Colombia, Iceland, Panama and Peru. It should be noted that for
the remaining countries, the implementation of a free trade agreement did not change the balance of
trade, meaning deficits remained deficits and surpluses remained surpluses. The two exceptions to this
rule was Chile were the pre-existing surplus became a deficit with current import to export ratio of 2.19.
The Balanced relationship with Iceland developed into a deficit. Although Colombia (FTA in 2011) and
Peru (FTA in 2009) do operate currently at a surplus, the long-term relationship of these bilateral trade
flows remains Balanced and unchanged.
Graph 10
Data Source: Industry Canada23
From examining Canada’s remaining free trade agreements, observations revealed important
key facts which are as follows. FTAs do increase both imports and exports. FTAs are not to be solely
relied upon to boost exports over imports. FTAs do not reverse the balance of trade; deficits remain
deficits and surpluses remain surpluses. The existence of a surplus or deficit is not dependent on an FTA
but is dependent on structural issues both inside Canada and the partner country. Export growth is
enabled by FTAs but the growth needed to push exports beyond the post-crisis slump and pre-crisis
highs requires other policies, programs and changes within the Canadian economy. At present, export
growth is more dependent on structural issues than trade diplomacy.
3.1.2 Comprehensive and Economic Trade Agreement (CETA)
Just as NAFTA ushered in a 3rd
generation of FTAs, CETA is on track to be the first of a 4th
generation. Going beyond the depth of NAFTA, CETA will include measures to harmonize regulations and
23
Industry Canada, Online Trade Data.
0
100
200
300
400
500
600
700
800
900
MillionsofCAD
Balanced FTA Examples
Colombia Exports Colombia Imports
Panama Exports Panama Imports
Office of The C. Honourable Hervieux-Payette P.C., Senator 19 Review of FTAs and Trade Policies of Canada 2006 - 2015
a strict Investment Settlement Dispute System whereby foreign corporations will have the right to take
legal action all signatory governments in the companies believe they have been unfairly treated. There
are advocates for and against the agreement, however the concern here is the likely impact on exports.
Graph 11
Other Countries: Belgium; Netherlands; Latvia; Malta; Cyprus; Estonia; Greece; Luxembourg; Croatia; Bulgaria; Lithuania; Slovenia; Portugal;
Romania; Slovakia; Hungary; Czech Republic; Spain; Denmark; Poland; Finland; Ireland; Austria; Sweden. Data Source: Industry Canada24
Canada and the United Kingdom have established a more liberalized trade relationship which is
demonstrated in the UK enjoying the “lion’s share” of the EU’s trade with Canada. Likewise the UK is the
only major EU economy with which Canada enjoys a surplus. Canada’s trade balances with the
remaining major EU economies are all deficits. Germany in particular demonstrates considerable
growth in trade deficits with an import to export ratio that consistently grew from 1.5 in 1993 to 4.4 in
2013. The EU includes another 24 economies of which the majority and overall Canadian trade balances
operate at a deficit. Of the 24 only five registered a surplus in 2013. Four of those countries have
displayed long term surpluses: Belgium; Cyprus; the Netherlands; and Latvia. The remaining country
(Malta) registered a Balanced trade relationship over the past decades. Regardless, Canada has
consistently registered a trade deficit with the EU for the past two decades. Since 2011 exports have
decreased however imports to the EU have increased.
24
Industry Canada, Online Trade Data.
0
2
4
6
8
10
12
14
16
18
20
BillionsofCAD
Trade With the Major CETA Economies
UK Exports
UK Imports
France Exports
France Imports
Italy Exports
Italy Imports
Germany Exports
Germany Imports
Other Exports
Other Imports
Office of The C. Honourable Hervieux-Payette P.C., Senator 20 Review of FTAs and Trade Policies of Canada 2006 - 2015
Graph 12
Data Source: Industry Canada25
In 2008, Canada and the EU published an in-depth preliminary study (CETA Pre-Study) of the
benefits of a free trade agreement. It is this same document that advocates use to justify CETA. The
CETA Pre-Study identified that Canada’s trade balance with Europe would be an enlarged deficit after
the implementation of CETA.26
Given that all previous FTAs with a pre-existing deficit only increased the
size of the deficit, it would seem that the CETA pre-study’s estimates are on par with previous
experiences. It must be noted that data used to analyze the benefits of the treaty was from 2004 and
earlier. Counting from 2004 the results obtained from the CETA Pre-Study are 11 years out of date. 27
The CETA Pre-Study by virtue of having pre-crisis data ignores: the subprime crisis; the euro
crisis; the appreciation of the Canadian dollar; and the structural decline of Canadian manufacturing.
The structural change in manufacturing is important because it was in the manufacturing sector that
Canada was predicted to experience increases to exports. However, being that the change is structural;
the export predictions of the CETA pre-study are likely to have been over estimated. Likewise the
estimates for CETA are over-optimistic due to the fact that the CETA Pre-Study assumes that the Doha
Multilateral Negotiations of the WTO would be completed in 2014.28
The impact of such an assumption
would have permeated into the Canadian-European trade relationship, boosting the results for GDP
growth, export gains, employment, etc.; these negotiations are ongoing and have no clear conclusion
25
Industry Canada, Online Trade Data.
26
European Commission, Assessing the Costs and Benefits of a Closer EU-Canada Economic Partnership. Viewed at:
http://trade.ec.europa.eu/doclib/docs/2008/october/tradoc_141032.pdf
27
The CETA Pre-Study used the Global Trade Analysis Project (GTAP) 7 Model’s database; at the time the pre-study was published the most
recent data used by GTAP 7 was from 2004. Viewed at : https://www.gtap.agecon.purdue.edu/databases/v7/default.asp
28
European Parliamentary Research Service Ex-Ante Impact Assessment Unit, Detailed Appraisal by the EP Ex-ante Impact Assessment Unit of
the European Commission’s Impact Assessment EU-US Transatlantic Trade and Investment Partnership. Viewed at:
http://www.europarl.europa.eu/RegData/etudes/etudes/join/2014/528798/IPOL-JOIN_ET(2014)528798_EN.pdf
0
10
20
30
40
50
60
Trade With the EU in Billions CAD
Exports Imports
Office of The C. Honourable Hervieux-Payette P.C., Senator 21 Review of FTAs and Trade Policies of Canada 2006 - 2015
date. Finally the often reported 80 000 new jobs was not a finding of the CETA Pre-Study. The only
source substantiating the 80 000 jobs found by this review is the testimony of the Minister of Trade
during the House Standing Committee on International Trade meeting in 2012 and its subsequent
report.29
To date this review has been unable to find any documentation to verify the claim of 80 000
new jobs. Therefore CETA Pre-Study should not at all be used for the assessment of CETA (See Appendix
1 for the full analysis).
3.1.3 Trans Pacific Partnership
The Trans-Pacific Partnership (TPP) encompasses 12 countries throughout the Asia-Pacific
region.30
Upon completion, TPP will provide new market access for goods and services, enforceable
labour standards and environmental commitments, rules on state-owned enterprises, and an
intellectual property rights framework. TPP will include transparency commitments for regulations
which will enable small and medium-sized businesses to benefit.31
Since Canada’s trade relationship
with Chile, Mexico, Peru and the United States were previously examined; this section will focus only on
the TPP countries that do not have an FTA with Canada.
Graph 13
Data Source: Industry Canada32
Japan’s economy has suffered the diagnosis of “The Lost Decade” for almost 20 years. Inflation
and economic growth have been low over this period of time.33
The policies of the new Japanese Prime
29
Parliament of Canada Report of the House Standing Committee on International Trade, Negotiations Toward a Comprehensive Economic and
Trade Agreement (CETA)Between Canada And The European Union. Viewed at:
http://www.parl.gc.ca/content/hoc/Committee/411/CIIT/Reports/RP5431905/CIITrp01/ciitrp01-e.pdf
30
TPP nations are Australia, Brunei Darussalam, Canada, Chile, Japan, Malaysia, Mexico, New Zealand, Peru, Singapore, Vietnam, and the
United States.
31
USTR TPP. Viewed at: http://www.ustr.gov/tpp
32
Industry Canada, Online Trade Data.
0
2
4
6
8
10
12
14
16
18
Trade With Japan in Billions CAD
Exports Imports
Office of The C. Honourable Hervieux-Payette P.C., Senator 22 Review of FTAs and Trade Policies of Canada 2006 - 2015
Minister Abe have yet to demonstrate their long–term benefits. With the signing of an FTA between
South Korea and Canada, Japan recently announced an interest in an FTA with Canada. As demonstrated
by Canada’s Exports and Imports to Japan over the past 20 years; the impact of the Multilateral
Liberalization from the Uruguay Round (1994) facilitated Japanese expansion into the Canadian market
(Graph 13). Canadian exports to Japan deteriorated after 1995 and have yet to recover to the high set in
the early 1990s. Japanese exports to Canada deteriorated in the wake of the Dot-com Bubble of 2001
and after the Sub-prime crisis of 2008 after which they partially recovered. However the Japanese
exports to Canada never fell below the 1995 level. Given the past experience of FTAs maintaining the
pre-existing deficit or surplus, the trade balance with Japan will likely remain a deficit with TPP.
Graph 14
Data Source: Industry Canada34
With the exception of Brunei Darussalam, Canada operated at trade deficit with all remaining
TPP countries in 2013. Before 2011, Canada did enjoy a trade surplus with Australia, and Canada’s trade
relationship with New Zealand is relatively balanced. Canada has large deficits with Malaysia, Vietnam
and Singapore; though the trade gap with Singapore has been narrowing over time. In aggregate,
33
UK House of Commons Library, Japan’s economy: from the “lost decade” to Abenomics. Viewed at: www.parliament.uk/briefing-
papers/SN06629.pdf
34
Industry Canada, Online Trade Data.
0
0.5
1
1.5
2
2.5
3
3.5
BillionsofCAD
Trade With TPP Countries Without FTAs
Brunei Darussalam Exports
Brunei Darussalam Imports
New Zealand Exports
New Zealand Imports
Australia Exports
Australia Imports
Singapore Exports
Singapore Imports
Malaysia Exports
Malaysia Imports
Vietnam Exports
Vietnam Imports
Office of The C. Honourable Hervieux-Payette P.C., Senator 23 Review of FTAs and Trade Policies of Canada 2006 - 2015
Canada has operated at a continuous and uninterrupted trade deficit with these TPP nations for over 2
decades with an import to export ratio of 1.82 for 2013.
Graph 15
Data Source: Industry Canada35
3.1.4 The Remaining FTAs under Negotiation
With the exception of the Ukraine, Canada’s remaining potential FTA partners are all within the
region of the Americas: The Dominican Republic; Guatemala; Honduras; and Nicaragua.36
Although the
trade relationship with the countries on a whole remained at a stable deficit with an import to export
ratio around 1.5; since the Sub-prime Recession, Canada’s imports from these countries has grown. The
same growth was not repeated in Canada’s exports to these countries (Graph 16).
Graph 16
35
Industry Canada, Online Trade Data.
36
Since the time of writing, the Honduras FTA has been ratified.
0
1
2
3
TPP Import/Export Ratio
With Japan Without Japan
0
1
1
2
2
3
Trade with Other Pending FTAs in Billions of CAD
Total Exports Total Imports
Office of The C. Honourable Hervieux-Payette P.C., Senator 24 Review of FTAs and Trade Policies of Canada 2006 - 2015
Data Source: Industry Canada37
Trade negotiations with the Ukraine were recently announced, which is the only remaining
country where Canada registered a trade surplus in 2013. In the same year Canada had deficits with the
remaining countries. As demonstrated in Graph 17, the ratio of imports to exports was stable until 2008.
Post-2008 the import to export ratio increased dramatically. As such it would seem that these
economies have become more competitive in the wake of the Subprime Crisis. Using past FTA
experience, and the increasing deficit, it can be assumed that FTAs with these countries will not yield
surpluses.
Graph 17
Data Source: Industry Canada38
3.1.5 At Best Necessary but not at all Sufficient
Drawing from Canada’s previous experience, FTAs do not reverse trade deficits into surpluses.
Export growth is enabled by FTAs but not to the level necessary to correct Canada’s current slump in
export growth which is a structural problem. As demonstrated above Canada’s import to export ratios
with the various countries or regions considered for FTAs either have increased (meaning more imports
than exports) or have remained relatively constant. The observation of a falling import to export ratio
would be the proof needed to conclude that new FTAs will solve the export slump. This has been
observed with some countries in the EU but the EU as a whole displays a relatively constant Import to
Export ratio between 1.4 and 2.1. As such export growth is more of an internal problem than an FTA
market access issue. The evidence from Canada’s current and future FTAs indicates that FTAs are at best
necessary but not sufficient to reverse the export slump. The real issue is within Canada’s internal
capacity to compete globally independent of FTA access to foreign markets. It should be noted that
Canada registers large surpluses only with English speaking countries (United Kingdom; the United
States; and for a while Australia), as such part of the problem might be that Canadian businesses are not
comfortable selling to non-Anglo cultures.
37
Industry Canada, Online Trade Data.
38
Industry Canada, Online Trade Data.
0
2
4
6
Other FTA Import/Export Ratio
Import/Export
Office of The C. Honourable Hervieux-Payette P.C., Senator 25 Review of FTAs and Trade Policies of Canada 2006 - 2015
4.1 The Federal Trade Facilitation Services Performance
Canada has embarked on a tremendous market access program by announcing new Free trade
agreements, Foreign Investment Protection Agreements (FIPA) and other such trade related treaties;
attention needs to be turned towards the current trade facilitation policies. Canada has extensive trade
agencies which span many organizations with specific mandates to facilitate trade, and domestic
economy oriented organizations that have begun to provide trade services as well. There is significant
amount of overlap between the organizations. Although a more extensive analysis should be conducted
organization by organization, an analysis of the trade facilitation framework should provide valuable
insights into policy strengths, shortcomings and possible solutions.
Table 2
Services Offered EDC CCC BDC TCS
Start up Financing Yes
Export Financing Yes Yes
Foreign Market Analysis Yes Yes Yes
Foreign Contact Services Yes Yes Yes
Political Relationships Yes
Government Procurement Yes
4.1.1 Export Development Canada (EDC)
EDC operates under the Minister of International Trade with a broad mandate to support and
develop Canada's exports, capacity to engage in trade and ability to capitalize on international
opportunities. This mandate requires EDC to work closely with the Trade Commissioner Service (TCS) in
areas such as training programs, market research and developing overseas opportunities. EDC acts as a
complement to the activities of financial institutions, by providing tailored financing to mature
businesses; the organization is financially self-sustaining, operates on commercial principles, and
charges interest on its loans and premiums on its insurance products.39
EDC's trade finance and risk
services are intended to address gaps where the private sector is unable to meet the needs of Canadian
businesses. Service eligibility is conditional on the transaction's potential benefits. EDC may borrow
from the commercial market by means of a government guarantee or from the Consolidated Revenue
Fund by submitting a request to the Minister of Finance. In the event of a transaction exceeding EDC’s
risk appetite; it can be administered through the Canada Account on behalf of the Federal Government
if the Minister of International Trade considers the transaction to be national interest.
39
WTO, Trade Policy Review Report by Secretariat 2011.
Office of The C. Honourable Hervieux-Payette P.C., Senator 26 Review of FTAs and Trade Policies of Canada 2006 - 2015
Table 3
EDC Canadian Benefits Scorecard
Year 2009 2010 2011 2012 2013 2014
Business Facilitated ($B) 82.8 84.6 102.8 87.4 95.4 98.9
Exports Facilitated (%) 20.6 19 19 NR NR NR
SMEs Served 6886 6628 5872 5807 5517 6088
Business in Emerging
Markets ($B)
18.7 24.7 31.2 26.52 $27.30* 28.9
Share of Total Business
Facilitated
22.58% 29.20% 30.35% 30.34% 28.62% 29.22%
Contribution to GDP ($B) 61 63.4 70.5 52.7 61.9 68
Contributions to GDP (%) 5% 4.9% 5.1% 2.9 4% 3.85%
Jobs Supported 642,465 627,704 707,287 573,773 568,799 719,200
Share of National
Employment (%)
3.80 3.70 4.10 3.27 3.20 4.03
NR - Not Reported, Numbers in bold have been derived from Statscan and EDC data.
*Customers’ business in emerging markets figure
Data taken from EDC annual reports 2012 and 2013 and the EDC Corporate Plan 2013-2017
Numbers appearing in red font display significant flaws.
As shown in the Table 3, Employment facilitated by EDC decreased by approximately 140 000
jobs from 2011 to 2013, a 20% decline. For every observation in 2013; all categories were below their
2011 level. Only Total Business Facilitated, Business in Emerging Markets and Contributions to GDP have
demonstrated a reversal yet they remain below the 2011 level. The number of SMEs has decreased in
line with the trend identified by EDC of fewer exporting SMEs in the economy. The decline in emerging
markets indicates that EDC facilitation is increasing its reliance on advanced economies such as the
United States. There is a cause for concern regarding Canada’s ability to use trade facilitation to tap into
growth in emerging markets. EDC did successfully meet its self-established objectives for 2013.
However, EDC has been unable to reverse the impact of the global forces with regards to the economic
benefits of EDC’s operations.
In 2013, EDC supported over 7000 companies, between 15-18% of the total population of
exporting firms.40
The organization also highlighted the fact that 77% percent of these companies were
SMEs. These SMEs exported $ 11.6 Billion; accounting for 12% of total business facilitated by EDC. This
means that large corporations (a minority of 23% of companies’ facilitated by EDC) accounted for 78% of
EDC’s total business facilitated in 2013. EDC claims to have increased the amount of facilitation to
emerging markets by 8%; however the total value of business facilitated in emerging markets was
reported at $ 528 million. This differs from the previously reported $ 31.2 billion for Business in
40
Data on the number of firms has been pulled by Statscan. The ten year high of the population was set in 2006 at 44 823 companies; the ten
year low occurred in 2010 at 38 456 companies.
Office of The C. Honourable Hervieux-Payette P.C., Senator 27 Review of FTAs and Trade Policies of Canada 2006 - 2015
Emerging Markets in 2011.41
In 2012, the definition of Business in Emerging Markets was changed to
Accounting Revenue. EDC did report in 2013 that “customers’ business in emerging markets reached
$27.3 billion in exports and investments” and it also reported a decrease of 15% in 2012. Using these
figures an increase of only 2.94% can be estimated, 5% below the claimed 8%; the only way EDC may
have arrived at an 8% figure is by using the revenue for Emerging Market services for both 2012 and
2013, however it should have provided both figures in the 2013 Annual Report.
When measured against revenue, Business in Emerging Markets accounts for roughly 41% of
EDC’s Total financing and investment revenue of 1.275 Billion. It seems counter intuitive to continue the
use of Value of Business Conducted by EDC customers for the total measure given the possibility that
some degree of the activity would have occurred without EDC support; the other trade facilitation
organizations may have also played a role, as such there is a degree of double counting. Reporting these
figures undermines the public’s ability to assess the benefits and the success of these activities making
the process of reporting and monitoring pointless. Emerging Market Revenue should be stated as such
in order to avoid confusion. These statistics provide more of an insight into the current challenges being
faced by Canadian companies than EDC’s performance.
4.1.2 EDC’s Super-Natural Jobs Facilitation for 2014
A few weeks prior to the publishing date of this review, EDC released its annual report for 2014.
The EDC 2014 Annual Report provided the 2014 economic performance indicators. With the exception
of two performance indicators, the results proved that EDC is still struggling to reclaim much of its
success in previous years. The statistic that this review takes issue with is the Jobs Facilitated (which was
renamed “Helped Sustain”) result of 719 200; which was an annual increase of 26%. No other
performance indicator grew so much. EDC could make the argument that the 10% increase to SMEs was
responsible; however if this was the case then EDC’s GDP impact should have grown as well.
Table 4
EDC Results 2013 2014 Change
Percentage
of GDP
Facilitated
4.00% 3.85% Decrease
Percentage
of Jobs
Facilitated
3.20% 4.03% Increase
Data Source: EDC Annual Reports 2013 and 2014
Having EDC’s GDP and Labour facilitation move in opposite directions is impossible given the
current economic situation. According the Labour Force Survey, Canada added only 121 000 jobs in
2014, meaning the increase to EDC’s Job indicator is 124% of the Canada’s total job growth in 2014.42
41
EDC 2013, EDC 2013-3017 Corporate Plan. Viewed at: https://www.edc.ca/EN/About-Us/Corporate-Reports/Documents/corp-plan-summ-
2013-2017.pdf
42
EDC, Annual Report 2014. Viewed at: http://www19.edc.ca/publications/2015/2014ar/en/15.shtml
Office of The C. Honourable Hervieux-Payette P.C., Senator 28 Review of FTAs and Trade Policies of Canada 2006 - 2015
Further analysis and scrutiny of these numbers must be undertaken. Until such a time that an
appropriate explanation is provided, the 2014 Economic Performance Indicators of EDC should not be
used for purposes of policy decisions.
4.1.3 Canadian Commercial Corporation (CCC)
Canadian Commercial Corporation’s (CCC) mission is to provide Canadian exporters access to
foreign public-sector markets by means of government-to-government contracting and procurement
processes supported by measures such as performance guarantees. CCC also facilitates Canadian sales
to overseas private-sector buyers. CCC's activities are funded by a mix of parliamentary appropriations
and service fees. CCC’s core business line was the Canada-U.S. Defence Production Sharing
Arrangement (DPSA). By providing government-backed guarantees for contract performance, the need
for equivalent instruments from financial institutions is eliminated. CCC can assume part of the accounts
receivable risk by serving as an intermediary.
Table 5
CCC Performance Indicators
Year 2010-11 2011-12 2012-13 2012-13
Targets
Value of contracts signed
($M)43
1600 1800 1000 1500
DPSA business line ($M) 1400 1500 577 1200
GDS business line ($M) 70 32.7 138.4 102.4
ICB business line ($M) 10 169.3 169 167.6
Cuba Contracting ($M) 48.3 68.4 39 60
Procurement services ($M) 28.3 8.2 17.2 30
Fees for services ($M) 12.9 12.7 15.2 14.3
Number of Canadian Exporters
with contracts via CCC ($M)
12.9 218 210 200
Number of countries with
contracts and/or pursuits ($M)
68 54 72 60
Contract remediation ($M) -1 0.052 0 0.1
Data taken from CCC Annual Report 2013
As shown in Table 5, the value of contracts signed decreased by 37.5% for 2010 to 2013
contracts were 33% below target in 2011. Much of this decline can be explained by changes in the
foreign public sector. As stated above, the DPSA was the core component of CCC’s business but the
budget cutbacks in the United States has resulted in fewer contracts and increased competition from
American firms. In response CCC has begun to diversify its efforts away from the United States. The
reality of this is that the organizations that depended on these contracts will have to adapt to markets
43
Defence Production Sharing Agreement (DPSA; Global Defence and Security (GDS); and International Commercial Business (ICB).
Office of The C. Honourable Hervieux-Payette P.C., Senator 29 Review of FTAs and Trade Policies of Canada 2006 - 2015
that do not share the same cultural and economic similarities of the United States. International
Commercial Business has demonstrated tremendous growth, though not enough to offset the losses.
Although CCC has openly acknowledged the situation, greater cohesion with the other trade services
providers will be needed for Canadian Businesses to continue to secure government procurement
contracts abroad.44
4.1.4 Business Development Bank of Canada (BDC)
The Business Development Bank of Canada (BDC) also supports Canadian firms that wish to
expand globally within its general mandate of business development. At end 2010 it had 5,600 clients
that generated Can$22.3 billion in export sales.45
BDC services are geared towards start up and
international expansion. Beyond that point it seems that companies will have to solicit the services of
the other organizations.
Table 6
BDC Export Performance Indicators
Year 2010 2011 2012 2013
Exporting Clients 5600 5300 4900 4700
Export Sales ($B) 22.3 21.6 22.7 21.9
Data from WTO Trade Policy Review of Canada 2011,and the Library of
Parliament
BDC provides financing for exploration of international opportunities, as well as funding for
SMEs establishing a foothold in a foreign market. BDC also provides consulting services in the areas of
global competitiveness assessment and international business development planning either directly or
in partnership with the Forum for International Trade Training and the Department of Foreign Affairs
and International Trade. BDC clearly articulates its role and challenges within the global context; it also
constantly discusses how the global economy is impacting the private sector. It monitors the export
performance of its clients and records the number of exporting BDC clients, which has decreased by
almost 20%. Export sales have also experienced a decrease. This suggests that SME clients of BDC have
made up the reduction in exporting firms. BDC is the only organization that is not under the Ministry of
Trade and yet it clearly articulates its international role and impact. BDC’s strategic direction is well
formulated within the context of current global challenges.
4.1.5 Trade Commissioner Services (TCS)
The Trade Commissioner Service (TCS) is the Federal government’s network of international
trade professionals. TCS promotes Canadian trade interests abroad by assisting companies to export,
invest, and innovate. Export promotion constitutes the main line of operations however science and
technology, and investment are part of their offered services. TCS network claims to have over 150
overseas locations; however some office locations are actually responsible for multiple countries as such
44
CCC Annual Report 2012-2013. Viewed at: http://publications.gc.ca/site/eng/457449/publication.html
45
WTO, Trade Policy Review Canada Report by Secretariat 2011.
Office of The C. Honourable Hervieux-Payette P.C., Senator 30 Review of FTAs and Trade Policies of Canada 2006 - 2015
there is a lot double counting in this figure. TCS activities are funded by the DFATD budget which is
subject to "value for money" assessments over a five-year cycle.
A recent study released by the Canadian Chamber of Commerce identified 8 major barriers and
provided an additional list of the appropriate policy lever to overcome the identified obstacle. Of the 8
identified policy levers, 5 of them fall under the mandate of the Trade Commissioner Services.46
The
report establishes that there is considerable lack of synergy and coordination within the Federal Trade
Facilitation Services. As noted before, the Trade Commissioner Services database is only made up of 20
000 companies, half of the total number of Canadian companies that are active exporters. TCS does not
keep track of the number of exporting clients, claiming that TCS clients are not tagged according to
whether the client was an exporter, according the Parliament Library of Canada; despite claiming that
exports constitute their main line of their operations.
Other programs such as the Global Opportunities for Associations provides over $3 million to
national associations for trade development activities and is the TCS main outreach method for export
promotion and encouragement to businesses within Canada. The amount given to any association never
exceeded $150 000.47
Given the chosen method of interacting with Canadian businesses, the funds
provided, and the size of the of the associations’ membership, it is possible that the impact of such
engagements may either be inadequate or compromise the program’s goals due to limited resource
being spread too thinly. Further analysis is required with particular emphasis on this program’s ability to
encourage SMEs to engage in international trade activities. TCS used to have an online portal, the Virtual
Trade Commissioner, which provided companies personalized access to over 1,000 trade professionals.
However, the portal has been shut down.48
An empirical study of Canadian exporters of manufactured
goods, spanning 1999-2006, found that TCS assistance had a positive impact on its clients' performance,
both in terms of export value and market diversification; however they also stated that the services
were more frequently used by larger organizations.49
Given the fact that experience and size with TCS
seem to play a large role regarding use, one could infer that it may take companies some time to learn
about TCS services and time to understand how to access and implement those services properly into
their regular business operations. It also means that the cost to hire or designate resources to apply for
TCS policies and programs is too expensive for some SMEs. Conducting an assessment of this fact in a
more depth analysis is required.
4.2 Trade Performance Score
The impact of global changes, a high currency value, and higher levels of competition have all
struck home within the Federal Trade Facilitation Services. One of the challenges that appear to be
giving the government and the private sector trouble is switching from exporting to advanced
economies (such as the EU and the United States) to exporting to developing countries and emerging
46
The Canadian Chamber of Commerce 2014, Turning it Around: How to Restore Canada’s Trade Success. Viewed at:
http://www.chamber.ca/download.aspx?t=0&pid=b06a4f25-bbd7-e311-93a5-000c29c04ade
47
TCS website: http://www.tradecommissioner.gc.ca/eng/funding/home.jsp#GCSP
48
TCS website: http://www.tradecommissioner.gc.ca/eng/tcs.jsp
49
Van Biesebroeck, Johannes, Emily Yu and Shenjie Chen 2010, The impact of trade promotion services on Canadian exporter performance.
Viewed at: http://www.international.gc.ca/economist-economiste/assets/pdfs/research/T PR_2010/Chapter5-eng.pdf..
Office of The C. Honourable Hervieux-Payette P.C., Senator 31 Review of FTAs and Trade Policies of Canada 2006 - 2015
markets. Another problem is there seems to be a significant lack of coordination between the various
organizations. Finally the results of SMEs and emerging market interactions are not encouraging. Proper
policies should be developed to confront the obstacles preventing medium sized firms from exporting
and from growing. On a whole there is cause for concern and there is ample reason rethink Canada’s
Federal Trade Facilitation Strategy, which is necessary for Canadians to benefit from the new Free Trade
Agreements being announced, signed and implemented on their behalf by DFATD. Canada’s trade
facilitation agencies need to be structured to confront today’s challenges and opportunities.
Office of The C. Honourable Hervieux-Payette P.C., Senator 32 Review of FTAs and Trade Policies of Canada 2006 - 2015
5.1 Canada’s Export Network and Provincial Trade Promotion
The various organizations of the Department of Foreign Affairs, International Trade and
Development are not the only Canadian public entities that represent Canadians abroad for the
purposes of trade promotion. Many provinces conduct their own trade promotion programs, including
the establishment of offices abroad, grant funding, market intelligence and other financial support. For
the purposes of this report, only Alberta, British Columbia, Ontario and Quebec were examined, this is
due to the fact that these are the four largest provincial economies. The purpose of this assessment is to
profile their priority markets and the various policy and programs that are used to promote trade at a
provincial level.
Table 7
Provincial Trade Offices and Representatives Abroad
Country Alberta B. C. Ontario Quebec Total
China Yes Yes Yes Yes 4
India Yes Yes Yes Yes 4
Japan Yes Yes Yes Yes 4
United Kingdom Yes Yes Yes Yes 4
United States of America* Yes Yes Yes Yes 4
Germany Yes Yes Yes 3
Brazil Yes Yes 2
Hong Kong, SAR* Yes Yes 2
Korea, Republic Yes Yes 2
Mexico* Yes Yes 2
Singapore Yes Yes 2
United Arab Emirates Yes Yes 2
Totals 11 7 10 19 47
Countries where there are less than two provinces
Argentina (Q), Burkina Faso (Q), Chile (On)*, France (Q), Italy (Q), Morroco (Q), Poland
(Q), Romania (Q), Russia (Q), Senegal (Q), Taiwan (A), Turkey (Q), Ukraine (Q),
Vietnam(Q).
*Free Trade Agreement
The four largest provinces operate 47 offices that span Africa, Asia, Europe and South America.
This includes advanced economies, emerging markets and developing countries. There are five countries
where all four provinces are present. Three of these countries are China, India and Japan which indicate
that presence in Asian economies of importance is a priority for all four provinces. The remaining two
economies are largest English speaking economies, the United Kingdom the United States. The reverse is
not observed in France where only Quebec has established a presence. South America and Africa seem
to be the least important. Finally the four Asian Tiger Economies which operate as hubs for international
Office of The C. Honourable Hervieux-Payette P.C., Senator 33 Review of FTAs and Trade Policies of Canada 2006 - 2015
activity only seem to be a priority for Alberta and British Columbia.50
It would be interesting to assess
and compare the results of offices and representatives located in global hubs versus offices located in
large or emerging economies. Finally it should be noted that the Trade Commissioner Service has
representation in every country that is listed above.
5.1.1 Alberta
The Government of Alberta provides international and intergovernmental relations with regards
to international export development and investment. The services provided include: market intelligence
to “export ready” Albertan companies; networking and contact information; assistance in foreign
market access; investment promotion; and showcasing of Albertan products and services. Alberta
maintains 13 international offices that are responsible for advancing advocacy, trade promotion, and
investment.51
These foreign offices’ mandates are tailored depending on Alberta's priorities within an
individual office’s region. Their office in Washington Office focuses on advancing Alberta’s policy
interest in the United States. The remaining international offices focus on trade promotion and
investment attraction in energy, tourism, agriculture, education and advanced industries. In addition
these offices offer support to Albertan businesses aiming to globally expand. These offices work in
conjunction with Alberta.52
Graph 18
Data Source: Industry Canada53
Until the recent events of the global oil price decline, whose impacts have yet to be completely
assessed, Alberta was the only large province that enjoyed a trade surplus as of 2013. However in 2004
50
The Four Asian Tiger Economies are: Hong Kong; Singapore; South Korea; and Taiwan
51
Alberta has 3 separate offices across the United States, while the remaining 9 offices are all in different countries.
52
Government of Alberta International and Intergovernmental Relations online information, viewed at:
http://www.international.alberta.ca/954.cf
53
Industry Canada, Online Trade Data.
0
20,000
40,000
60,000
80,000
100,000
120,000
Alberta
Alberta Exports Alberta Imports Alberta Energy Exports
Office of The C. Honourable Hervieux-Payette P.C., Senator 34 Review of FTAs and Trade Policies of Canada 2006 - 2015
Alberta Energy exports represented 66% of total exports, this level of dependence climbed to 74% by
2013. It should be noted that by removing Alberta’s energy exports from the total, the province
operates at a trade deficit. This deficit has constantly grown over the past decade. By 2013, Albertan
exports had yet to fully recover to the level set in 2008. Given the collapse of the oil price in 2014, it is
unlikely that this 2008 high was surpassed or will be achieved in the near future. Alberta’s largest
challenge over the coming years in terms of exports will be to diversify away from energy.
5.1.2 British Columbia
British Columbia’s international trade strategy is divided between export promotion services
and foreign investment attraction. To companies based in British Columbia it provides the following
services: Market intelligence; strategic consulting for international expansion; network contacts; Legal,
Financial and other trade services as well as referrals to a range of service providers; Trade missions and
events hosting; and finally seminars and training services. With regards to attraction investment,
provided services include: Local market intelligence and information; customized and confidential
project analysis; introductory briefings: site tours; investigations of facilities and meetings with
community leaders; networking of local business contacts; and assistance in accessing federal, provincial
and local government programs. Of the four largest provinces, BC maintains the fewest foreign offices,
with an unsurprising focus on the Asian-Pacific region.54
Graph 19
Data Source: Industry Canada55
Of the four largest provinces, BC is the only province where Exports surpassed their pre-crisis
level by the end of 2013. However, starting in 2005 and continuing until 2009, BC exports experienced a
decline of 27%. Exports in 2013 were unable to surpass the 2005 high. Imports have decreased as a
54
Trade and Invest British Columbia online information, viewed at: http://www.britishcolumbia.ca/export/index.aspx
55
Industry Canada, Online Trade Data.
0
5,000
10,000
15,000
20,000
25,000
30,000
35,000
40,000
45,000
50,000
British Columbia
BC Exports BC Imports
Office of The C. Honourable Hervieux-Payette P.C., Senator 35 Review of FTAs and Trade Policies of Canada 2006 - 2015
result of the economic crisis and resumed their growth post-crisis. Energy, natural resources, lumber
and other lumber based products were largest exporting sectors.56
Although the end of the energy
boom will also have an impact on BC’s exports, the province is not as dependent on energy as Alberta.
5.1.3 Ontario
Of the four largest provinces, Ontario features the most ambitious international trade program.
Although it has only established offices in 10 countries, services and programs offered by the provincial
government go beyond market intelligence and aid in accessing federal services. As articulated in the
Provinces “Going Global Strategy”, Ontario’s policies have the following objectives: increasing the
number of exporting companies; and enable global expansion of Ontario based companies.57
Services
offered by the Ontario government include: market intelligence, skills development and training; market
and export consulting; and trade missions. Ontario also maintains a “Global Growth Fund” that is
administered by the Ontario Chamber of Commerce. This fund finances two programs. The first is the
Export Market Access Program designed to cover the direct costs of developing international markets.
The second program is the Ontario Exporter Fund which covers the cost of hiring export managers for a
full 2 years. There also a heavy emphasis on enabling Small and Medium enterprises to export. This
includes a serious effort to streamline resources in an effort to minimize the time and costs to access
foreign markets for SMEs. This streamlining process includes improving collaboration between
commercial groups (such as the Ontario Network of Enterprises), federal, provincial and municipal
governments.
Graph 20
Data Source: Industry Canada58
56
Library of Parliament 2013, British Columbia’s Merchandise Trade with the World. Viewed at:
http://www.parl.gc.ca/Content/LOP/ResearchPublications/2013-31-e.pdf
57
Government of Ontario, Going Global Trade Stategy. Viewed at: https://dr6j45jk9xcmk.cloudfront.net/documents/665/tradestrategy-en.pdf
58
Industry Canada, Online Trade Data.
0
50,000
100,000
150,000
200,000
250,000
300,000
Ontario
Ontario Exports Ontario Imports
Office of The C. Honourable Hervieux-Payette P.C., Senator 36 Review of FTAs and Trade Policies of Canada 2006 - 2015
For the past decade, Ontario has operated at a continuously growing trade deficit. Given the
decline in Ontario’s manufacturing sector, it is likely that this trade deficit is structural. Imports to
Ontario did experience as decline as a result of the recession though they have since surpassed their
pre-crisis high. Unfortunately the same cannot be said for Ontario’s exports. Exports did decline but
have yet to recover to their pre-crisis high. It should also be noted that prior to 2007, growth in Ontario
exports was almost non-existent. As such the structural shift away from manufacturing seems not to
have been caused by the crisis but only accelerated by it.
5.1.4 Quebec
Export Quebec, a department of the Ministry of the Economy released in October 2013 a Trade
Development Plan Outside 2013-2017, targeted at reducing Quebec’s international trade deficit. It aims
at boosting exports, consolidating traditional markets, the developing of new markets and encouraging
companies to become exporters. The plan is based on four main objectives namely: to provide services
and facilitate access markets; prepare companies for global markets; support business abroad; and
promote the strengths of the Quebec economy.59
Export Quebec offers many services meant to reduce
the time, cost, and export risks. These services include market intelligence, consultations and network
services, trade shows and financial support. Currently Export Quebec is revising their export programs
and receipts of applications have been suspended.60
Graph 21
Data Source: Industry Canada61
Quebec’s trade balance was operating at a declining surplus prior to the economic crisis; the
trade balance became a deficit during the crisis and continues to operate at this balance. Exports
59
Export Quebec, online information viewed at: http://www.economie.gouv.qc.ca/objectifs/exporter/outils/
60
Export Quebec, online information viewed at: http://www.economie.gouv.qc.ca/objectifs/exporter/services/programmes-daide/programme-
exportation/
61
Industry Canada, Online Trade Data.
0
10,000
20,000
30,000
40,000
50,000
60,000
70,000
80,000
90,000
Quebec
Quebec Exports Quebec Imports
Office of The C. Honourable Hervieux-Payette P.C., Senator 37 Review of FTAs and Trade Policies of Canada 2006 - 2015
seemed to have stagnated from 2004 to 2007. Exports then fell in 2009 and have yet to fully recover to
the level set in 2007 or the all-time high achieved in 2006. Imports experienced strong increase from
2004 to 2007, they then fell and have been steadily recovering since the recession. As of 2013 exports
seem to be slowly recovering at the same stagnant pace witnessed before the recession. This suggests
that although the recession decreased exports, growth was already a problem prior to the recession.
This further suggests that the problems being faced by the Quebec economy in relation to export
growth are structural and not cyclical.
5.2 Overall Provincial Performance
Of the four largest provinces in Canada, not a single one has been able to surpass the pre-
recession high set in exports. Export decline in Quebec and British Columbia started prior to the
recession, and Ontario experienced stagnant growth pre-recession. Alberta’s non-energy exports
experienced declines prior to recession while energy based exports grew at a tremendous pace. At the
time of writing Alberta’s energy exports are decreasing due to a collapse in oil prices, the full impact has
yet to be assessed. What is clear from these findings is export growth is not just a cyclical problem.
There are structural issues that must be resolved at the provincial level.
Commonalities in the approaches of the provincial governments have adopted creates room for
the development of national project or program. All four major provinces operate foreign offices,
provide market intelligence, etc. Many of these services are also provided by the Federal Government.
In other areas where there are differences between approaches, comparisons could be done in order to
determine whether or not these policies should be replicated. Only Ontario and Quebec have dedicated
SME trade programs listed on their websites. The Quebec program is a series of partnerships with
international cities and partners and it is promoted as an additional component. This contrasts with the
approach taken by Ontario which advertises a SME program that is integrated as a core part of not only
the trade promotion policies but of Ontario’s overall economic strategy. As such it seeks to get exporting
SMEs to work in conjunction with the rest of the Ontario system. Creating an integrated National
Program that is capable of enabling SMEs to operate in global markets may be one of the few ways to
re-start stagnate export growth that is affecting all four provinces. A national program would allow for
assessment of the best practices and replication amongst not only the four largest provinces but of all
provinces and territories in Canada.
Office of The C. Honourable Hervieux-Payette P.C., Senator 38 Review of FTAs and Trade Policies of Canada 2006 - 2015
6.1 Strategic Analysis and Policy Recommendations
Canada’s trade situation and its trade facilitation services do not exist within an encouraging
picture. Many changes have impacted Canada’s exports: Subprime-crisis and recession; Euro crisis; and
the rise of Asia and other emerging markets. The question must be asked whether or not the
government organizations responsible for facilitating trade are flexible enough to cope with the
situation. The answer is not in the current format. Within the current times of globalization, the
differences between trade and the domestic economy are evaporating at an alarming rate. Trade now
represents at integral component to the domestic economy. The government should recognize this both
in terms of the services and in terms of private sector policy.
6.2 Better Coordination between Foreign and Domestic Commercial
Development
In order to address problems within the Federal Trade Facilitation Strategy, the government
should consider placing all trade facilitation agencies under a single ministry. As discussed in this report
there is a lack of coordination. The number of organizations and their specific functions may act as an
obstacle due to the fact that considerable knowledge is needed to understand every organization and
their services; this complexity may confuse entrepreneurs. One way of dealing with the complexity,
overlap and lack of coordination would be to place EDC, TCS and CCC all under the Ministry of Industry
with BDC. Highly competitive countries such as Germany, Singapore, Hong Kong, and Japan do not have
separate ministries for trade and industry; instead they ensure domestic and international cohesion by
having a single ministry. The gains made from having all services under one ministry will enable efficient
use of resources and ensure vital coordination. Another gain is that there would be some harmonization
between the human resources of BDC and the other services. The former DFATD organizations would be
obliged to adopt a more private sector acumen whereas BDC would be end up with more internationally
capable staff. Simply put the Ministry of Industry would become more international in their approach
while the former DFATD organizations would be more business oriented.
6.3 Global Value Chains
In the 21st
century, conventional methods of analyzing contain two increasingly large flaws. Both
are assumptions necessary for the conventional models to work. The first assumption is ignoring Value
Added and the second is the belief that trade only occurs in finished goods and services. Continuing to
base policy on these figures alone introduces biases against the inputs that are responsible for making
the Canadian economy competitive. In fact part of Canada’s productivity problem can be explained by
Global Value Chains (GVC). GVC Analysis is nothing more than a means to update our perspective of
trade in order to ensure that the gains from trade are realized and spread throughout the economy in a
fair and equitable manner. In Canada, manufactured products are the majority of Canadian exports, yet
the Canadian economy’s output is 80% services. The reason why GVC is important is that it
Recommendation # 1
One Ministry of Industry and Trade should be responsible for all foreign and domestic commercial
agencies and activities.
Office of The C. Honourable Hervieux-Payette P.C., Senator 39 Review of FTAs and Trade Policies of Canada 2006 - 2015
demonstrates the linkages between the various sectors; in this case enabling Canadians to understand
the connection between manufacturing (the largest exporter) and services (the largest producer).
The first assumption to be addressed is the belief that no attention should be given to Economic
Value Added. Value Added is the summation of wages paid, returns to the capital account and the net
taxes collected by the government (taxes minus subsidies); it is the total value gained by society for a
specific economic activity. The only justification for this assumption is the belief that Value Added
Content is equal across all sectors and countries. Any comparison across all sectors in all economies will
reveal that the level of Value Added varies by sector and by country. For advanced economies,
agricultural sectors yield the least Value Added, Manufacturing sectors yield average to below average
levels, and the Service sectors yield the most relative to an economy’s total output. As such economies
must consider the dispersion of Value Added content contained within their exports.
Graph 22
Data Source: World Input Output Database62
The second assumption is the belief that the majority of global trade continues to occur in
finished products. In the 21st
century the opposite is true, the value of trade in intermediate goods and
services outweigh the value of trade in finished goods and services. Countries are increasingly trading
tasks and inputs of production. Conventional models have always treated exports and imports as
finished goods. This overlooks imports that are inputs for Canada’s exports and other such relationships.
Most finished products sold internationally contain components and services from various corners of
the world; as such products are now “Made in the World”.63
Effectively, today trade is coordinated by
Large Multinational companies who source tasks to domestic Medium sized firms who are competitive
62
WIOD. Viewed at: http://www.wiod.org/new_site/home.htm
63
WTO online information, Made in the World. Viewed at: http://www.wto.org/english/res_e/statis_e/miwi_e/miwi_e.htm
0.00%
10.00%
20.00%
30.00%
40.00%
50.00%
60.00%
70.00%
2007 2008 2009 2010 2011
Canada Share of Gross Exports
Agriculture Natural Resources Manufacturing Services
Office of The C. Honourable Hervieux-Payette P.C., Senator 40 Review of FTAs and Trade Policies of Canada 2006 - 2015
enough to deliver better quality at a lower price. The matter of concern is that Gross Exports accounts
for the amount of goods and services internationally sold by a sector; simply put international revenue.
In reality what matters in terms of growth and job creation are the earnings enabled by exports; known
as Value Added Exports. As such GVC analysis enables division of Gross Exports into Value Added Exports
which account for sector earnings.64
Graph 23
Data Source: World Input Output Database
The major point of GVC is to demonstrate that exports sales and export earnings are not at all
the same thing. As Displayed by Graph 22 the majority of Canada’s exports are indeed manufactured
goods. However, as displayed by Graph 23 the export income earned by each sector does not at all
reflect the same dominance of manufacturing because Canadians services are being increasingly
integrated into manufacturing. An example would be Engineering services in the automotive sector,
which are needed to design cars built in Canadian factories; without competitive designs Canada’s
factories will be unable to produce competitive cars. In fact only by using GVC can policy makers
understand the structural shift that is transforming the Canadian economy. Services are no longer
performed in an effort to support manufacturing. Goods are manufactured in order to export Canadian
services. Before the crisis, the Value Added composition of exports was almost evenly divided between
services and manufacturing. Since the crisis, services have emerged as the dominant growth driver for
exports. Although there has been a slight recovery in manufacturing, it is likely that this change is
permanent, or else a more rapid export recovery would have been observed.65
64
See Appendix: 2.
65
$30 Billion CAD of manufactured exports have permanently disappeared from the Canadian economy. Transcript Oct. 29th
, 2014 from the
Senate Standing Committee on Bank, Trade and Commerce, Governor of the Bank of Canada’s, Stephen Poloz, Testimony. Viewed at:
0.00%
10.00%
20.00%
30.00%
40.00%
50.00%
60.00%
70.00%
2007 2008 2009 2010 2011
Canada Share of Value Added Exports
Agriculture Natural Resources Manufacturing Services
Office of The C. Honourable Hervieux-Payette P.C., Senator 41 Review of FTAs and Trade Policies of Canada 2006 - 2015
Graph 24
Data Source: Labour Force Survey Statistics Canada
The WIOD’s database is new and is still under development; as such the most recent year is
2011. The Labour Force Survey’s results reflect the same transition over time. Manufacturing
employment hasn’t grown and is in fact still recovering. Meanwhile the service sector has increased by
almost 20% since the 2004 level and was only slowed down by the 2008-2009 crisis. It must be noted
that Natural Resources have never been the dominant player in Value Added Exports. This implies that
the gains to developing the Natural Resource sector will not be as large or as beneficial when compared
to any policy that facilitates the development of Canada’s Service Economy. Simply put a National
Childcare Program will contribute more to Canada’s international competitiveness than any pipeline due
to the fact the Service sector is the most female worker intensive sector; without this program we deny
our service sector access to some of the most highly trained and educated Canadian workers available.
The implications of this system reach beyond exports and imports. For Canada this system
reveals that there is a strong need for government policies. Switching from a manufacturing economy to
a service-based economy guarantees higher levels of structural unemployment resulting from factory
layoffs. The jobs lost and the jobs gained require different levels of education and skill sets. Trade is no
longer a matter of foreign market activities; it now encompasses all interactions between a single
country and the Global Economy. As explained above, accounting for Value Added is the crucial
component of this analysis. Finally production occurs in “Chains”, meaning differing sectors across many
countries have begun to work together. Policies that encourage inclusion such Germany’s “Make it in
Germany” outperform Canada’s exclusive approach of “Made in Canada”. As such the first step to
ensuring that both the public and private sector understand how Canada participates in GVCs is to
develop and publically issue data covering all aspects of Global Value Chains. All governments must
recognize the structural change in exports and design policies that ensure that the Canadian economy
works in tandem with this change as opposed to resisting it.
0.00%
20.00%
40.00%
60.00%
80.00%
100.00%
120.00%
140.00%
Change in Sector Employment
Goods Services
TR 2015 ENG May 2015

More Related Content

Viewers also liked

A development approach SUPERVISION
A development approach SUPERVISIONA development approach SUPERVISION
A development approach SUPERVISIONBadruzzaman_007
 
20080523_SID_71-1_Wenchih
20080523_SID_71-1_Wenchih20080523_SID_71-1_Wenchih
20080523_SID_71-1_WenchihWen-Chih Tai
 
đau đầu Gối ở Trẻ Em
đau đầu Gối ở Trẻ Emđau đầu Gối ở Trẻ Em
đau đầu Gối ở Trẻ Emmariano271
 
Whitney houston......................
Whitney houston......................Whitney houston......................
Whitney houston......................crystinn
 
Projekt člověk 3
Projekt  člověk 3Projekt  člověk 3
Projekt člověk 3hankaamb
 
2014 IHBI Advances Edition 20
2014 IHBI Advances Edition 202014 IHBI Advances Edition 20
2014 IHBI Advances Edition 20Shanchita Khan
 
Guía de cuadriláteros
Guía de cuadriláterosGuía de cuadriláteros
Guía de cuadriláterosmaxsal87
 
Aluminium products from Akcome Co.
Aluminium products from Akcome Co.Aluminium products from Akcome Co.
Aluminium products from Akcome Co.Vicky Chu
 
энергосбережение и энергоэффективность
энергосбережение и энергоэффективностьэнергосбережение и энергоэффективность
энергосбережение и энергоэффективностьlavincifitness2
 
11 платформа microsoft office расширенные возможности
11 платформа microsoft office   расширенные возможности11 платформа microsoft office   расширенные возможности
11 платформа microsoft office расширенные возможностиKewpaN
 

Viewers also liked (12)

Awards
AwardsAwards
Awards
 
A development approach SUPERVISION
A development approach SUPERVISIONA development approach SUPERVISION
A development approach SUPERVISION
 
20080523_SID_71-1_Wenchih
20080523_SID_71-1_Wenchih20080523_SID_71-1_Wenchih
20080523_SID_71-1_Wenchih
 
đau đầu Gối ở Trẻ Em
đau đầu Gối ở Trẻ Emđau đầu Gối ở Trẻ Em
đau đầu Gối ở Trẻ Em
 
Whitney houston......................
Whitney houston......................Whitney houston......................
Whitney houston......................
 
Projekt člověk 3
Projekt  člověk 3Projekt  člověk 3
Projekt člověk 3
 
2014 IHBI Advances Edition 20
2014 IHBI Advances Edition 202014 IHBI Advances Edition 20
2014 IHBI Advances Edition 20
 
Guía de cuadriláteros
Guía de cuadriláterosGuía de cuadriláteros
Guía de cuadriláteros
 
Aluminium products from Akcome Co.
Aluminium products from Akcome Co.Aluminium products from Akcome Co.
Aluminium products from Akcome Co.
 
MANUEL R
MANUEL RMANUEL R
MANUEL R
 
энергосбережение и энергоэффективность
энергосбережение и энергоэффективностьэнергосбережение и энергоэффективность
энергосбережение и энергоэффективность
 
11 платформа microsoft office расширенные возможности
11 платформа microsoft office   расширенные возможности11 платформа microsoft office   расширенные возможности
11 платформа microsoft office расширенные возможности
 

Similar to TR 2015 ENG May 2015

Submission_to_the_Competition_Policy_Review_Panel
Submission_to_the_Competition_Policy_Review_PanelSubmission_to_the_Competition_Policy_Review_Panel
Submission_to_the_Competition_Policy_Review_PanelJascha Jabes
 
BNS_Submission_2008_Legislative_Review
BNS_Submission_2008_Legislative_ReviewBNS_Submission_2008_Legislative_Review
BNS_Submission_2008_Legislative_ReviewJascha Jabes
 
Thomas Storring - Reaching our international trade goals
Thomas Storring - Reaching our international trade goalsThomas Storring - Reaching our international trade goals
Thomas Storring - Reaching our international trade goalsonens
 
Fiscal and Economic Management| Canada| August 2020| Analysis and Commentary
Fiscal and Economic Management| Canada| August 2020| Analysis and CommentaryFiscal and Economic Management| Canada| August 2020| Analysis and Commentary
Fiscal and Economic Management| Canada| August 2020| Analysis and Commentarypaul young cpa, cga
 
Economic reports and outlooks - Québec City CMA, 2014-2015
Economic reports and outlooks - Québec City CMA, 2014-2015Economic reports and outlooks - Québec City CMA, 2014-2015
Economic reports and outlooks - Québec City CMA, 2014-2015Université Laval
 
Fiscal Management and Performance Audit| Canada
Fiscal Management and Performance Audit| Canada Fiscal Management and Performance Audit| Canada
Fiscal Management and Performance Audit| Canada paul young cpa, cga
 
Doing Business in Canada - final presentation
Doing Business in Canada - final presentationDoing Business in Canada - final presentation
Doing Business in Canada - final presentationScottish Enterprise
 
Economic Development Corporation
Economic Development CorporationEconomic Development Corporation
Economic Development CorporationColin McKillop
 
PNT4019_PLC_RA2014-15_EN_v11
PNT4019_PLC_RA2014-15_EN_v11PNT4019_PLC_RA2014-15_EN_v11
PNT4019_PLC_RA2014-15_EN_v11Chantal Marcotte
 
Canadaoecd info april2014
Canadaoecd info april2014Canadaoecd info april2014
Canadaoecd info april2014Dr Lendy Spires
 
Chapter 15 Whats makes aleader 2-8-2024.ppt
Chapter 15 Whats makes aleader 2-8-2024.pptChapter 15 Whats makes aleader 2-8-2024.ppt
Chapter 15 Whats makes aleader 2-8-2024.pptMohamedRashad398974
 
Key industry and market indicators for may 2015 canada and north america
Key industry and market indicators for may 2015   canada and north americaKey industry and market indicators for may 2015   canada and north america
Key industry and market indicators for may 2015 canada and north americapaul young cpa, cga
 
Liberal Party of Canada Economic Council - Report Analysis
Liberal Party of Canada Economic Council - Report Analysis Liberal Party of Canada Economic Council - Report Analysis
Liberal Party of Canada Economic Council - Report Analysis paul young cpa, cga
 
Integrating trade in the sustainable development strategies of least develope...
Integrating trade in the sustainable development strategies of least develope...Integrating trade in the sustainable development strategies of least develope...
Integrating trade in the sustainable development strategies of least develope...Enhanced Integrated Framework
 
CANADA | CTC Corporate Plan Summary | 2016 - 2019
CANADA | CTC Corporate Plan Summary | 2016 - 2019CANADA | CTC Corporate Plan Summary | 2016 - 2019
CANADA | CTC Corporate Plan Summary | 2016 - 2019BTO Educational
 

Similar to TR 2015 ENG May 2015 (20)

Submission_to_the_Competition_Policy_Review_Panel
Submission_to_the_Competition_Policy_Review_PanelSubmission_to_the_Competition_Policy_Review_Panel
Submission_to_the_Competition_Policy_Review_Panel
 
BNS_Submission_2008_Legislative_Review
BNS_Submission_2008_Legislative_ReviewBNS_Submission_2008_Legislative_Review
BNS_Submission_2008_Legislative_Review
 
Final Version of CD Report
Final Version of CD ReportFinal Version of CD Report
Final Version of CD Report
 
Iu4-78-2006E-I
Iu4-78-2006E-IIu4-78-2006E-I
Iu4-78-2006E-I
 
How Canada Promotes International Trade
How Canada Promotes International TradeHow Canada Promotes International Trade
How Canada Promotes International Trade
 
Thomas Storring - Reaching our international trade goals
Thomas Storring - Reaching our international trade goalsThomas Storring - Reaching our international trade goals
Thomas Storring - Reaching our international trade goals
 
Fiscal and Economic Management| Canada| August 2020| Analysis and Commentary
Fiscal and Economic Management| Canada| August 2020| Analysis and CommentaryFiscal and Economic Management| Canada| August 2020| Analysis and Commentary
Fiscal and Economic Management| Canada| August 2020| Analysis and Commentary
 
Economic reports and outlooks - Québec City CMA, 2014-2015
Economic reports and outlooks - Québec City CMA, 2014-2015Economic reports and outlooks - Québec City CMA, 2014-2015
Economic reports and outlooks - Québec City CMA, 2014-2015
 
2011 Energy Summit - CME Presentation by Ian Howcroft
2011 Energy Summit - CME Presentation by Ian Howcroft2011 Energy Summit - CME Presentation by Ian Howcroft
2011 Energy Summit - CME Presentation by Ian Howcroft
 
Fiscal Management and Performance Audit| Canada
Fiscal Management and Performance Audit| Canada Fiscal Management and Performance Audit| Canada
Fiscal Management and Performance Audit| Canada
 
Doing Business in Canada - final presentation
Doing Business in Canada - final presentationDoing Business in Canada - final presentation
Doing Business in Canada - final presentation
 
Economic Development Corporation
Economic Development CorporationEconomic Development Corporation
Economic Development Corporation
 
PNT4019_PLC_RA2014-15_EN_v11
PNT4019_PLC_RA2014-15_EN_v11PNT4019_PLC_RA2014-15_EN_v11
PNT4019_PLC_RA2014-15_EN_v11
 
Canadaoecd info april2014
Canadaoecd info april2014Canadaoecd info april2014
Canadaoecd info april2014
 
Chapter 15 Whats makes aleader 2-8-2024.ppt
Chapter 15 Whats makes aleader 2-8-2024.pptChapter 15 Whats makes aleader 2-8-2024.ppt
Chapter 15 Whats makes aleader 2-8-2024.ppt
 
Key industry and market indicators for may 2015 canada and north america
Key industry and market indicators for may 2015   canada and north americaKey industry and market indicators for may 2015   canada and north america
Key industry and market indicators for may 2015 canada and north america
 
2014 Public Policy Guide
2014 Public Policy Guide2014 Public Policy Guide
2014 Public Policy Guide
 
Liberal Party of Canada Economic Council - Report Analysis
Liberal Party of Canada Economic Council - Report Analysis Liberal Party of Canada Economic Council - Report Analysis
Liberal Party of Canada Economic Council - Report Analysis
 
Integrating trade in the sustainable development strategies of least develope...
Integrating trade in the sustainable development strategies of least develope...Integrating trade in the sustainable development strategies of least develope...
Integrating trade in the sustainable development strategies of least develope...
 
CANADA | CTC Corporate Plan Summary | 2016 - 2019
CANADA | CTC Corporate Plan Summary | 2016 - 2019CANADA | CTC Corporate Plan Summary | 2016 - 2019
CANADA | CTC Corporate Plan Summary | 2016 - 2019
 

TR 2015 ENG May 2015

  • 1. The Honourable Céline Hervieux-Payette, P.C. Senator Review of Free Trade Agreements and Trade Policies of Canada 2006-2015 Prepared by: David E. Hamilton 5/25/2015 A Call for National Action Abstract: After 1 year of reviewing Canada’s trade performance in the wake of the 2008 financial crisis and the benefits of the new free trade agreements signed by Canada since 2006, Senator Hervieux-Payette, Deputy Chair of the Standing Senate Committee on Banking, Trade and Commerce, had this study conducted in order to separate fact from fiction. Canada is experiencing a structural shift in its economy, and the Conservative government has never known how to deal with these changes. All it did was sign a record number of free trade agreements. But, in this new context, experience shows that these new agreements will not create trade surpluses or jobs on their own. Canada’s trade challenges require a modern approach and a strategic overhaul in order ensure that Canadians can succeed in today’s global environment.
  • 2. Office of The C. Honourable Hervieux-Payette P.C., Senator 1 Review of FTAs and Trade Policies of Canada 2006 - 2015
  • 3. Office of The C. Honourable Hervieux-Payette P.C., Senator 2 Review of FTAs and Trade Policies of Canada 2006 - 2015 Contents Executive Summary .........................................................................................................................................4 1.1 Introduction ..........................................................................................................................................6 1.2 The Global Trade Situation....................................................................................................................6 1.3 Canada’s Trade Performance................................................................................................................8 2.1 No Salvation through Currency...........................................................................................................10 2.2 The Disappearing Act of Canada’s Exporting Companies ...................................................................11 2.3 Dutch Disease or Development ..........................................................................................................13 3.1 Will the New Free Trade Agreements Solve this Problem? ................................................................15 3.1.1 NAFTA and Other Current FTAs ...................................................................................................15 3.1.2 Comprehensive and Economic Trade Agreement (CETA)............................................................18 3.1.3 Trans Pacific Partnership .............................................................................................................21 3.1.4 The Remaining FTAs under Negotiation ......................................................................................23 3.1.5 At Best Necessary but not at all Sufficient...................................................................................24 4.1 The Federal Trade Facilitation Services Performance.........................................................................25 4.1.1 Export Development Canada (EDC).............................................................................................25 4.1.2 EDC’s Super-Natural Jobs Facilitation for 2014 ...........................................................................27 4.1.3 Canadian Commercial Corporation (CCC)....................................................................................28 4.1.4 Business Development Bank of Canada (BDC) ............................................................................29 4.1.5 Trade Commissioner Services (TCS).............................................................................................29 4.2 Trade Performance Score ...................................................................................................................30 5.1 Canada’s Export Network and Provincial Trade Promotion................................................................32 5.1.1 Alberta .........................................................................................................................................33 5.1.2 British Columbia...........................................................................................................................34 5.1.3 Ontario.........................................................................................................................................35 5.1.4 Quebec.........................................................................................................................................36 5.2 Overall Provincial Performance ..........................................................................................................37 6.1 Strategic Analysis and Policy Recommendations................................................................................38 6.2 Better Coordination between Foreign and Domestic Commercial Development ..............................38 6.3 Global Value Chains ............................................................................................................................38 6.4 Strategic Basics for High Service Content Manufacturing...................................................................42 6.4.1 Technology and the Four Corners of High Value Added..............................................................42 6.4.2 Continual Education Policy ..........................................................................................................44 6.5 The German Mittelstand.....................................................................................................................45 6.5.1 The German Trade Network........................................................................................................46
  • 4. Office of The C. Honourable Hervieux-Payette P.C., Senator 3 Review of FTAs and Trade Policies of Canada 2006 - 2015 6.5.2 Central Innovation Program (CIP)................................................................................................47 6.6 Use of the German 3 Pillars by Competitive Economies.....................................................................49 6.7 Coordination with the Provinces and Federal Government ...............................................................50 6.8 Canada’s Parliament Needs Independent Reviews of Trade Agreements and be Responsible for Ratifying these Agreements ....................................................................................................................................51 7.1 Conclusion...........................................................................................................................................52 List of Recommendations..............................................................................................................................54 Appendix 1.....................................................................................................................................................55 Government has Actively Misled Parliament and the Canadian Public on CETA Figures .........................55 Announcement Document Tabled Without CETA Text ........................................................................55 No 80 000 New Jobs in the Estimates...................................................................................................55 CETA Pre-Study is Out of Date and Inaccurate .....................................................................................55 The WTO’s Doha Round was Not Implemented in 2014 ......................................................................56 Appendix 2.....................................................................................................................................................58
  • 5. Office of The C. Honourable Hervieux-Payette P.C., Senator 4 Review of FTAs and Trade Policies of Canada 2006 - 2015 Executive Summary The current export recovery since the Sub-prime Recession is the worst recovery in Canada’s modern history but to blame this situation on the recession alone would be a gross oversight. Prior to the crisis Canada’s exports underperformed due to a changing global environment. Where ever Canadian goods and services are sold they compete against global production. Global Trade has witnessed high growth in Emerging Markets. Trade is now an exchange of tasks as opposed to an exchange of goods and services. Trade is being organized into to networks of production known as Global Supply Chains. This review catalogues the impacts of these global forces on Canada’s exports. It assesses if the current policy response will enable Canadians to adapt. It provides seven major policy recommendations: all public foreign and domestic commercial policies and agencies should be placed under a single ministry; modern trade analysis methods must be used; best practices in technology development and continuing education program must be adopted; a new organization representing and operated by the private sector tasked with export promotion needs to be developed; policies are needed to create a robust network of innovative medium sized firms; a National Program to coordinate Provincial and Federal trade activities is needed and should periodically review the Canada’s trade strategy every 2 years and hold a biannual National Public Forum; and finally the Parliamentary budget officer should have the mandate and the resources to review all Free Trade Agreements when they are presented to Parliament. Growth in Canadian Imports has outpaced growth of Exports for a decade. Canada’s trade with the United States remains the dominant part of Canada’s export markets but exports to the United States plateaued starting in 2001. The impact of the dollar’s appreciation has led to fewer exporting firms; however the recent decline of the dollar due to the drop in energy prices will not produce a full recovery for manufacturing. Many would blame the decline of manufacturing on the Natural resource sector, but all G7 economies have experienced the same reduction despite not having a natural resource boom. Canada’s response has been to sign an unprecedented number of Free Trade Agreements. Canada’s experience with its free trade partners reveals that these agreements do not create trade surpluses; they expand the pre-existing balance. From this experience of expanded pre-existing balances then the new set of agreements will produce a net larger deficit. The study that analyzed the impact of a Free Trade Agreement with the European Union (CETA) predicts a deficit; but the data for this study is 11 years out of date and ignores the economic turmoil of the past 6 years. At best Canada’s free trade agreements are necessary but not sufficient to confront the export slump. Canada has four Trade Facilitation Agencies currently divided between the Department of Foreign Affairs, Trade, and Development (DFATD) and the Ministry of Industry (MI). All organizations have witnessed decreases in their performance. Jobs facilitated by Export Development Canada programs decreased by 20% between 2011 and 2013; and EDC’s reported figures for 2014 have serious flaws. The total value of Trade Facilitated by the Canadian Commercial Corporation decreased by 44%. There is a lack of coordination between these organizations. In the Age of Globalization, the barrier between domestic and foreign commercial activity is evaporating. Placing all Trade Facilitation Agencies under the Ministry of Industry would be the first step to ensure that Canadian public commercial policy is coordinated and designed to operate in a modern context.
  • 6. Office of The C. Honourable Hervieux-Payette P.C., Senator 5 Review of FTAs and Trade Policies of Canada 2006 - 2015 The four largest Canadian provinces (Alberta, British Columbia, Ontario and Quebec) also maintain their own trade offices and promotion programs with varying degrees of intensity. All four provinces have yet to fully surpass the pre-recession highs achieved in exports. Slow growth can be observed in all four with the exception of Alberta’s energy exports. The provinces’ policies and programs do overlap with each other and with the efforts of the federal government. Efforts should be made to better coordinate provincial and federal activities. The nature of trade has changed, international commerce occurs now in tasks as opposed to goods and services. Production networks are being organized across countries, as such many products are now “Made in the World” as opposed to a single country. This new geography requires new trade analysis and assessment methods. Global Value Chain (GVC) analysis was developed for this very purpose. Using GVC to analyze Canadian trade has revealed that the nature of Canadian exports has been permanently altered by the Sub-prime Crisis. Services have emerged as the dominate growth driver and earner of Canadian exports despite the fact that Manufactured exports make up the majority of Canadian goods sold internationally. High Service Content Manufactured Goods are the future for Canadian exports; policies that prioritize Science and Technology and adult education are key to success. Natural Resources have never been the dominate earner for the Canadian economy, and the development of this sector will not be as beneficial as believed. GVC also implies that Canada needs a robust network of Medium sized firms. Medium sized firms are important because they enable the distribution of the benefits of international trade. Without such a network, the gains from trade will be rewarded as a privilege of wealth. A good example these policies and programs would be the German Mittelstand. The Mittelstand policies are meant to ensure that Germany’s Medium Sized Firms adopt and use the latest technologies and most innovative processes. Germany has managed to maintain a low level of youth unemployment, a high level of SME exports, and better distribution of the gains from trade throughout the German population due to the Mittelstand Policies and Programs. A crucial component to the German system is that the German foreign office network is run by German private enterprises. This is achieved by extending the German domestic Chamber of Commerce network abroad to foreign markets. The result of this system is that the export offices are directly accountable to their clientele; the network represents the German private sector and works with the relevant ministry and agency to develop commercial policy, resulting in more flexibility, innovation and a higher level of international competitiveness. This direct accountability between the clientele of an export program is absolutely crucial in the rapidly changing global environment. This enables German businesses to develop appropriate trade strategies as opposed to waiting for the government ministry or agency to lead the way. The reason for the slow growth in exports is that the global environment has changed and Canadian efforts to keep pace with this change have been insufficient. Canada is being outcompeted and has been pushed out of the low-cost to medium cost end of manufacturing. Canada’s manufacturing future will be in high service content production. This transition can be achieved by: properly organizing and coordinating all public commercial services; by having a private sector handle part of the responsibilities for accessing foreign markets; by perceiving and responding to this environment with modern methods, techniques and public investments; and by implementing a set of policies and programs to ensure a robust network of medium sized firms capable of international commerce.
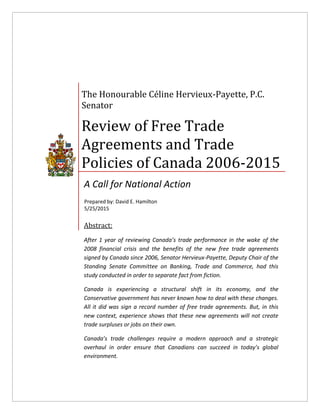
  • 7. Office of The C. Honourable Hervieux-Payette P.C., Senator 6 Review of FTAs and Trade Policies of Canada 2006 - 2015 1.1 Introduction “Export Wedge”, were the words spoken by Governor Poloz of the Bank of Canada when describing Canada’s trade deficit during the Senate Bank, Trade and Commerce Standing Committee meeting on April 30th of 2014. Governor Poloz pronounced this problem as serious a matter of public concern. Since the Sub-prime crisis, Canada’s trade performance has revealed itself to be the worst export recovery in modern times. The problems do not end with the trade deficit. Productivity growth has not kept pace and the returns of trade are increasingly delivered as a privilege of wealth. Our largest trade partner continues to dominate our exports; meanwhile emerging markets are gaining ground whereas Canadian exports have been unable to get a serious foothold abroad. The number of firms and jobs being created by trade are suffering. This new reality for Canadian trade is not without opportunities, however the Federal Government Trade Policy must acknowledge the severity of the current situation and develop policies and programs that will enable all Canadians to benefit from the trade agreements signed on their behalf. This study analyzes the federal export promotion services in the context of the current challenges in order to identify whether or not our trade facilitation structure is up to the task of ensuring Canadian prosperity in an increasingly globalized world. Graph 1 OECD Economic Surveys: Canada June 2014 1.2 The Global Trade Situation Trade has experienced 3 major changes: an increase in the number of participating countries; a change in the composition of trade; and reorganization into global supply chains. The main drivers of these developments are technology (particularly transport and communications) and political forces which have promoted, cushioned or resisted international trade. Trade has also benefitted from the support of global institutions such as the International Monetary Fund (IMF), the United Nations, the World Bank and the World Trade Organization (WTO). International Trade now has an institutional 0% 20% 40% 60% 80% 100% 120% 140% 160% Canada's Export Recoveries 1981/82 recession 1990/92 recession 2008/09 recession
  • 8. Office of The C. Honourable Hervieux-Payette P.C., Senator 7 Review of FTAs and Trade Policies of Canada 2006 - 2015 framework and a vast network. Trade policy is no longer solely about exporting and importing; it encompasses all interactions with the growing global economy. Modern Trade Policy must synthesize domestic needs within a greater global context. Graph 2 World Bank Data: Merchandise trade (% of GDP) Developing countries and emerging markets are a significant new force with a world export share at 47% in 2011. A large part of this activity for these economies is amongst each other, which rose from 8% of world trade in 1990 to 24% in 2011. In the same period, trade volume between developed and emerging markets countries has also grown from 33 % to 38%. From 1990 to 2011, the only area to decline in share of world trade was trade between developed economies, now 36% of global trade. Intra-regional trade (the same “continent” or area) has traditionally been more pronounced, though its share in Europe and North America has declined or remained unchanged. Asia has attained the largest share of Intra-regional Trade in exports.1 North America’s Intra-Regional trade declined to 48% in 2011 from 56% in 2001. The rest of the world has gained significant ground in the NAFTA zone; however the same cannot be said for North American gains abroad.2 World trade and international investment have been organized into inter-linked channels of activity, known as Global Supply Chains or Global Value Chains (GVC). Wherever the necessary skills are available for the right price and quality is where production will be located. This has led to an international fragmentation of production across networks of countries. Global Value Chains include both large Multinational Enterprises, who provide coordination, and medium-sized enterprises that operate as local buyers or suppliers.3 Given that countries share GVC, there is demand to ensure that regulations, which exist for public safety be “harmonized”. Harmonization is the adoption of global best practices; there is a danger of “best practices” being defined as the lowest level of regulation, which runs counter to public safety. Twenty first century trade is a brave new world of challenges and opportunities. 1 If the EU is counted as a single country. 2 World Trade Organization (WTO), World Trade Report, 2013. Viewed at: http://www.wto.org/english/res_e/publications_e/wtr13_e.htm 3 OECD, UNCTAD, and WTO. Implications of global value chains for trade, investment, development and jobs. Viewed at: http://www.oecd.org/trade/G20-Global-Value-Chains-2013.pdf 0 20 40 60 Growth in Trade Middle income OECD members
  • 9. Office of The C. Honourable Hervieux-Payette P.C., Senator 8 Review of FTAs and Trade Policies of Canada 2006 - 2015 1.3 Canada’s Trade Performance With new trade agreements to be approved and ratified, Canada’s global network of trade partners has expanded since the signing of the North American Free Trade Agreement. Access in terms of reduced tariffs has created new possibilities for the Canadian Private Sector. This new reality can be seen by the changes within the patterns of Canada’s trade relationships. To date the United States remains Canada’s largest trading partner for both imports and exports. However the importance of the American market regarding export growth is diminishing. Likewise the products being traded has changed in nature: exports of manufactured products have given way to professional services and natural resources. Graph 3 World Bank Data: Imports of goods and services; Exports of goods and services As demonstrated by Graph 3, growth in Canadian exports has been outpaced by growth in imports for the past decade. Growth of Canadian exports to the emerging markets has outpaced export growth to developed economies. Canada’s trade with the USA has remained relatively unchanged since 2001; however Canada’s trade with the rest of the world has increased by 80% during the same period.4 China, Brazil, India and Mexico have also demonstrated remarkable increases in trade with Canada, but only Mexico has a Free Trade Agreement with Canada. Accompanying these trends is the growing importance of the rest of the globe in Canada’s domestic economy. Facilitated by the WTO multilateral tariff reductions as well as bilateral treaties, Canada’s trade network has become more global. Canada’s trade policy now exists within a global network and must be properly formulated to deal with the dynamics of this environment. 4 The Conference Board of Canada 2012, Walking the Silk Road: Understanding Canada’s Changing Trade Patterns. Viewed at: http://www.conferenceboard.ca/e-library/abstract.aspx?did=5266 -20 -15 -10 -5 0 5 10 15 20 Growth (%) in Imports and Exports Imports Exports
  • 10. Office of The C. Honourable Hervieux-Payette P.C., Senator 9 Review of FTAs and Trade Policies of Canada 2006 - 2015 Emerging markets are now acting as the main driver of the trade trends of Canada, both in terms of what they are buying from Canada and where they are out-competing Canadians business at home and abroad. Despite the post crisis growth, Canadian exports have yet to regain their pre-crisis levels in terms of exports as a percentage of GDP.5 Although the countries of the developed world remain the largest trading partners of the Canadian economy, trade growth with developing countries and emerging markets has increased its pace accounting for 20% of total export growth. Emerging markets represented 13% of exports in 2011 up from 6% in 2001. The greatest change in exports has been a decline in manufacturing (which excludes natural resources), which accounted for 53% of Canadian exports in 2001, declining to 33% in 2011, most of this occurred in the automotive sector. This decline has been offset by gains in the non-renewable resource extraction and other manufacturing sectors. Although there have been positive signs for professional and other services, services continue to experience “lackluster” performance relative to Canada’s global peers; services account for almost 80% of Canada’s GDP.6 5 World Bank Indicators, Exports as a Percentage of GDP. Viewed at: http://data.worldbank.org/indicator/NE.EXP.GNFS.ZS?page=1 6 WTO, Trade Policy Review Canada Report by Secretariat 2011. Viewed at: http://www.wto.org/english/tratop_e/tpr_e/tp346_e.htm
  • 11. Office of The C. Honourable Hervieux-Payette P.C., Senator 10 Review of FTAs and Trade Policies of Canada 2006 - 2015 2.1 No Salvation through Currency Although the Canadian dollar has experienced a decline from parity, the currency is not expected to return to the lows of the 1990s that enabled large trade surpluses.7 The Canadian dollar’s appreciation over the past 15 years is often cited as the source of pain for Canadian exports. The implication that a lower dollar would eliminate the trade deficit is correct in theory. However the reality of such a decline occurring for the Canadian dollar is unlikely. Considering the exchange rate it should be noted that there are two reasons why the dollar will not return to the levels of 64-62 cents. The two main reasons for this position is first that the American dollar has devalued against all of its peers. The second reason is that the Canadian dollar in terms of purchasing power holds a value of approximately 88 cents US at the time of writing (though this figure is likely to change with the price of oil).8 Although currencies can fluctuate over time the main point is that export policy should not rely on sudden currency depreciation in order to solve the problem. Other avenues for improving the economy’s exports must be explored. The real focus should be placed on improving Canada’s Terms of Trade which is a ratio of the price of exports compared to the price of imports; increases in value demonstrate that our exports are getting more expensive as compared to imports; and a decrease in terms of trade means exports are getting cheaper relative to imports. The Terms of Trade is the long-run determinant of a currency’s value. Graph 4 World Bank Data: Net barter terms of trade index (2000 = 100) 7 National Bank, Financial Markets, Depreciation of Canadian dollar: Lifeline for some manufacturing industries. Viewed at: http://www.nbc.ca/bnc/files/bncpdf/en/2/SpecialReport_E_20140204.pdf 8 Senate of Canada, Report of the Standing Senate Committee on Foreign Affairs, The Rising Dollar: Explanation and Economic Impacts (Volume 2). Viewed at: http://www.parl.gc.ca/content/sen/committee/372/fore/rep/rep06nov03-e.htm. At the time of writing 0 20 40 60 80 100 120 140 G7 Terms of Trade CAN GER FRA UK JPN USA ITA
  • 12. Office of The C. Honourable Hervieux-Payette P.C., Senator 11 Review of FTAs and Trade Policies of Canada 2006 - 2015 As shown by Graph 4, there was an increase Canada’s Terms of Trade since 2001. This increase is unique to Canada as compared to the rest of the G7. Sustained increases to Terms of Trade indicate that the increase in dollar value is not temporary since the exchange rate follows the terms of trade. Most of the G7 experienced a decline in their Terms of Trade meaning that their exports have become cheaper relative to imports. One way of interpreting these results is that Canada’s non-energy exports as compared to the other G7 countries have become less competitive whereas the rest of the G7 have become more competitive. Another interpretation is that Canadian non-energy exports will need to switch from competing on price to competing on quality; meaning that exports will have to deliver their price premium if they are to remain competitive. Regardless there are serious challenges facing non- energy exports, many of which are manufacturing goods produced by medium sized firms. The fate of Canada’s energy exports has yet to be decided, though the result will be lower volumes and revenues from these sectors, resulting in a decline in Canada’s Terms of Trade which will help non-energy exports. As Graph 4 indicates, the experience of the oil price drop in 2009 demonstrates that a major oil price decline is not sufficient to match the devaluation that occurred in the other G7 economies. This means a lower dollar due to the Oil Price Collapse will not result in a massive manufacturing export boom sufficient to rescue Canadians in the short-run. 2.2 The Disappearing Act of Canada’s Exporting Companies During the crisis the Canadian Economy underwent tremendous strains. One area that has yet to fully recover is the number of exporting firms, particularly Mid-sized firms. The number of Mid-sized exporting firms decreased by 17% between 2006 and 2010 and the evidence indicates that this is not temporary. Both Export Development Canada (EDC) and the Business Development Bank of Canada (BDC) conducted studies investigating this decrease and the connection to international trade. Although the EDC report has since been withdrawn officially due to “data concerns”, other findings from the EDC have highlighted the same results concerning Canada’s export performance. BDC analyzed how global competition is transforming the economic environment within Canada.
  • 13. Office of The C. Honourable Hervieux-Payette P.C., Senator 12 Review of FTAs and Trade Policies of Canada 2006 - 2015 Graph 5 EDC, Canada’s Trade Performance 20129 The results of BDC indicate that Canadian Companies are facing tremendous competition from foreign markets. Some exporting firms stopped exporting and concentrated their efforts on domestic pursuits. Many companies identified size as a weakness when facing international competition. Difficulty adjusting to market changes was also identified as a major obstacle. The perspective is that Canada’s Mid-sized exporting firms are having difficulty competing and adapting to the new realities of global competition.10 Regional effects demonstrated that since 2006, 4 out of 5 Regions (BC, Prairies, Quebec and Atlantic) have managed to reverse the trend and increase the number of medium sized firms. Only Ontario registered a decrease during the same time period. The largest drop in Medium-sized firms occurred in the Manufacturing sector. Between the years 2000-2010, manufacturing demonstrated a constant decline of 51% of companies, during the crisis the process accelerated but the overall trend was observed for the entire decade.11 Many of the disappearing Mid-sized firms traded with the United States, whereas companies that have been exporting to emerging markets have in fact grown in number.12 Canadian firms are operating in a different environment; as such they need to upgrade their capabilities in order to successfully compete. Therefore it is necessary for the Federal Government to upgrade its trade facilitation services in order to ensure that Canadian enterprise is capable of prospering in this new environment. 9 EDC Corporate Research Department, Canada’s Trade Performance 2012. Viewed at: http://www.edc.ca/EN/Knowledge-Centre/Economic- Analysis-and-Research/Documents/canadian-integrative-trade-performance.pdf 10 BDC, What’s Happened to Canada’s Midsized Firms 2013. Viewed at: http://www.bdc.ca/EN/Documents/other/BDC_study_mid_sized_firms.pdf 11 BDC, What’s Happened to Canada’s Midsized Firms 2013. 12 CGA 2011, Canada’s Global Trade Agenda: Opportunities for SMEs. Viewed at: http://www.theglobeandmail.com/report-on-business/small- business/article13936900.ece/BINARY/Canada%E2%80%99s+Global+Trade+Agenda%3A+Opportunities+for+SMEs 34000 36000 38000 40000 42000 44000 46000 2000 2001 2002 2003 2004 2005 2006 2007 2008 2009 2010 Number of Canadian Exporting Firms
  • 14. Office of The C. Honourable Hervieux-Payette P.C., Senator 13 Review of FTAs and Trade Policies of Canada 2006 - 2015 2.3 Dutch Disease or Development The Canadian Manufacturing Sector has played a leading role in Canadian exports for decades. However the decline of the sector is often blamed on the natural resource boom. Comparisons with the Dutch economy have become a fashionably simple explanation; because the Dutch oil sector replaced the Dutch manufacturing sector during the 1970s. This is known as Dutch Disease. However, this explanation neglects the fact that all advanced economies have experienced the same decline. As demonstrated by Graph 6, all other G7 economies have experienced a decline in manufacturing. Services have risen to make up the gap in output and employment while the manufacturing output being kept occurs in high service content products. Graph 6 World Bank Data: Share Employment in Industry The recent recession and the commodity boom have been scapegoated for the changes in the manufacturing sector, but the shift started long before the sub-prime crisis. Unemployment in manufacturing has been decreasing since 2002. Better opportunities in natural resource sectors attracted workers within the manufacturing sector. The manufacturing sector was either forced to pay higher wages or innovate and invest in more technology, further reducing the available jobs in the sector. However, manufacturing accounts for the largest share of Canada’s exports, but the sector’s total output is 9% of the Canadian economy.13 Services (both public and private sectors), account for almost 80%. This dominance of services is true for all advanced economies; however their service exports outperform that of Canada’s.14 Another outcome of Canada’s natural resource boom would be 13 Economist Intelligence Unit, Canada Country Report June 2014. Viewed at: http://country.eiu.com/FileHandler.ashx?issue_id=291764413&mode=pdf 14 WTO 2011, Trade Policy Review Canada Report by Secretariat. 0 5 10 15 20 25 30 35 40 45 Manufacturing Share of Employment FRA GER ITA JPN UK USA
  • 15. Office of The C. Honourable Hervieux-Payette P.C., Senator 14 Review of FTAs and Trade Policies of Canada 2006 - 2015 its lagging productivity growth.15 Effectively the Canadian economy relied on commodity price increases and a low dollar to grow as opposed to investing into productivity. The fact that other advanced economies are experiencing the same decline in manufacturing suggests that Dutch Disease does not complete the picture. The missing part of the explanation is known as “structural change”; the process of investing into to technology in order to increase productivity. The determination of which effect is dominant has yet to be decided for the Canadian case.16 What can be observed is that similar economies have experienced a reduction in manufacturing not as a result of a natural resource boom but from emerging markets’ trade and from investments into technology. The “Dutch Disease effect” is likely to phase out over time since it is being driven by a commodity boom; however the “structural shift effect” from new technologies and foreign competition will continue. The situation implies that there is a danger of over investment into natural resources which will not pay off should the boom end. Likewise a full manufacturing recovery cannot be relied on. The real challenge is to adapt to the reality where private sector services and high service content manufacturing will be the main modes of exports for Canada. The question remains of whether or not Canada is up to the task of adjusting. 15 Bank of Canada 2010, The Virtue of Productivity in a Wicked World. Viewed at: http://www.bankofcanada.ca/2010/03/virtue-productivity- wicked-world/ 16 Iscan 2013, Dalhousie University Department of Economics, Windfall Resource Income, Productivity Growth, and Manufacturing Employment. Viewed at: http://myweb.dal.ca/tiscan/research/papers/dutch.pdf
  • 16. Office of The C. Honourable Hervieux-Payette P.C., Senator 15 Review of FTAs and Trade Policies of Canada 2006 - 2015 3.1 Will the New Free Trade Agreements Solve this Problem? In response to the slow pace of the World Trade Organization (WTO) negotiations, many dissatisfied countries are signing new bilateral and regional Free Trade Agreements (FTAs). Since the implementation of North American Free Trade Agreement (NAFTA), Canada now has 11 FTAs with 15 countries at the time of writing.17 The number of countries that will sign FTAs with Canada will exceed 50 over the next decade. Canada will have a vast trade network. This section will be divided into 4 parts; NAFTA and other current FTAs; Comprehensive and Economic Trade Agreement negotiated with the European Union (CETA); Trans Pacific Partnership (TPP); and the remaining FTAs under negotiation.18 The question to be answered is whether or not new FTAs will be sufficient to improve Canada’s export performance. 3.1.1 NAFTA and Other Current FTAs The North American Free Trade Agreement (NAFTA) was a milestone for the participating countries, and as an international benchmark. Negotiated in parallel to the Uruguay Round, the legacy of NAFTA is that it served as a model for many FTAs of many countries and for the multilateral negotiations that led to the creation of the WTO. By initiating a third generation of trade agreements this treaty included the regular tariff reductions and the elimination of national treatment (with exceptions).19 The agreement was the first to incorporate new areas such as market access, rules of origin, intellectual property rights, and foreign investment.20 Graph 7 17 CETA has yet to be passed through Parliament. 18 CETA being the Comprehensive Economic and Trade Agreement between Canada and Europe; TPP being the Trans-Pacific Partnership of the Asia-Pacific Region. 19 The “Generations” of free trade agreements are distinguished from each other based on the content of the treaty which has expanded with every new generation. First generation treaties included industrial products but not agricultural products; second generation treaties included all the areas covered by the first generations and new areas such as intellectual property and trade in goods and services; the third generation expands the content further in investment, regulations and further developed intellectual property rules 20 Congressional Research Service 2014, NAFTA at 20: Overview and Trade Effects. Viewed at: http://fas.org/sgp/crs/row/R42965.pdf 0 50 100 150 200 250 300 350 400 Trade with the United States in Billions CAD Exports Imports
  • 17. Office of The C. Honourable Hervieux-Payette P.C., Senator 16 Review of FTAs and Trade Policies of Canada 2006 - 2015 Data Source: Industry Canada21 The United States remains Canada’s largest trade partner. The bilateral relationship demonstrates that both imports and exports plateaued around the year 2000, prior to that the effects of NAFTA grew both imports and exports. Prior to the treaty Canada was running a surplus with the United States and that the surplus grew until 2000. Since the Sub-prime crisis, imports from the US have begun to set new all-time highs, whereas Canada’s exports to the United States have yet to recover to the pre- crisis level. At the moment the surplus seems to be narrowing, whether or not it will become a deficit would require an in-depth analysis. Focus should be placed on the export plateau which coincides with the start of the Canadian Manufacturing decline. It seems that the trade growth potential delivered by NAFTA may be exhausted due to structural change. As such export growth to the US will be dependent on the value of the Canadian dollar, terms of trade, the growth of the US economy, and the competitiveness of Canadian goods and services. Without improvements on these fronts, the 1990s style export expansion with the US will not repeat itself. Graph 8 Data Source: Industry Canada22 Observing Canada’s trade with Mexico, imports from Mexico were greatly facilitated by NAFTA. Exports also demonstrated an increase over the past 20 years with the ratio of imports to exports within the range of 4-5 times exports (meaning for every 1 dollar of exports there were 4 to 5 dollars of imports). Once again the balance of trade, a deficit, did not change with the treaty. Imports have continued to grow, whereas exports have plateaued post-crisis. The NAFTA treaty did increase Canada’s exports and imports to both countries, however the treaty did not create surpluses or deficits. Instead it magnified both the pre-existing surplus with the United States and the deficit with Mexico. 21 Industry Canada, Online Trade Data. Viewed at: https://www.ic.gc.ca/app/scr/tdst/tdo/crtr.html?&productType=HS6&lang=eng 22 Industry Canada, Online Trade Data. 0 5 10 15 20 25 30 Trade with Mexico in Billions CAD Exports Imports
  • 18. Office of The C. Honourable Hervieux-Payette P.C., Senator 17 Review of FTAs and Trade Policies of Canada 2006 - 2015 Graph 9 Data Source: Industry Canada Table 1 Country FTA Year 2013 Balance 2013 Imports/ Exports Balance Before FTA FTA Balance Change New Balance Post FTA Mexico 1993 Deficit 4.96 Deficit No - USA 1993 Surplus 0.69 Surplus No - Chile 1997 Deficit 2.19 Surplus Yes Deficit Israel 1997 Deficit 2.78 Deficit No - Costa Rica 2002 Deficit 5.14 Deficit No - Iceland 2008 Deficit 1.00 Balanced Yes Deficit Norway 2008 Deficit 1.83 Deficit No - Switzerland 2008 Deficit 2.26 Deficit No - Peru 2009 Deficit 5.07 Deficit No - Colombia 2011 Surplus 0.97 Balanced No - Jordan 2012 Surplus 0.68 Surplus No - Panama 2013 Surplus 0.77 Balanced No - Korea 2014 Deficit 2.10 Deficit - - No Data Available for Liechtenstein (FTA in 2008) ; Data Source: Industry Canada 0 1000 2000 3000 4000 5000 6000 7000 8000 MillionssCAD Trade with Non-Nafta Current FTAs Iceland Exports Iceland Imports Israel Exports Israel Imports Chile Exports Chile Imports Norway Exports Norway Imports Switzerland Exports Switzerland Imports Peru Exports Peru Imports Korea Exports Korea Imports Costa Rica Exports Costa Rica Imports Jordan Exports Jordan Imports
  • 19. Office of The C. Honourable Hervieux-Payette P.C., Senator 18 Review of FTAs and Trade Policies of Canada 2006 - 2015 In order to properly profile the trade balances, a third category of “Balanced” was given to the trade relationships that constantly switch between surplus and deficit. As seen in table 1, countries displaying a Balanced relationship were Colombia, Iceland, Panama and Peru. It should be noted that for the remaining countries, the implementation of a free trade agreement did not change the balance of trade, meaning deficits remained deficits and surpluses remained surpluses. The two exceptions to this rule was Chile were the pre-existing surplus became a deficit with current import to export ratio of 2.19. The Balanced relationship with Iceland developed into a deficit. Although Colombia (FTA in 2011) and Peru (FTA in 2009) do operate currently at a surplus, the long-term relationship of these bilateral trade flows remains Balanced and unchanged. Graph 10 Data Source: Industry Canada23 From examining Canada’s remaining free trade agreements, observations revealed important key facts which are as follows. FTAs do increase both imports and exports. FTAs are not to be solely relied upon to boost exports over imports. FTAs do not reverse the balance of trade; deficits remain deficits and surpluses remain surpluses. The existence of a surplus or deficit is not dependent on an FTA but is dependent on structural issues both inside Canada and the partner country. Export growth is enabled by FTAs but the growth needed to push exports beyond the post-crisis slump and pre-crisis highs requires other policies, programs and changes within the Canadian economy. At present, export growth is more dependent on structural issues than trade diplomacy. 3.1.2 Comprehensive and Economic Trade Agreement (CETA) Just as NAFTA ushered in a 3rd generation of FTAs, CETA is on track to be the first of a 4th generation. Going beyond the depth of NAFTA, CETA will include measures to harmonize regulations and 23 Industry Canada, Online Trade Data. 0 100 200 300 400 500 600 700 800 900 MillionsofCAD Balanced FTA Examples Colombia Exports Colombia Imports Panama Exports Panama Imports
  • 20. Office of The C. Honourable Hervieux-Payette P.C., Senator 19 Review of FTAs and Trade Policies of Canada 2006 - 2015 a strict Investment Settlement Dispute System whereby foreign corporations will have the right to take legal action all signatory governments in the companies believe they have been unfairly treated. There are advocates for and against the agreement, however the concern here is the likely impact on exports. Graph 11 Other Countries: Belgium; Netherlands; Latvia; Malta; Cyprus; Estonia; Greece; Luxembourg; Croatia; Bulgaria; Lithuania; Slovenia; Portugal; Romania; Slovakia; Hungary; Czech Republic; Spain; Denmark; Poland; Finland; Ireland; Austria; Sweden. Data Source: Industry Canada24 Canada and the United Kingdom have established a more liberalized trade relationship which is demonstrated in the UK enjoying the “lion’s share” of the EU’s trade with Canada. Likewise the UK is the only major EU economy with which Canada enjoys a surplus. Canada’s trade balances with the remaining major EU economies are all deficits. Germany in particular demonstrates considerable growth in trade deficits with an import to export ratio that consistently grew from 1.5 in 1993 to 4.4 in 2013. The EU includes another 24 economies of which the majority and overall Canadian trade balances operate at a deficit. Of the 24 only five registered a surplus in 2013. Four of those countries have displayed long term surpluses: Belgium; Cyprus; the Netherlands; and Latvia. The remaining country (Malta) registered a Balanced trade relationship over the past decades. Regardless, Canada has consistently registered a trade deficit with the EU for the past two decades. Since 2011 exports have decreased however imports to the EU have increased. 24 Industry Canada, Online Trade Data. 0 2 4 6 8 10 12 14 16 18 20 BillionsofCAD Trade With the Major CETA Economies UK Exports UK Imports France Exports France Imports Italy Exports Italy Imports Germany Exports Germany Imports Other Exports Other Imports
  • 21. Office of The C. Honourable Hervieux-Payette P.C., Senator 20 Review of FTAs and Trade Policies of Canada 2006 - 2015 Graph 12 Data Source: Industry Canada25 In 2008, Canada and the EU published an in-depth preliminary study (CETA Pre-Study) of the benefits of a free trade agreement. It is this same document that advocates use to justify CETA. The CETA Pre-Study identified that Canada’s trade balance with Europe would be an enlarged deficit after the implementation of CETA.26 Given that all previous FTAs with a pre-existing deficit only increased the size of the deficit, it would seem that the CETA pre-study’s estimates are on par with previous experiences. It must be noted that data used to analyze the benefits of the treaty was from 2004 and earlier. Counting from 2004 the results obtained from the CETA Pre-Study are 11 years out of date. 27 The CETA Pre-Study by virtue of having pre-crisis data ignores: the subprime crisis; the euro crisis; the appreciation of the Canadian dollar; and the structural decline of Canadian manufacturing. The structural change in manufacturing is important because it was in the manufacturing sector that Canada was predicted to experience increases to exports. However, being that the change is structural; the export predictions of the CETA pre-study are likely to have been over estimated. Likewise the estimates for CETA are over-optimistic due to the fact that the CETA Pre-Study assumes that the Doha Multilateral Negotiations of the WTO would be completed in 2014.28 The impact of such an assumption would have permeated into the Canadian-European trade relationship, boosting the results for GDP growth, export gains, employment, etc.; these negotiations are ongoing and have no clear conclusion 25 Industry Canada, Online Trade Data. 26 European Commission, Assessing the Costs and Benefits of a Closer EU-Canada Economic Partnership. Viewed at: http://trade.ec.europa.eu/doclib/docs/2008/october/tradoc_141032.pdf 27 The CETA Pre-Study used the Global Trade Analysis Project (GTAP) 7 Model’s database; at the time the pre-study was published the most recent data used by GTAP 7 was from 2004. Viewed at : https://www.gtap.agecon.purdue.edu/databases/v7/default.asp 28 European Parliamentary Research Service Ex-Ante Impact Assessment Unit, Detailed Appraisal by the EP Ex-ante Impact Assessment Unit of the European Commission’s Impact Assessment EU-US Transatlantic Trade and Investment Partnership. Viewed at: http://www.europarl.europa.eu/RegData/etudes/etudes/join/2014/528798/IPOL-JOIN_ET(2014)528798_EN.pdf 0 10 20 30 40 50 60 Trade With the EU in Billions CAD Exports Imports
  • 22. Office of The C. Honourable Hervieux-Payette P.C., Senator 21 Review of FTAs and Trade Policies of Canada 2006 - 2015 date. Finally the often reported 80 000 new jobs was not a finding of the CETA Pre-Study. The only source substantiating the 80 000 jobs found by this review is the testimony of the Minister of Trade during the House Standing Committee on International Trade meeting in 2012 and its subsequent report.29 To date this review has been unable to find any documentation to verify the claim of 80 000 new jobs. Therefore CETA Pre-Study should not at all be used for the assessment of CETA (See Appendix 1 for the full analysis). 3.1.3 Trans Pacific Partnership The Trans-Pacific Partnership (TPP) encompasses 12 countries throughout the Asia-Pacific region.30 Upon completion, TPP will provide new market access for goods and services, enforceable labour standards and environmental commitments, rules on state-owned enterprises, and an intellectual property rights framework. TPP will include transparency commitments for regulations which will enable small and medium-sized businesses to benefit.31 Since Canada’s trade relationship with Chile, Mexico, Peru and the United States were previously examined; this section will focus only on the TPP countries that do not have an FTA with Canada. Graph 13 Data Source: Industry Canada32 Japan’s economy has suffered the diagnosis of “The Lost Decade” for almost 20 years. Inflation and economic growth have been low over this period of time.33 The policies of the new Japanese Prime 29 Parliament of Canada Report of the House Standing Committee on International Trade, Negotiations Toward a Comprehensive Economic and Trade Agreement (CETA)Between Canada And The European Union. Viewed at: http://www.parl.gc.ca/content/hoc/Committee/411/CIIT/Reports/RP5431905/CIITrp01/ciitrp01-e.pdf 30 TPP nations are Australia, Brunei Darussalam, Canada, Chile, Japan, Malaysia, Mexico, New Zealand, Peru, Singapore, Vietnam, and the United States. 31 USTR TPP. Viewed at: http://www.ustr.gov/tpp 32 Industry Canada, Online Trade Data. 0 2 4 6 8 10 12 14 16 18 Trade With Japan in Billions CAD Exports Imports
  • 23. Office of The C. Honourable Hervieux-Payette P.C., Senator 22 Review of FTAs and Trade Policies of Canada 2006 - 2015 Minister Abe have yet to demonstrate their long–term benefits. With the signing of an FTA between South Korea and Canada, Japan recently announced an interest in an FTA with Canada. As demonstrated by Canada’s Exports and Imports to Japan over the past 20 years; the impact of the Multilateral Liberalization from the Uruguay Round (1994) facilitated Japanese expansion into the Canadian market (Graph 13). Canadian exports to Japan deteriorated after 1995 and have yet to recover to the high set in the early 1990s. Japanese exports to Canada deteriorated in the wake of the Dot-com Bubble of 2001 and after the Sub-prime crisis of 2008 after which they partially recovered. However the Japanese exports to Canada never fell below the 1995 level. Given the past experience of FTAs maintaining the pre-existing deficit or surplus, the trade balance with Japan will likely remain a deficit with TPP. Graph 14 Data Source: Industry Canada34 With the exception of Brunei Darussalam, Canada operated at trade deficit with all remaining TPP countries in 2013. Before 2011, Canada did enjoy a trade surplus with Australia, and Canada’s trade relationship with New Zealand is relatively balanced. Canada has large deficits with Malaysia, Vietnam and Singapore; though the trade gap with Singapore has been narrowing over time. In aggregate, 33 UK House of Commons Library, Japan’s economy: from the “lost decade” to Abenomics. Viewed at: www.parliament.uk/briefing- papers/SN06629.pdf 34 Industry Canada, Online Trade Data. 0 0.5 1 1.5 2 2.5 3 3.5 BillionsofCAD Trade With TPP Countries Without FTAs Brunei Darussalam Exports Brunei Darussalam Imports New Zealand Exports New Zealand Imports Australia Exports Australia Imports Singapore Exports Singapore Imports Malaysia Exports Malaysia Imports Vietnam Exports Vietnam Imports
  • 24. Office of The C. Honourable Hervieux-Payette P.C., Senator 23 Review of FTAs and Trade Policies of Canada 2006 - 2015 Canada has operated at a continuous and uninterrupted trade deficit with these TPP nations for over 2 decades with an import to export ratio of 1.82 for 2013. Graph 15 Data Source: Industry Canada35 3.1.4 The Remaining FTAs under Negotiation With the exception of the Ukraine, Canada’s remaining potential FTA partners are all within the region of the Americas: The Dominican Republic; Guatemala; Honduras; and Nicaragua.36 Although the trade relationship with the countries on a whole remained at a stable deficit with an import to export ratio around 1.5; since the Sub-prime Recession, Canada’s imports from these countries has grown. The same growth was not repeated in Canada’s exports to these countries (Graph 16). Graph 16 35 Industry Canada, Online Trade Data. 36 Since the time of writing, the Honduras FTA has been ratified. 0 1 2 3 TPP Import/Export Ratio With Japan Without Japan 0 1 1 2 2 3 Trade with Other Pending FTAs in Billions of CAD Total Exports Total Imports
  • 25. Office of The C. Honourable Hervieux-Payette P.C., Senator 24 Review of FTAs and Trade Policies of Canada 2006 - 2015 Data Source: Industry Canada37 Trade negotiations with the Ukraine were recently announced, which is the only remaining country where Canada registered a trade surplus in 2013. In the same year Canada had deficits with the remaining countries. As demonstrated in Graph 17, the ratio of imports to exports was stable until 2008. Post-2008 the import to export ratio increased dramatically. As such it would seem that these economies have become more competitive in the wake of the Subprime Crisis. Using past FTA experience, and the increasing deficit, it can be assumed that FTAs with these countries will not yield surpluses. Graph 17 Data Source: Industry Canada38 3.1.5 At Best Necessary but not at all Sufficient Drawing from Canada’s previous experience, FTAs do not reverse trade deficits into surpluses. Export growth is enabled by FTAs but not to the level necessary to correct Canada’s current slump in export growth which is a structural problem. As demonstrated above Canada’s import to export ratios with the various countries or regions considered for FTAs either have increased (meaning more imports than exports) or have remained relatively constant. The observation of a falling import to export ratio would be the proof needed to conclude that new FTAs will solve the export slump. This has been observed with some countries in the EU but the EU as a whole displays a relatively constant Import to Export ratio between 1.4 and 2.1. As such export growth is more of an internal problem than an FTA market access issue. The evidence from Canada’s current and future FTAs indicates that FTAs are at best necessary but not sufficient to reverse the export slump. The real issue is within Canada’s internal capacity to compete globally independent of FTA access to foreign markets. It should be noted that Canada registers large surpluses only with English speaking countries (United Kingdom; the United States; and for a while Australia), as such part of the problem might be that Canadian businesses are not comfortable selling to non-Anglo cultures. 37 Industry Canada, Online Trade Data. 38 Industry Canada, Online Trade Data. 0 2 4 6 Other FTA Import/Export Ratio Import/Export
  • 26. Office of The C. Honourable Hervieux-Payette P.C., Senator 25 Review of FTAs and Trade Policies of Canada 2006 - 2015 4.1 The Federal Trade Facilitation Services Performance Canada has embarked on a tremendous market access program by announcing new Free trade agreements, Foreign Investment Protection Agreements (FIPA) and other such trade related treaties; attention needs to be turned towards the current trade facilitation policies. Canada has extensive trade agencies which span many organizations with specific mandates to facilitate trade, and domestic economy oriented organizations that have begun to provide trade services as well. There is significant amount of overlap between the organizations. Although a more extensive analysis should be conducted organization by organization, an analysis of the trade facilitation framework should provide valuable insights into policy strengths, shortcomings and possible solutions. Table 2 Services Offered EDC CCC BDC TCS Start up Financing Yes Export Financing Yes Yes Foreign Market Analysis Yes Yes Yes Foreign Contact Services Yes Yes Yes Political Relationships Yes Government Procurement Yes 4.1.1 Export Development Canada (EDC) EDC operates under the Minister of International Trade with a broad mandate to support and develop Canada's exports, capacity to engage in trade and ability to capitalize on international opportunities. This mandate requires EDC to work closely with the Trade Commissioner Service (TCS) in areas such as training programs, market research and developing overseas opportunities. EDC acts as a complement to the activities of financial institutions, by providing tailored financing to mature businesses; the organization is financially self-sustaining, operates on commercial principles, and charges interest on its loans and premiums on its insurance products.39 EDC's trade finance and risk services are intended to address gaps where the private sector is unable to meet the needs of Canadian businesses. Service eligibility is conditional on the transaction's potential benefits. EDC may borrow from the commercial market by means of a government guarantee or from the Consolidated Revenue Fund by submitting a request to the Minister of Finance. In the event of a transaction exceeding EDC’s risk appetite; it can be administered through the Canada Account on behalf of the Federal Government if the Minister of International Trade considers the transaction to be national interest. 39 WTO, Trade Policy Review Report by Secretariat 2011.
  • 27. Office of The C. Honourable Hervieux-Payette P.C., Senator 26 Review of FTAs and Trade Policies of Canada 2006 - 2015 Table 3 EDC Canadian Benefits Scorecard Year 2009 2010 2011 2012 2013 2014 Business Facilitated ($B) 82.8 84.6 102.8 87.4 95.4 98.9 Exports Facilitated (%) 20.6 19 19 NR NR NR SMEs Served 6886 6628 5872 5807 5517 6088 Business in Emerging Markets ($B) 18.7 24.7 31.2 26.52 $27.30* 28.9 Share of Total Business Facilitated 22.58% 29.20% 30.35% 30.34% 28.62% 29.22% Contribution to GDP ($B) 61 63.4 70.5 52.7 61.9 68 Contributions to GDP (%) 5% 4.9% 5.1% 2.9 4% 3.85% Jobs Supported 642,465 627,704 707,287 573,773 568,799 719,200 Share of National Employment (%) 3.80 3.70 4.10 3.27 3.20 4.03 NR - Not Reported, Numbers in bold have been derived from Statscan and EDC data. *Customers’ business in emerging markets figure Data taken from EDC annual reports 2012 and 2013 and the EDC Corporate Plan 2013-2017 Numbers appearing in red font display significant flaws. As shown in the Table 3, Employment facilitated by EDC decreased by approximately 140 000 jobs from 2011 to 2013, a 20% decline. For every observation in 2013; all categories were below their 2011 level. Only Total Business Facilitated, Business in Emerging Markets and Contributions to GDP have demonstrated a reversal yet they remain below the 2011 level. The number of SMEs has decreased in line with the trend identified by EDC of fewer exporting SMEs in the economy. The decline in emerging markets indicates that EDC facilitation is increasing its reliance on advanced economies such as the United States. There is a cause for concern regarding Canada’s ability to use trade facilitation to tap into growth in emerging markets. EDC did successfully meet its self-established objectives for 2013. However, EDC has been unable to reverse the impact of the global forces with regards to the economic benefits of EDC’s operations. In 2013, EDC supported over 7000 companies, between 15-18% of the total population of exporting firms.40 The organization also highlighted the fact that 77% percent of these companies were SMEs. These SMEs exported $ 11.6 Billion; accounting for 12% of total business facilitated by EDC. This means that large corporations (a minority of 23% of companies’ facilitated by EDC) accounted for 78% of EDC’s total business facilitated in 2013. EDC claims to have increased the amount of facilitation to emerging markets by 8%; however the total value of business facilitated in emerging markets was reported at $ 528 million. This differs from the previously reported $ 31.2 billion for Business in 40 Data on the number of firms has been pulled by Statscan. The ten year high of the population was set in 2006 at 44 823 companies; the ten year low occurred in 2010 at 38 456 companies.
  • 28. Office of The C. Honourable Hervieux-Payette P.C., Senator 27 Review of FTAs and Trade Policies of Canada 2006 - 2015 Emerging Markets in 2011.41 In 2012, the definition of Business in Emerging Markets was changed to Accounting Revenue. EDC did report in 2013 that “customers’ business in emerging markets reached $27.3 billion in exports and investments” and it also reported a decrease of 15% in 2012. Using these figures an increase of only 2.94% can be estimated, 5% below the claimed 8%; the only way EDC may have arrived at an 8% figure is by using the revenue for Emerging Market services for both 2012 and 2013, however it should have provided both figures in the 2013 Annual Report. When measured against revenue, Business in Emerging Markets accounts for roughly 41% of EDC’s Total financing and investment revenue of 1.275 Billion. It seems counter intuitive to continue the use of Value of Business Conducted by EDC customers for the total measure given the possibility that some degree of the activity would have occurred without EDC support; the other trade facilitation organizations may have also played a role, as such there is a degree of double counting. Reporting these figures undermines the public’s ability to assess the benefits and the success of these activities making the process of reporting and monitoring pointless. Emerging Market Revenue should be stated as such in order to avoid confusion. These statistics provide more of an insight into the current challenges being faced by Canadian companies than EDC’s performance. 4.1.2 EDC’s Super-Natural Jobs Facilitation for 2014 A few weeks prior to the publishing date of this review, EDC released its annual report for 2014. The EDC 2014 Annual Report provided the 2014 economic performance indicators. With the exception of two performance indicators, the results proved that EDC is still struggling to reclaim much of its success in previous years. The statistic that this review takes issue with is the Jobs Facilitated (which was renamed “Helped Sustain”) result of 719 200; which was an annual increase of 26%. No other performance indicator grew so much. EDC could make the argument that the 10% increase to SMEs was responsible; however if this was the case then EDC’s GDP impact should have grown as well. Table 4 EDC Results 2013 2014 Change Percentage of GDP Facilitated 4.00% 3.85% Decrease Percentage of Jobs Facilitated 3.20% 4.03% Increase Data Source: EDC Annual Reports 2013 and 2014 Having EDC’s GDP and Labour facilitation move in opposite directions is impossible given the current economic situation. According the Labour Force Survey, Canada added only 121 000 jobs in 2014, meaning the increase to EDC’s Job indicator is 124% of the Canada’s total job growth in 2014.42 41 EDC 2013, EDC 2013-3017 Corporate Plan. Viewed at: https://www.edc.ca/EN/About-Us/Corporate-Reports/Documents/corp-plan-summ- 2013-2017.pdf 42 EDC, Annual Report 2014. Viewed at: http://www19.edc.ca/publications/2015/2014ar/en/15.shtml
  • 29. Office of The C. Honourable Hervieux-Payette P.C., Senator 28 Review of FTAs and Trade Policies of Canada 2006 - 2015 Further analysis and scrutiny of these numbers must be undertaken. Until such a time that an appropriate explanation is provided, the 2014 Economic Performance Indicators of EDC should not be used for purposes of policy decisions. 4.1.3 Canadian Commercial Corporation (CCC) Canadian Commercial Corporation’s (CCC) mission is to provide Canadian exporters access to foreign public-sector markets by means of government-to-government contracting and procurement processes supported by measures such as performance guarantees. CCC also facilitates Canadian sales to overseas private-sector buyers. CCC's activities are funded by a mix of parliamentary appropriations and service fees. CCC’s core business line was the Canada-U.S. Defence Production Sharing Arrangement (DPSA). By providing government-backed guarantees for contract performance, the need for equivalent instruments from financial institutions is eliminated. CCC can assume part of the accounts receivable risk by serving as an intermediary. Table 5 CCC Performance Indicators Year 2010-11 2011-12 2012-13 2012-13 Targets Value of contracts signed ($M)43 1600 1800 1000 1500 DPSA business line ($M) 1400 1500 577 1200 GDS business line ($M) 70 32.7 138.4 102.4 ICB business line ($M) 10 169.3 169 167.6 Cuba Contracting ($M) 48.3 68.4 39 60 Procurement services ($M) 28.3 8.2 17.2 30 Fees for services ($M) 12.9 12.7 15.2 14.3 Number of Canadian Exporters with contracts via CCC ($M) 12.9 218 210 200 Number of countries with contracts and/or pursuits ($M) 68 54 72 60 Contract remediation ($M) -1 0.052 0 0.1 Data taken from CCC Annual Report 2013 As shown in Table 5, the value of contracts signed decreased by 37.5% for 2010 to 2013 contracts were 33% below target in 2011. Much of this decline can be explained by changes in the foreign public sector. As stated above, the DPSA was the core component of CCC’s business but the budget cutbacks in the United States has resulted in fewer contracts and increased competition from American firms. In response CCC has begun to diversify its efforts away from the United States. The reality of this is that the organizations that depended on these contracts will have to adapt to markets 43 Defence Production Sharing Agreement (DPSA; Global Defence and Security (GDS); and International Commercial Business (ICB).
  • 30. Office of The C. Honourable Hervieux-Payette P.C., Senator 29 Review of FTAs and Trade Policies of Canada 2006 - 2015 that do not share the same cultural and economic similarities of the United States. International Commercial Business has demonstrated tremendous growth, though not enough to offset the losses. Although CCC has openly acknowledged the situation, greater cohesion with the other trade services providers will be needed for Canadian Businesses to continue to secure government procurement contracts abroad.44 4.1.4 Business Development Bank of Canada (BDC) The Business Development Bank of Canada (BDC) also supports Canadian firms that wish to expand globally within its general mandate of business development. At end 2010 it had 5,600 clients that generated Can$22.3 billion in export sales.45 BDC services are geared towards start up and international expansion. Beyond that point it seems that companies will have to solicit the services of the other organizations. Table 6 BDC Export Performance Indicators Year 2010 2011 2012 2013 Exporting Clients 5600 5300 4900 4700 Export Sales ($B) 22.3 21.6 22.7 21.9 Data from WTO Trade Policy Review of Canada 2011,and the Library of Parliament BDC provides financing for exploration of international opportunities, as well as funding for SMEs establishing a foothold in a foreign market. BDC also provides consulting services in the areas of global competitiveness assessment and international business development planning either directly or in partnership with the Forum for International Trade Training and the Department of Foreign Affairs and International Trade. BDC clearly articulates its role and challenges within the global context; it also constantly discusses how the global economy is impacting the private sector. It monitors the export performance of its clients and records the number of exporting BDC clients, which has decreased by almost 20%. Export sales have also experienced a decrease. This suggests that SME clients of BDC have made up the reduction in exporting firms. BDC is the only organization that is not under the Ministry of Trade and yet it clearly articulates its international role and impact. BDC’s strategic direction is well formulated within the context of current global challenges. 4.1.5 Trade Commissioner Services (TCS) The Trade Commissioner Service (TCS) is the Federal government’s network of international trade professionals. TCS promotes Canadian trade interests abroad by assisting companies to export, invest, and innovate. Export promotion constitutes the main line of operations however science and technology, and investment are part of their offered services. TCS network claims to have over 150 overseas locations; however some office locations are actually responsible for multiple countries as such 44 CCC Annual Report 2012-2013. Viewed at: http://publications.gc.ca/site/eng/457449/publication.html 45 WTO, Trade Policy Review Canada Report by Secretariat 2011.
  • 31. Office of The C. Honourable Hervieux-Payette P.C., Senator 30 Review of FTAs and Trade Policies of Canada 2006 - 2015 there is a lot double counting in this figure. TCS activities are funded by the DFATD budget which is subject to "value for money" assessments over a five-year cycle. A recent study released by the Canadian Chamber of Commerce identified 8 major barriers and provided an additional list of the appropriate policy lever to overcome the identified obstacle. Of the 8 identified policy levers, 5 of them fall under the mandate of the Trade Commissioner Services.46 The report establishes that there is considerable lack of synergy and coordination within the Federal Trade Facilitation Services. As noted before, the Trade Commissioner Services database is only made up of 20 000 companies, half of the total number of Canadian companies that are active exporters. TCS does not keep track of the number of exporting clients, claiming that TCS clients are not tagged according to whether the client was an exporter, according the Parliament Library of Canada; despite claiming that exports constitute their main line of their operations. Other programs such as the Global Opportunities for Associations provides over $3 million to national associations for trade development activities and is the TCS main outreach method for export promotion and encouragement to businesses within Canada. The amount given to any association never exceeded $150 000.47 Given the chosen method of interacting with Canadian businesses, the funds provided, and the size of the of the associations’ membership, it is possible that the impact of such engagements may either be inadequate or compromise the program’s goals due to limited resource being spread too thinly. Further analysis is required with particular emphasis on this program’s ability to encourage SMEs to engage in international trade activities. TCS used to have an online portal, the Virtual Trade Commissioner, which provided companies personalized access to over 1,000 trade professionals. However, the portal has been shut down.48 An empirical study of Canadian exporters of manufactured goods, spanning 1999-2006, found that TCS assistance had a positive impact on its clients' performance, both in terms of export value and market diversification; however they also stated that the services were more frequently used by larger organizations.49 Given the fact that experience and size with TCS seem to play a large role regarding use, one could infer that it may take companies some time to learn about TCS services and time to understand how to access and implement those services properly into their regular business operations. It also means that the cost to hire or designate resources to apply for TCS policies and programs is too expensive for some SMEs. Conducting an assessment of this fact in a more depth analysis is required. 4.2 Trade Performance Score The impact of global changes, a high currency value, and higher levels of competition have all struck home within the Federal Trade Facilitation Services. One of the challenges that appear to be giving the government and the private sector trouble is switching from exporting to advanced economies (such as the EU and the United States) to exporting to developing countries and emerging 46 The Canadian Chamber of Commerce 2014, Turning it Around: How to Restore Canada’s Trade Success. Viewed at: http://www.chamber.ca/download.aspx?t=0&pid=b06a4f25-bbd7-e311-93a5-000c29c04ade 47 TCS website: http://www.tradecommissioner.gc.ca/eng/funding/home.jsp#GCSP 48 TCS website: http://www.tradecommissioner.gc.ca/eng/tcs.jsp 49 Van Biesebroeck, Johannes, Emily Yu and Shenjie Chen 2010, The impact of trade promotion services on Canadian exporter performance. Viewed at: http://www.international.gc.ca/economist-economiste/assets/pdfs/research/T PR_2010/Chapter5-eng.pdf..
  • 32. Office of The C. Honourable Hervieux-Payette P.C., Senator 31 Review of FTAs and Trade Policies of Canada 2006 - 2015 markets. Another problem is there seems to be a significant lack of coordination between the various organizations. Finally the results of SMEs and emerging market interactions are not encouraging. Proper policies should be developed to confront the obstacles preventing medium sized firms from exporting and from growing. On a whole there is cause for concern and there is ample reason rethink Canada’s Federal Trade Facilitation Strategy, which is necessary for Canadians to benefit from the new Free Trade Agreements being announced, signed and implemented on their behalf by DFATD. Canada’s trade facilitation agencies need to be structured to confront today’s challenges and opportunities.
  • 33. Office of The C. Honourable Hervieux-Payette P.C., Senator 32 Review of FTAs and Trade Policies of Canada 2006 - 2015 5.1 Canada’s Export Network and Provincial Trade Promotion The various organizations of the Department of Foreign Affairs, International Trade and Development are not the only Canadian public entities that represent Canadians abroad for the purposes of trade promotion. Many provinces conduct their own trade promotion programs, including the establishment of offices abroad, grant funding, market intelligence and other financial support. For the purposes of this report, only Alberta, British Columbia, Ontario and Quebec were examined, this is due to the fact that these are the four largest provincial economies. The purpose of this assessment is to profile their priority markets and the various policy and programs that are used to promote trade at a provincial level. Table 7 Provincial Trade Offices and Representatives Abroad Country Alberta B. C. Ontario Quebec Total China Yes Yes Yes Yes 4 India Yes Yes Yes Yes 4 Japan Yes Yes Yes Yes 4 United Kingdom Yes Yes Yes Yes 4 United States of America* Yes Yes Yes Yes 4 Germany Yes Yes Yes 3 Brazil Yes Yes 2 Hong Kong, SAR* Yes Yes 2 Korea, Republic Yes Yes 2 Mexico* Yes Yes 2 Singapore Yes Yes 2 United Arab Emirates Yes Yes 2 Totals 11 7 10 19 47 Countries where there are less than two provinces Argentina (Q), Burkina Faso (Q), Chile (On)*, France (Q), Italy (Q), Morroco (Q), Poland (Q), Romania (Q), Russia (Q), Senegal (Q), Taiwan (A), Turkey (Q), Ukraine (Q), Vietnam(Q). *Free Trade Agreement The four largest provinces operate 47 offices that span Africa, Asia, Europe and South America. This includes advanced economies, emerging markets and developing countries. There are five countries where all four provinces are present. Three of these countries are China, India and Japan which indicate that presence in Asian economies of importance is a priority for all four provinces. The remaining two economies are largest English speaking economies, the United Kingdom the United States. The reverse is not observed in France where only Quebec has established a presence. South America and Africa seem to be the least important. Finally the four Asian Tiger Economies which operate as hubs for international
  • 34. Office of The C. Honourable Hervieux-Payette P.C., Senator 33 Review of FTAs and Trade Policies of Canada 2006 - 2015 activity only seem to be a priority for Alberta and British Columbia.50 It would be interesting to assess and compare the results of offices and representatives located in global hubs versus offices located in large or emerging economies. Finally it should be noted that the Trade Commissioner Service has representation in every country that is listed above. 5.1.1 Alberta The Government of Alberta provides international and intergovernmental relations with regards to international export development and investment. The services provided include: market intelligence to “export ready” Albertan companies; networking and contact information; assistance in foreign market access; investment promotion; and showcasing of Albertan products and services. Alberta maintains 13 international offices that are responsible for advancing advocacy, trade promotion, and investment.51 These foreign offices’ mandates are tailored depending on Alberta's priorities within an individual office’s region. Their office in Washington Office focuses on advancing Alberta’s policy interest in the United States. The remaining international offices focus on trade promotion and investment attraction in energy, tourism, agriculture, education and advanced industries. In addition these offices offer support to Albertan businesses aiming to globally expand. These offices work in conjunction with Alberta.52 Graph 18 Data Source: Industry Canada53 Until the recent events of the global oil price decline, whose impacts have yet to be completely assessed, Alberta was the only large province that enjoyed a trade surplus as of 2013. However in 2004 50 The Four Asian Tiger Economies are: Hong Kong; Singapore; South Korea; and Taiwan 51 Alberta has 3 separate offices across the United States, while the remaining 9 offices are all in different countries. 52 Government of Alberta International and Intergovernmental Relations online information, viewed at: http://www.international.alberta.ca/954.cf 53 Industry Canada, Online Trade Data. 0 20,000 40,000 60,000 80,000 100,000 120,000 Alberta Alberta Exports Alberta Imports Alberta Energy Exports
  • 35. Office of The C. Honourable Hervieux-Payette P.C., Senator 34 Review of FTAs and Trade Policies of Canada 2006 - 2015 Alberta Energy exports represented 66% of total exports, this level of dependence climbed to 74% by 2013. It should be noted that by removing Alberta’s energy exports from the total, the province operates at a trade deficit. This deficit has constantly grown over the past decade. By 2013, Albertan exports had yet to fully recover to the level set in 2008. Given the collapse of the oil price in 2014, it is unlikely that this 2008 high was surpassed or will be achieved in the near future. Alberta’s largest challenge over the coming years in terms of exports will be to diversify away from energy. 5.1.2 British Columbia British Columbia’s international trade strategy is divided between export promotion services and foreign investment attraction. To companies based in British Columbia it provides the following services: Market intelligence; strategic consulting for international expansion; network contacts; Legal, Financial and other trade services as well as referrals to a range of service providers; Trade missions and events hosting; and finally seminars and training services. With regards to attraction investment, provided services include: Local market intelligence and information; customized and confidential project analysis; introductory briefings: site tours; investigations of facilities and meetings with community leaders; networking of local business contacts; and assistance in accessing federal, provincial and local government programs. Of the four largest provinces, BC maintains the fewest foreign offices, with an unsurprising focus on the Asian-Pacific region.54 Graph 19 Data Source: Industry Canada55 Of the four largest provinces, BC is the only province where Exports surpassed their pre-crisis level by the end of 2013. However, starting in 2005 and continuing until 2009, BC exports experienced a decline of 27%. Exports in 2013 were unable to surpass the 2005 high. Imports have decreased as a 54 Trade and Invest British Columbia online information, viewed at: http://www.britishcolumbia.ca/export/index.aspx 55 Industry Canada, Online Trade Data. 0 5,000 10,000 15,000 20,000 25,000 30,000 35,000 40,000 45,000 50,000 British Columbia BC Exports BC Imports
  • 36. Office of The C. Honourable Hervieux-Payette P.C., Senator 35 Review of FTAs and Trade Policies of Canada 2006 - 2015 result of the economic crisis and resumed their growth post-crisis. Energy, natural resources, lumber and other lumber based products were largest exporting sectors.56 Although the end of the energy boom will also have an impact on BC’s exports, the province is not as dependent on energy as Alberta. 5.1.3 Ontario Of the four largest provinces, Ontario features the most ambitious international trade program. Although it has only established offices in 10 countries, services and programs offered by the provincial government go beyond market intelligence and aid in accessing federal services. As articulated in the Provinces “Going Global Strategy”, Ontario’s policies have the following objectives: increasing the number of exporting companies; and enable global expansion of Ontario based companies.57 Services offered by the Ontario government include: market intelligence, skills development and training; market and export consulting; and trade missions. Ontario also maintains a “Global Growth Fund” that is administered by the Ontario Chamber of Commerce. This fund finances two programs. The first is the Export Market Access Program designed to cover the direct costs of developing international markets. The second program is the Ontario Exporter Fund which covers the cost of hiring export managers for a full 2 years. There also a heavy emphasis on enabling Small and Medium enterprises to export. This includes a serious effort to streamline resources in an effort to minimize the time and costs to access foreign markets for SMEs. This streamlining process includes improving collaboration between commercial groups (such as the Ontario Network of Enterprises), federal, provincial and municipal governments. Graph 20 Data Source: Industry Canada58 56 Library of Parliament 2013, British Columbia’s Merchandise Trade with the World. Viewed at: http://www.parl.gc.ca/Content/LOP/ResearchPublications/2013-31-e.pdf 57 Government of Ontario, Going Global Trade Stategy. Viewed at: https://dr6j45jk9xcmk.cloudfront.net/documents/665/tradestrategy-en.pdf 58 Industry Canada, Online Trade Data. 0 50,000 100,000 150,000 200,000 250,000 300,000 Ontario Ontario Exports Ontario Imports
  • 37. Office of The C. Honourable Hervieux-Payette P.C., Senator 36 Review of FTAs and Trade Policies of Canada 2006 - 2015 For the past decade, Ontario has operated at a continuously growing trade deficit. Given the decline in Ontario’s manufacturing sector, it is likely that this trade deficit is structural. Imports to Ontario did experience as decline as a result of the recession though they have since surpassed their pre-crisis high. Unfortunately the same cannot be said for Ontario’s exports. Exports did decline but have yet to recover to their pre-crisis high. It should also be noted that prior to 2007, growth in Ontario exports was almost non-existent. As such the structural shift away from manufacturing seems not to have been caused by the crisis but only accelerated by it. 5.1.4 Quebec Export Quebec, a department of the Ministry of the Economy released in October 2013 a Trade Development Plan Outside 2013-2017, targeted at reducing Quebec’s international trade deficit. It aims at boosting exports, consolidating traditional markets, the developing of new markets and encouraging companies to become exporters. The plan is based on four main objectives namely: to provide services and facilitate access markets; prepare companies for global markets; support business abroad; and promote the strengths of the Quebec economy.59 Export Quebec offers many services meant to reduce the time, cost, and export risks. These services include market intelligence, consultations and network services, trade shows and financial support. Currently Export Quebec is revising their export programs and receipts of applications have been suspended.60 Graph 21 Data Source: Industry Canada61 Quebec’s trade balance was operating at a declining surplus prior to the economic crisis; the trade balance became a deficit during the crisis and continues to operate at this balance. Exports 59 Export Quebec, online information viewed at: http://www.economie.gouv.qc.ca/objectifs/exporter/outils/ 60 Export Quebec, online information viewed at: http://www.economie.gouv.qc.ca/objectifs/exporter/services/programmes-daide/programme- exportation/ 61 Industry Canada, Online Trade Data. 0 10,000 20,000 30,000 40,000 50,000 60,000 70,000 80,000 90,000 Quebec Quebec Exports Quebec Imports
  • 38. Office of The C. Honourable Hervieux-Payette P.C., Senator 37 Review of FTAs and Trade Policies of Canada 2006 - 2015 seemed to have stagnated from 2004 to 2007. Exports then fell in 2009 and have yet to fully recover to the level set in 2007 or the all-time high achieved in 2006. Imports experienced strong increase from 2004 to 2007, they then fell and have been steadily recovering since the recession. As of 2013 exports seem to be slowly recovering at the same stagnant pace witnessed before the recession. This suggests that although the recession decreased exports, growth was already a problem prior to the recession. This further suggests that the problems being faced by the Quebec economy in relation to export growth are structural and not cyclical. 5.2 Overall Provincial Performance Of the four largest provinces in Canada, not a single one has been able to surpass the pre- recession high set in exports. Export decline in Quebec and British Columbia started prior to the recession, and Ontario experienced stagnant growth pre-recession. Alberta’s non-energy exports experienced declines prior to recession while energy based exports grew at a tremendous pace. At the time of writing Alberta’s energy exports are decreasing due to a collapse in oil prices, the full impact has yet to be assessed. What is clear from these findings is export growth is not just a cyclical problem. There are structural issues that must be resolved at the provincial level. Commonalities in the approaches of the provincial governments have adopted creates room for the development of national project or program. All four major provinces operate foreign offices, provide market intelligence, etc. Many of these services are also provided by the Federal Government. In other areas where there are differences between approaches, comparisons could be done in order to determine whether or not these policies should be replicated. Only Ontario and Quebec have dedicated SME trade programs listed on their websites. The Quebec program is a series of partnerships with international cities and partners and it is promoted as an additional component. This contrasts with the approach taken by Ontario which advertises a SME program that is integrated as a core part of not only the trade promotion policies but of Ontario’s overall economic strategy. As such it seeks to get exporting SMEs to work in conjunction with the rest of the Ontario system. Creating an integrated National Program that is capable of enabling SMEs to operate in global markets may be one of the few ways to re-start stagnate export growth that is affecting all four provinces. A national program would allow for assessment of the best practices and replication amongst not only the four largest provinces but of all provinces and territories in Canada.
  • 39. Office of The C. Honourable Hervieux-Payette P.C., Senator 38 Review of FTAs and Trade Policies of Canada 2006 - 2015 6.1 Strategic Analysis and Policy Recommendations Canada’s trade situation and its trade facilitation services do not exist within an encouraging picture. Many changes have impacted Canada’s exports: Subprime-crisis and recession; Euro crisis; and the rise of Asia and other emerging markets. The question must be asked whether or not the government organizations responsible for facilitating trade are flexible enough to cope with the situation. The answer is not in the current format. Within the current times of globalization, the differences between trade and the domestic economy are evaporating at an alarming rate. Trade now represents at integral component to the domestic economy. The government should recognize this both in terms of the services and in terms of private sector policy. 6.2 Better Coordination between Foreign and Domestic Commercial Development In order to address problems within the Federal Trade Facilitation Strategy, the government should consider placing all trade facilitation agencies under a single ministry. As discussed in this report there is a lack of coordination. The number of organizations and their specific functions may act as an obstacle due to the fact that considerable knowledge is needed to understand every organization and their services; this complexity may confuse entrepreneurs. One way of dealing with the complexity, overlap and lack of coordination would be to place EDC, TCS and CCC all under the Ministry of Industry with BDC. Highly competitive countries such as Germany, Singapore, Hong Kong, and Japan do not have separate ministries for trade and industry; instead they ensure domestic and international cohesion by having a single ministry. The gains made from having all services under one ministry will enable efficient use of resources and ensure vital coordination. Another gain is that there would be some harmonization between the human resources of BDC and the other services. The former DFATD organizations would be obliged to adopt a more private sector acumen whereas BDC would be end up with more internationally capable staff. Simply put the Ministry of Industry would become more international in their approach while the former DFATD organizations would be more business oriented. 6.3 Global Value Chains In the 21st century, conventional methods of analyzing contain two increasingly large flaws. Both are assumptions necessary for the conventional models to work. The first assumption is ignoring Value Added and the second is the belief that trade only occurs in finished goods and services. Continuing to base policy on these figures alone introduces biases against the inputs that are responsible for making the Canadian economy competitive. In fact part of Canada’s productivity problem can be explained by Global Value Chains (GVC). GVC Analysis is nothing more than a means to update our perspective of trade in order to ensure that the gains from trade are realized and spread throughout the economy in a fair and equitable manner. In Canada, manufactured products are the majority of Canadian exports, yet the Canadian economy’s output is 80% services. The reason why GVC is important is that it Recommendation # 1 One Ministry of Industry and Trade should be responsible for all foreign and domestic commercial agencies and activities.
  • 40. Office of The C. Honourable Hervieux-Payette P.C., Senator 39 Review of FTAs and Trade Policies of Canada 2006 - 2015 demonstrates the linkages between the various sectors; in this case enabling Canadians to understand the connection between manufacturing (the largest exporter) and services (the largest producer). The first assumption to be addressed is the belief that no attention should be given to Economic Value Added. Value Added is the summation of wages paid, returns to the capital account and the net taxes collected by the government (taxes minus subsidies); it is the total value gained by society for a specific economic activity. The only justification for this assumption is the belief that Value Added Content is equal across all sectors and countries. Any comparison across all sectors in all economies will reveal that the level of Value Added varies by sector and by country. For advanced economies, agricultural sectors yield the least Value Added, Manufacturing sectors yield average to below average levels, and the Service sectors yield the most relative to an economy’s total output. As such economies must consider the dispersion of Value Added content contained within their exports. Graph 22 Data Source: World Input Output Database62 The second assumption is the belief that the majority of global trade continues to occur in finished products. In the 21st century the opposite is true, the value of trade in intermediate goods and services outweigh the value of trade in finished goods and services. Countries are increasingly trading tasks and inputs of production. Conventional models have always treated exports and imports as finished goods. This overlooks imports that are inputs for Canada’s exports and other such relationships. Most finished products sold internationally contain components and services from various corners of the world; as such products are now “Made in the World”.63 Effectively, today trade is coordinated by Large Multinational companies who source tasks to domestic Medium sized firms who are competitive 62 WIOD. Viewed at: http://www.wiod.org/new_site/home.htm 63 WTO online information, Made in the World. Viewed at: http://www.wto.org/english/res_e/statis_e/miwi_e/miwi_e.htm 0.00% 10.00% 20.00% 30.00% 40.00% 50.00% 60.00% 70.00% 2007 2008 2009 2010 2011 Canada Share of Gross Exports Agriculture Natural Resources Manufacturing Services
  • 41. Office of The C. Honourable Hervieux-Payette P.C., Senator 40 Review of FTAs and Trade Policies of Canada 2006 - 2015 enough to deliver better quality at a lower price. The matter of concern is that Gross Exports accounts for the amount of goods and services internationally sold by a sector; simply put international revenue. In reality what matters in terms of growth and job creation are the earnings enabled by exports; known as Value Added Exports. As such GVC analysis enables division of Gross Exports into Value Added Exports which account for sector earnings.64 Graph 23 Data Source: World Input Output Database The major point of GVC is to demonstrate that exports sales and export earnings are not at all the same thing. As Displayed by Graph 22 the majority of Canada’s exports are indeed manufactured goods. However, as displayed by Graph 23 the export income earned by each sector does not at all reflect the same dominance of manufacturing because Canadians services are being increasingly integrated into manufacturing. An example would be Engineering services in the automotive sector, which are needed to design cars built in Canadian factories; without competitive designs Canada’s factories will be unable to produce competitive cars. In fact only by using GVC can policy makers understand the structural shift that is transforming the Canadian economy. Services are no longer performed in an effort to support manufacturing. Goods are manufactured in order to export Canadian services. Before the crisis, the Value Added composition of exports was almost evenly divided between services and manufacturing. Since the crisis, services have emerged as the dominant growth driver for exports. Although there has been a slight recovery in manufacturing, it is likely that this change is permanent, or else a more rapid export recovery would have been observed.65 64 See Appendix: 2. 65 $30 Billion CAD of manufactured exports have permanently disappeared from the Canadian economy. Transcript Oct. 29th , 2014 from the Senate Standing Committee on Bank, Trade and Commerce, Governor of the Bank of Canada’s, Stephen Poloz, Testimony. Viewed at: 0.00% 10.00% 20.00% 30.00% 40.00% 50.00% 60.00% 70.00% 2007 2008 2009 2010 2011 Canada Share of Value Added Exports Agriculture Natural Resources Manufacturing Services
  • 42. Office of The C. Honourable Hervieux-Payette P.C., Senator 41 Review of FTAs and Trade Policies of Canada 2006 - 2015 Graph 24 Data Source: Labour Force Survey Statistics Canada The WIOD’s database is new and is still under development; as such the most recent year is 2011. The Labour Force Survey’s results reflect the same transition over time. Manufacturing employment hasn’t grown and is in fact still recovering. Meanwhile the service sector has increased by almost 20% since the 2004 level and was only slowed down by the 2008-2009 crisis. It must be noted that Natural Resources have never been the dominant player in Value Added Exports. This implies that the gains to developing the Natural Resource sector will not be as large or as beneficial when compared to any policy that facilitates the development of Canada’s Service Economy. Simply put a National Childcare Program will contribute more to Canada’s international competitiveness than any pipeline due to the fact the Service sector is the most female worker intensive sector; without this program we deny our service sector access to some of the most highly trained and educated Canadian workers available. The implications of this system reach beyond exports and imports. For Canada this system reveals that there is a strong need for government policies. Switching from a manufacturing economy to a service-based economy guarantees higher levels of structural unemployment resulting from factory layoffs. The jobs lost and the jobs gained require different levels of education and skill sets. Trade is no longer a matter of foreign market activities; it now encompasses all interactions between a single country and the Global Economy. As explained above, accounting for Value Added is the crucial component of this analysis. Finally production occurs in “Chains”, meaning differing sectors across many countries have begun to work together. Policies that encourage inclusion such Germany’s “Make it in Germany” outperform Canada’s exclusive approach of “Made in Canada”. As such the first step to ensuring that both the public and private sector understand how Canada participates in GVCs is to develop and publically issue data covering all aspects of Global Value Chains. All governments must recognize the structural change in exports and design policies that ensure that the Canadian economy works in tandem with this change as opposed to resisting it. 0.00% 20.00% 40.00% 60.00% 80.00% 100.00% 120.00% 140.00% Change in Sector Employment Goods Services