Analyzing the formation of groups in a network adapting the modularity concept
Poster
1. Analyzing Social Communities
Based on a Location-Based
Social Networking Website
Program Flow of Code
• Obtain all records from April 2010 to July 2010
within the valid 30km x 30km square range around
Austin, TX by applying the haversine formula.
• Create unweighted and weighted encounter
graphs for all four months using valid encounter
parameters of 60 seconds and 0.2 km.
• Use the Louvain Method, which optimizes
network modularity, to determine the communities
that exist for each month.
• Using the top six communities for each month,
determine the users that belong to each
community (both unweighted and weighted) and
create contour maps to visualize the patterns of
community locality and movement over time.
• Process the communities over the four months
with a community correlation algorithm to
determine the best-matched communities over
time for the purpose of analyzing community
evolution.
Introduction
• We analyze how human communities exist and evolve
using data from Gowalla, a location-based social networking
site.
• Work has already been completed in characterizing the
nature of vehicular encounter patterns.
• This study extends this vehicular analysis by comparing
vehicular communities with human social communities and
determining their similarities and differences.
• We would like to examine the patterns found in human
communities and how they evolve over time.
• We focus on the GPS traces of human movement from
Gowalla from April 2010 to July 2010 for a 30km x 30km
square range around Austin, TX.
• The shapes of the social communities and their evolution
over time are important in understanding the dynamics of a
network.
• Practical applications of network structures involve
determining the optimal method of transmitting information to
the members of a certain community.
David B. Y., Bhaskar Krishnamachari, Fan Bai
Future Works
• Determine what causes the characterizing differences
between vehicular and human social communities.
• Design a network similar to a VANET to optimize
human mobile networks for cost and transmission rate.
• Extend to other fields, such as examining social
patterns or studying the spreading of diseases.
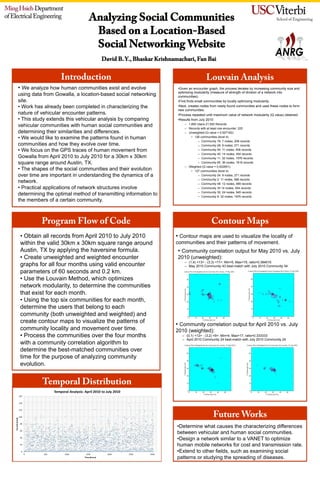
Contour Maps
Louvain Analysis
• Given an encounter graph, the process iterates by increasing community size and
optimizing modularity (measure of strength of division of a network into
communities).
• First finds small communities by locally optimizing modularity.
• Next, creates nodes from newly found communities and uses these nodes to form
new communities.
• Process repeated until maximum value of network modularity (Q value) obtained.
• Results from July 2010:
– 1,660 Users 21,930 Records
– Records with at least one encounter: 225
– Unweighted (Q value = 0.927162):
• 126 communities (level 4)
– Community 76: 7 nodes, 206 records
– Community 28: 9 nodes, 271 records
– Community 54: 11 nodes, 406 records
– Community 40: 14 nodes, 454 records
– Community 11: 32 nodes, 1976 records
– Community 65: 36 nodes, 1616 records
– Weighted (Q value = 0.932851):
• 127 communities (level 4)
– Community 24: 9 nodes, 271 records
– Community 2: 11 nodes, 588 records
– Community 48: 12 nodes, 489 records
– Community 35 14 nodes, 454 records
– Community 30: 24 nodes, 945 records
– Community 9: 32 nodes, 1976 records
Temporal Distribution
• Contour maps are used to visualize the locality of
communities and their patterns of movement.
• Community correlation output for May 2010 vs. July
2010 (unweighted):
– (1,4) <13> - (3,3) <11>: Min=5, Max=19, ratio=0.384615
– May 2010 Community 43 best-match with July 2010 Community 54
• Community correlation output for April 2010 vs. July
2010 (weighted):
– (0,1) <12> - (3,2) <9>: Min=4, Max=17, ratio=0.333333
– April 2010 Community 24 best-match with July 2010 Community 24