Assessment of Air Quality in and Around Raichur Thermal Power Station, Raichur
es100401y PDF with Links
1. Life-Cycle Nitrogen Trifluoride
Emissions from Photovoltaics
V A S I L I S F T H E N A K I S *
Brookhaven National Laboratory and Columbia University,
New York, New York, United States
D A N I E L O . C L A R K , M E H R A N M O A L E M ,
A N D P H I L C H A N D L E R
Applied Materials, Santa Clara, California, United States
R O B E R T G . R I D G E W A Y ,
F O R R E S T E . H U L B E R T ,
D A V I D B . C O O P E R , A N D
P E T E R J . M A R O U L I S
Air Products and Chemicals Inc., Allentown,
Pennsylvania, United States
Received February 9, 2010. Revised manuscript received
September 26, 2010. Accepted September 30, 2010.
Amorphous- and nanocrystalline-silicon thin-film photovoltaic
modules are made in high-throughput manufacturing lines that
necessitate quickly cleaning the reactor. Using NF3, a potent
greenhouse gas, as the cleaning agent triggered concerns as
recent reports reveal that the atmospheric concentrations of
this gas have increased significantly. We quantified the life-
cycle emissions of NF3 in photovoltaic (PV) manufacturing,
on the basis of actual measurements at the facilities of a major
producer of NF3 and of a manufacturer of PV end-use
equipment. From these, we defined the best practices and
technologies that are the most likely to keep worldwide
atmospheric concentrations of NF3 at very low radiative forcing
levels. For the average U.S. insolation and electricity-grid
conditions, the greenhouse gas (GHG) emissions from
manufacturing and using NF3 in current PV a-Si and tandem a-Si/
nc-Si facilities add 2 and 7 g CO2eq/kWh, which can be
displaced within the first 1-4 months of the PV system life.
1. Introduction
Chemical vapor deposition (CVD) operations or plasma
deposition operations require cleaning the reactor between
operations to maintain the purity of the deposited layers.
Untilthemid-tolate-1990s,cleaningwasaccomplishedeither
by off-line manual scrubbing or by dry-etching using a
perfluorocarbon gas (PFC), mainly CF4 or C2F6. Excitation of
the gas into plasma creates fluorine radicals that bond with
the Si-based residue, converting it to SiF4 that can be vented.
However, increased demands on the size and throughput of
semiconductor fabrication facilities (fabs), coupled with the
low dissociation of the PFCs drove the move to using nitrogen
trifluoride, NF3. This gas has a higher dissociation rate than
PFCs, supporting faster throughputs and lower emissions in
manufacturing integrated circuits and thin film transistor-
based displays (1, 2). Emissions were reduced further by
employing remote plasma sources (RPS) that dissociate NF3
into fluorine radicals before they enter the chamber (3-8).
This combination of lower emissions, better process per-
formance, faster clean times, and reduced equipment
maintenance led the semiconductor industry to adopt NF3
as their principal cleaning chemical in the last 15 years, as
lately did the emerging a-Si/crystalline-Si thin-film photo-
voltaics industry.
The indirect carbon emissions in the life-cycle of pho-
tovoltaics (PVs), due to using fossil fuels, are extremely small
compared to those from fossil-fuel cycles (9). However,
concerns arose about the PV industry’s direct use of potent
greenhouse gases (10). A few researchers attempted to
quantify the carbon footprint from employing fluorinated
gases to clean the reactor during PV manufacturing (11-14).
Thus, Wild-Scholten et al. (11) determined that the majority
ofNF3 emissionsoriginateduringmanufacturing.Incontrast,
Schottler et al. (12, 13) concluded that the use phase, not
production, may dominate the impact and highlighted the
potential value of abatement downtime in significantly
lowering the overall environmental impact of a fab (14).
Ours is the first study of NF3 emissions in the PV life-cycle
in which actual measurements of NF3 concentrations were
collected from the effluent streams in major manufacturing
and end-use facilities. Production and end use are the main
two stages where emissions occur. We deemed that trans-
portationwasunlikelytocontribute;thus,therearenoreports
of transportation accidents involving NF3 emissions, and a
risk analysis of transportation using International Organiza-
tion for Standardization (ISO) module packages for the PV
end use showed a very small probability of leakage (Sup-
porting Information, Appendix S1).
2. NF3 Concentrations in the Atmosphere
Nitrogen trifluoride is a potent greenhouse gas, with a
projected atmospheric lifetime of 550 years and an estimated
global warming potential (GWP100) of 16 800 (15). Weiss et
al. (16) demonstrated an increase in the atmospheric
concentrations of NF3 from 0.02 ppt in 1978 to 0.454 ppt in
2008. Their latest measurements reveal a rate of increase of
0.053 ppt year-1
or about 11% per year, corresponding to
about 620 t of global NF3 emissions annually. Estimating a
production of 4000 tons per year, these authors forecast an
emissionrateofabout16%.However,theyalsonotedarecent
slow-down of the rise in concentration.
To assess the relative impact of cumulative NF3 emissions
and gauge the potential impact of future ones, we use
radiative forcing (RF), attributable to the current atmospheric
NF3 burden. Radiative forcing is defined as an externally
imposed perturbation in the Earth’s energy balance, induced
by changes in concentrations of greenhouse gases and
aerosols, the Earth’s albedo, and solar energy (17).
For long-lived greenhouse gases, such as NF3, we estimate
the globally averaged change in RF from the following
equation:
Here, R is a gas-specific constant for radiative efficiency (W/
m2
-ppbv), X is the atmospheric concentration in parts per
billion by volume (ppbv), and X0 is the unperturbed con-
centration. For NF3, R is 0.21 W/m2
-ppbv (17), yielding a net
radiative forcing of 0.9 × 10⁻⁴
W/m2
based on the current
global atmospheric concentration of 0.454 ppt and zero
background concentrations (16). The total radiative forcing
for all anthropogenic greenhouse-gas emissions from 1750
to 2005 reportedly is 2.63 ( 0.26 W/m2
(18), of which nitrogen
trifluoride represents 0.003%. Compared to CO2 alone, the
current NF3 radiative forcing from the atmospheric burden* Corresponding author e-mail: vmf@bnl.gov.
∆Fnew ) R(X - X0)
Environ. Sci. Technol. 2010, 44, 8750–8757
8750 9 ENVIRONMENTAL SCIENCE & TECHNOLOGY / VOL. 44, NO. 22, 2010 10.1021/es100401y 2010 American Chemical Society
Published on Web 10/25/2010
2. of 0.454 ppt is 0.005% of the total anthropogenic CO2 RF of
1.66 ( 0.17 W/m2
.
3. NF3 Emissions in Production and Distribution
A few manufacturers worldwide generate NF3 via the
fluorination of ammonia or the electrolysis of ammonia and
HF. The estimated annual production capacity of the largest
producer, Air Products, is over 3000 tons. Other major
producers are Sodiff, Kanto Denka, Formosa Plastics, and
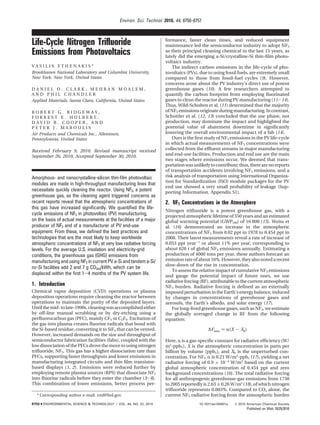
Mitsui Chemicals. We estimated that the global production
of NF3 in 2008 was about 7200 tons, that grew by an average
of 41% per year since 1995 (Figure 1).
Both the rate of NF3 production and its atmospheric
concentrationsroseoverthepastdecade;however,theformer
increased annually by an average of 41% and the latter by
11%. Therefore, expressing atmospheric NF3 concentrations
as a function of the global annual NF3 production shows a
reduction in the NF3 emission factor (Figure 2). On the basis
of the estimated global production and the atmospheric
concentrations measured by Weiss et al., the emission factor
in 2008 was 9%, i.e., below their estimate of 16 ( 4%. In the
following, we highlight past and current practices in the
various stages of the NF3 lifecycle to identify the underlying
reasons for this fall in emission factors.
3.1. Past and Current Practices in NF3 Production. NF3
emissions occur during manufacturing from known or
fugitive sources. The former are those from returned product
containers and various vent streams operating during
manufacturing (e.g., vents for the product-fill manifold,
reactor start-up or shut-down, analyzers, and product
purification). Fugitive emissions come from leaks occurring
during manufacturing of the gas from pressurized manifolds,
compressors, and during product fills. Depending upon the
size of the customer’s fabrication facility, NF3 is distributed
in cylinders or ISO containers. Air Products manufactures
NF3 at four facilities worldwide where it is filled into
appropriate ISO containers for transportation to end users
and to transfills (distribution centers). At their global transfill
facility, the gas is transferred into smaller cylinders for
shipment to customers. However, with the increase in
customer consumption driven by larger fabrication facilities,
the substantial majority of NF3 now is shipped to customers
directly in ISO containers; cylinders are required only for a
very small percentage of the product. Thus, the majority of
product fill occurs at the manufacturing sites.
Ambient NF3 monitoring is conducted at the plant using
continuous gas monitors, such as those based on nondis-
persiveinfrared(NDIR)sensors,abletodetectconcentrations
aslowasafewppmv.Residualproductreturnedbycustomers
is a potential source for fugitive emissions. Estimates suggest
that most fabs leave about 5-10% of the total gas volume in
the container to avoid contamination. Over the last 8 years,
Air Products phased out their venting of product residuals.
When containers are returned, their residuals are analyzed,
and if purity specifications are met, the containers are top-
filled with new product; otherwise, the residuals are recycled
into the manufacturing process.
3.2. NF3 Emissions Monitoring Program. Air Products
Inc. reported a continuing decline in NF3 emission factor at
their production facilities in Hometown, PA, over the last 12
years. The estimated total emission factors were about 7%
in 1997, 5% in 2004, and 2% in 2006-2009; they are targeted
to decline to 0.5% (19). The Japanese manufacturer, Kanto
Denka, also reported a fall from 3.8% in 2006 (when they
started a major emissions-reduction program) to 3.1% in
2007, 2.5% in 2008, and 2% in 2009. This company aims for
further reductions, likely toward Air Product’s 0.5% target
(20).
To assess the fraction of product emitted to the atmo-
sphere during operations, Air Products conducted two
FIGURE 1. Annual worldwide NF3 production, 1995-2008.
VOL. 44, NO. 22, 2010 / ENVIRONMENTAL SCIENCE & TECHNOLOGY 9 8751
3. independent calculations based on a combination of engi-
neering data and analytical measurements. The first calcula-
tion was based on material balances and included process
parameters such as process-flow rates, process efficiencies,
process yield, and product produced and transferred into
containers. Critical measurements are the mass flow of F2 to
reactors, the efficiency of process conversion, and the
quantity of NF3 transferred to containers. Fluorine flow is
determined by Coriolis-based mass-flow meters, with the
manufacturer’s stated precision of (0.05%. The scales used
to weigh NF3 transferred to containers also are very precise
((0.5%). Process-conversion efficiencies are determined
using process analytical metrology, such as gas chromatog-
raphy and Fourier transform infrared (FTIR); their estimated
precision is <(2%. Using this approach, total emissions
accounted for 2% of production for a 3 month period in late
2008 when the factory was running at capacity. The uncer-
tainty of this calculation is estimated to be (1% based
primarilyonuncertaintiesindeterminingreactorefficiencies.
The second method employed for calculating emission
factors is based on summing known emission sources within
the plant. These included dryer vents, reactor vents, liquifier
vents, analytical vents, and eight other smaller vent sources.
Figure 3 shows the emissions reduction from March 2009,
when known emission sources totaled 1.6% of production,
to April 2010 where they have been reduced to 0.9%, and
includesthetargetedreductionstoachieveanemissionfactor
of <0.5%. A combination of engineering calculations and
analytical measurements were used to quantify these sources
(Supporting Information, Appendix S2). The uncertainty of
this approach is being determined through analytical mea-
surements of critical processes including the dryer and
liquefier vent streams. Potential emissions in the manufac-
turingareaarecontinuouslymonitored,asrequiredbyOSHA,
toensurethatconcentrationsdonotexceedtheNF3 threshold
limiting value (TLV) of 10 ppm.
Quantification of some known emission sources was
conducted using FTIR to measure NF3 concentrations in the
captured streams. Figures 4 and S1, Supporting Information,
plot the concentration profiles of NF3 from a typical liquifier
vent stream. These figures include data on CF4 which was
added as a spiking agent upstream of the sampling point to
determinevariabilityoftheexhaustvolume’sflow-rateduring
transfer of the gas. Combining total exhaust flow with NF3
concentrations gave the NF3 emission volume rates in sl hr-1
.
The average NF3 concentrations of ca. 1000 ppm in these
figures correspond to NF3 flows of 24.3 sl hr-1
. Recycling
these flows would prevent NF3 emissions of 0.75 tons/year
and 0.67 tons/year, correspondingly.
4. NF3 Use and Emissions in a-Si/c-Si Thin-Film PV
Manufacturing
The advent of the remote plasma source (RPS) for cleaning
chambers may be the leading contributor to the relative
decline in NF3 and PFC emissions. RPS technology became
the dominant method of cleaning by the late 1990s. In the
early part of that decade, the vast majority of new plasma-
enhanced chemical vapor deposition (PECVD) processes
transitioned to NF3-based RPS clean technology (21, 22).
Subsequent improvements in it, coupled with its high
adoption rate, increased NF3 consumption and lowered
associated NF3 emissions. The rapid growth of its use in the
flat-panel display industry and, lately, in the PV industry,
caused a recent major spurt in NF3 manufacturing.
The use of NF3 in the PV industry is limited to a-Si/c-Si
thin-film PV manufacturing lines that require frequent, fast
reactor cleaning. We used data extracted from the reports of
six PV manufacturers employing Applied Materials SunFab
process-equipment lines, one of the most common in the
industry.TheselinesunifyRPSsystemsforgeneratingplasma
with integrated, interlocked emission abatement systems.
Figure 5 shows the configuration of the systems where the
measurements were made; the sampling and analysis
protocols are described below.
FIGURE 2. Decline in NF3 emission factors over the 8 years, 2000-2008. These data were calculated from the values presented in
Figure 1 and the measurements reported by Weiss et al. on NF3 atmospheric concentrations over the same period.
8752 9 ENVIRONMENTAL SCIENCE & TECHNOLOGY / VOL. 44, NO. 22, 2010
4. 4.1. Sampling and Detection of NF3 in SunFab Effluent
Streams. 4.1.1. Methods and Apparatus. We used standard
sampling and analytical methods adopted by the semicon-
ductorindustry(23)forquantifyingthegreenhousegas(GHG)
emissions. They include time-mapped extractive FTIR spec-
troscopy and quadrupole mass spectrometry (QMS).
4.1.2. Sampling. The exhaust was sampled downstream
of the abatement (Figure 5). A sampling pump continuously
FIGURE 3. Known emission sources in NF3 manufacturing are shown for March 2009, April 2010, and targeted reductions for end of
2010.
FIGURE 4. NF3 concentrations in a product-purification vent stream that currently is recycled into the process; previously it was
vented. CF4 is introduced as a spiking agent to measure the flow variability (Air Product’s manufacturing facility in Hometown, PA).
VOL. 44, NO. 22, 2010 / ENVIRONMENTAL SCIENCE & TECHNOLOGY 9 8753
5. drew a slipstream of about 1 slm. A computer-controlled
transducer maintained and monitored the sampling pressure
through an adjustable valve located just before the sampling
point. The exhausts from the FTIR- and QMS-sample pumps
were returned to the exhaust line below the sampling point.
A three-way valve installed on the sampling line enabled us
to easily switch between the abatement system’s exhaust
system and a dynamic dilution system used to calibrate the
FTIR and QMS. Heating to 110 °C prevented condensation
in the sampling lines and the FTIR gas cells during testing.
4.1.3. Extractive FTIR. FTIR is chosen as the primary
method for quantifying NF3 due to its strong absorbance in
the midinfrared region. We used Thermo Nicolet 6700 FTIR
operating at 1 cm-1
resolution and equipped with a multipass
Gemini6mgascell.Themercury-cadmium-telluridetype-A
detector (MCTA) produced a full scan of 600 to 4500 cm-1
every 0.6 s. Averaging eight scans gave a single data point
every 4.8 s. The system’s dynamic response time to changes
in gas concentration was about 12 s, measured by the rise
time from 10% to 90%.
4.1.4. QMS. We employed a Pfiffer Omnistar 300 QMS to
determinethetotalflowofgasthroughtheabatementsystem.
The system was calibrated and tuned for 1 AMU resolution
and maximum sensitivity in the range of 2-135 AMU. We
spiked a known quantity of Krypton (Kr) into the abatement
system, and the QMS determined its concentration at the
system’s outlet by monitoring m/e 84 for 84
Kr+
. Krypton is
inert, absent from the background, not used in process
recipes, mixes very uniformly, and has no signal interferences
atm/e84.Totalpost-abatementeffluentflowwasdetermined
by dividing the flow rate of injected Kr by the QMS-
determined post-abatement concentration.
4.1.5. Detection Limits. The NF3 detection limit in our
FTIR system was 0.08 ppm, on the basis of a 3-fold signal-
to-noise ratio for the spectra obtained after calibrating the
FTIR’s response to NF3 in nitrogen. During some runs,
monitoring interferences raised the noise in the region of
NF3 absorption,thusyieldingahigherdetectionlimit.Spectral
analysis required deconvolving the interfering species from
the intense primary absorption band for NF3 centered at ca.
903 cm-1
. As the quantity of interfering species varied over
the six factories where emissions data were collected, the
FTIR’s detection limit for NF3 ranged from 0.5 to 30 ppm.
When the measurements yielded a nondetect for NF3, the
reported emissions were calculated on the basis of detection
limits.
4.1.6. Calibration.Allmeasurementswerecalibrated,and
flows were determined via an onboard calibration system.
As shown in Figure 5, the apparatus included a three-way
valve for switching from sampling the process exhaust to
sampling gas in the dilution-calibration system. We used
certified gas mixtures to generate a wide range of known
feed concentrations to the analytical tool set with calibrated
mass flow controllers (MFCs). For each calibration, test
spectral scans of the standard concentrations were taken
from a minimum of 6 points, from which we generated a
linear regression model, relating concentration to peak
intensity or absorbance. We accepted the model only when
the correlation coefficient was >95%. The FTIR response was
calibrated to NF3 using this approach; Figure S2, Supporting
Information, shows a typical calibration curve. A similar
calibration was made of the QMS response to Kr in nitrogen
using test atmospheres created by diluting Kr with nitrogen
in the calibration system.
4.2. Factory Models and Measurements of NF3 Con-
sumption. For this study, we modeled the Sunfab single-
junction (SJ) and tandem-junction (TJ) silicon thin-film
photovoltaics (TFPV) factories to calculate the representative
carbon footprint for cleaning NF3 chambers. The amount of
NF3 used in producing a solar panel was defined by the clean
recipe, the amount emitted post-abatement during chamber
cleans as measured post-abatement, and the amount of NF3
lost during chemical production and handling of the clean
gas used during the clean. Figure 6 is the factory model for
the production of SJ-TFPV panels; the model for manufac-
turing TJ-TFPV panels appears in Figure S3, Supporting
Information.
In both models, large glass substrates, each 5.7 m2
, enter
the factory from the left and exit on the right. The AM1.5-
rated DC efficiency of the SJ panels is 340 W and that of the
TJ panels is 570 W. Integrated robots sequence the glass
substrates through the process mainframes. Each mainframe
has multiple thin-film CVD deposition chambers, RPS units,
and point-of-use (POU) abatement devices around its
immediate perimeter. Each factory has multiple mainframes.
Every deposition chamber has its own dedicated remote-
plasma-source (RPS) and integrated POU devices. The
abatement device controls the byproducts of the clean,
including F2, SiF4, and undissociated NF3. Factory integration
and safety interlocks prevent the initiation of deposition or
reactor cleaning should the process chamber, RPS, or
occupational space sensors display an unsafe operating
FIGURE 5. Schematic of process-effluent sampling used to collect NF3 emissions data at thin-film photovoltaic manufacturing
facilities.
8754 9 ENVIRONMENTAL SCIENCE & TECHNOLOGY / VOL. 44, NO. 22, 2010
6. condition, including any malfunction of the abatement
device, which utilizes independent dual processors and
sensors interlocked with the process-tool set. A chamber-
clean process step may follow each deposition process, or
multiple deposition processes might precede a chamber
clean. Deposition occupies the largest overall percentage of
the process-cycle time. For factory modeling, the fraction of
time the glass substrates spend in transition is included in
the deposition-cycle time. For the SJ TFPV process, 7.5% of
process time is spent in clean and 9.8% is for the TJ TFPV
process.
4.2.1. SJ TFPV Factories. A single glass panel takes 15.1
min of CVD production cycle time, of which 14.0 min are
spent in deposition or glass transport, and 1.1 min for
chamber cleans. The SJ CVD process includes multiple steps,
including deposition of the doped amorphous silicon (p,n)
and intrinsic (i) silicon layers. The NF3 flow rate is 25 slm
during chamber cleans. The total integrated NF3 volume
corresponding to a SJ panel is 28.5 sl.
4.2.2. TJ TFPV Factories. A single glass panel takes 75.9
min of the CVD production cycle time, of which 68.5 min are
spent in CVD deposition or glass transport and 7.4 min are
for chamber cleans. The TJ CVD process contains multiple
steps including depositing doped- and intrinsic-amorphous
and microcrystalline silicon layers. The NF3 flow rate during
chamber clean is the same as that in the SJ process, viz., 25
slm. The total NF3 flow per TJ panel is 184.8 sl.
4.2.3. Factory Emission Factors. Table 1 shows six xamples
of full factory destruction removal efficiency (DRE) for NF3
cleans, measured by in-house and third-party analytical
services, using online FTIR and QMS detection. The factories
represented in this table had been operating for about 1 year
and are at various locations around the world. In each case,
full process emissions for fabricating a solar panel were
measured for three to five deposition-and-clean cycles, and
the data from at least three representative multiple-clean
cycles were averaged to produce the values shown in this
table. The factory-to-factory variation in NF3 emissions is
due to differences in the recipes of the proprietary processes,
the protocols employed, the preventative maintenance
practices, and the variation in the lower detection limit of
analytical tools under sampling conditions.
The data in Table 1 reveal an average factory DRE for NF3
of 99.89% with a standard deviation of 0.084; this DRE
corresponds to a mean emission factor of 0.11%. The 95%
confidence level of this mean is (0.068% (Supporting
Information, Appendix S3).
Figure 7a,b shows NF3-emission profiles measured during
chamber cleans at two PV manufacturing sites. Factory A
has average NF3 emissions of 1.5 ppm throughout the
duration of the clean, which, when integrated over 1 min,
yieldsanemissionrateof0.0025slm.InfactoryC,thebaseline
noise was relatively high, yielding a high detection limit (i.e.,
27.5ppm);integratingthisover1minyieldedanNF3 emission
rate of 0.063 slm.
These concentrations are typical of operations in current
SunFab TFPV module manufacturing plants and represent
average annual-emission factors. Schottler et al. ’s hypothesis
(14) that abatement downtime can significantly affect such
emissions is invalid since the loss of abatement in these
integrated systems automatically shuts down the NF3 feed
and all deposition and clean operations. Fugitive emissions
are unlikely as discussed in Appendix S4, Supporting
Information.
5. Life-Cycle NF3 Emissions in PV Manufacturing
5.1. Estimated Carbon Footprint. We calculated the carbon
footprint from NF3 emissions from SJ- and TJ-TFPV panel
manufacturing by combining emissions during manufactur-
ing with those upstream at the NF3 manufacturing plant.
Figures5andS2,SupportingInformation,respectively,depict
the input volumes and resulting emissions of NF3 from
producing one SJ or TJ silicon TFPV module.
We applied an emission factor of 0.1% for the end use of
NF3 in the Sunfab system, and an emission factor of 1.6% in
the NF3 production in 2009, declining to 0.5% in the future
“target” case. The 2009 number represents the existing
facilities listed in Table 1, which have an average life of 1
year.
This assessment, based on actual data from the NF3
production at Air Products and end use in Applied Materials
Sunfab system, accurately represents the production of
photovoltaics by the latter, as the former is their main
FIGURE 6. Model of a single-junction Sunfab factory, showing NF3 process requirements and emissions produced per panel fabricated.
TABLE 1. Typical Sunfab NF3 Post-Abatement Emissions
factory source
avg NF3
conc (ppm)
NF3
flow (slm)
factory
DRE (%)
A AMAT 2.5 0.00625 99.98
B AMAT 8.5 0.02550 99.90
Ca
AMAT 27.5 0.06325 99.75
D third party 2.0 0.00600 99.98
E third party 8.6 0.02580 99.90
Fa
third party 11.0 0.03300 99.87
average 99.89
STD 0.084
a
Reported values impacted by high detection limits and
correspond to them.
VOL. 44, NO. 22, 2010 / ENVIRONMENTAL SCIENCE & TECHNOLOGY 9 8755
7. supplier. We also added the carbon dioxide emissions from
the electricity and methane required to operate the RPS and
the abatement system; they are 0.46 kg CO2 per SJ panel and
3.02 kg CO2 per TJ panel. Thus, for average U.S. solar
irradiationconditions(i.e.,1800kWh/m2
/year),theemissions
from using NF3 as a reactor cleaning gas in these facilities
added 2 and 7 g/kWh of CO2eq, respectively, in the life cycle
of PV; these values are expected to fall to 0.6 and 2 g/kWh
by the end of 2010. Such emissions will have a minor effect
on the total life-cycle CO2eq emissions in a-Si PV, assessed
to be approximately 25 g/kWh. They are insignificant in the
context of the avoidance of CO2 emissions by replacing grid
electricity with PV-generated electricity. The modules will
“balance” these emissions in the first 11-43 days of their 30
year life (Table 2).
6. Discussion
Using data from the actual production and end uses of NF3
inthePVindustry,wedeterminedtrendsinuseandemissions
of this potent GHG. Emission factors calculated using global
NF3 production data over the last 10 years and atmospheric
measurements of NF3 over that same period show a declining
trend in the fraction of NF3 generated that is released to the
atmosphere. Contributing to this downward trend is a
significant reduction of NF3 emissions during production in
the U.S. facilities of the largest NF3 producer from 7% years
ago to 1.6% in 2009. This decline was realized by eliminating
losses when refilling returned cylinders and capturing and
recycling several small releases in the production- and
purification-venting streams. The largest NF3 producer has
a target for lowering the emissions to 0.5% by recycling more
process-vent streams during manufacturing. These estimates
are based on a large number of data points; the major ones
have a variance of about (1%.
In parallel, drastic reductions of emissions occurred in
the end use of NF3, due to the widespread implementation
of the second-generation RPS for chamber cleaning, com-
bined with point-of-use abatement of NF3 emissions. In 2009,
the emissions during reactor cleaning in amorphous silicon-
TF PV fabrication was estimated to be 0.11%. The combined
NF3 emission factor in its production and use for reactor
cleaning in PV was 1.7%. These numbers are much smaller
than the emission factors estimated in this paper from Air
Products global production estimates and Weiss et al.’s
atmospheric measurements.
We note that employing NF3 in the PV industry is a new
end use with up-to-date plasma and abatement systems and
that the PV industry’s usage accounts for only about 3% of
global NF3 production. High emissions may very well reflect
other, less-controlled, end uses of the gas and older practices
(Supporting Information, Appendix S5). Nevertheless, since
the PV industry is likely to be the fastest growing end-user,
it is likely that the best practices and control technologies
described in this paper soon will become standard practices,
thereby drastically lowering global NF3 emission factors.
FIGURE 7. FTIR spectra collected at PV manufacturing sites. (a) The data from Factory A show a detection limit of 0.5 ppm; (b) those
from Factory C show a detection limit of 27.5 ppm due to spectral interferences.
TABLE 2. NF3 Emissions in the Life Cycle of Si Thin-Film PV
Modules
module
and year
SJ
2009
TJ
2009
SJ
Target
TJ
Target
module rated
power (kWp) 0.34 0.57 0.34 0.57
NF3 requirement
(sl/module) 28.5 184.7 28.5 184.7
total NF3 emission
factor (%) 1.7 1.7 0.6 0.6
total NF3 emission
s (sl/module) 0.5 3.3 0.2 1.1
CO2-eq emissions
(kg/module)a
25.7 166.6 8.6 55.9
total CO2 emissions
(kg/module) 26.0 199.2 9.1 58.9
total CO2 emissions
(g/kWh)b
1.8 6.9 0.6 2.4
CO2-eq payback
time (days)c
34 128 11 43
CO2-eq payback time
(% of 30 year life) 0.3 1.2 0.1 0.4
a
Includes CO2 emissions from energy use in RPS and
abatement of NF3. b
Assuming US average irradiation of
1800 kWh/m2
/year and 80% performance ratio. c
Assuming
US Grid Mix CO2 emissions of 606 g/kWh.
8756 9 ENVIRONMENTAL SCIENCE & TECHNOLOGY / VOL. 44, NO. 22, 2010
8. Acknowledgments
Support to one of the authors (V.M.) from the US-DOE Solar
Technologies Program with Contract DE-AC02-76CH000016
to BNL is gratefully acknowledged.
Supporting Information Available
Additional measurements and the TJ-TFTPV model. This
material is available free of charge via the Internet at http://
pubs.acs.org.
Literature Cited
(1) Pruette, L.; Karecki, S.; Reif, R.; Entley, W.; Langan, J.; Hazari,
V.; Hines, C. Evaluation of a dilute Nitrogen Trifluoride plasma
clean in a dielectric PECVD reactor. Electrochem. Solid-State
Lett. 1999, 2, 592.
(2) Tasaka, A. Electrochemical synthesis and applications of NF3.
J. Fluorine Chem. 2007, 128, 296.
(3) Mendicino, L.; Brown, P. T.; Filipiak, S.; Nauert, C.; Estep, H.;
Fletcher, M. PFC emissions reductions and process improve-
ments with remote plasma CVD chamber cleans. Proc. Elec-
trochem. Soc. 2002, 15, 144.
(4) Mendicino, L.; Nauert, C.; Brown, P. T.; Golovato, S.; Day, B.;
Atherton, A.; Nowak, T.; Silvetti, D.; Hartz, C.; Johnson, A.;
Maroulis, P. Reduced clean time and PFC emissions reduction
through remote plasma clean for lamp heated CVD chambers.
Proc. Electrochem. Soc. 2001, 6, 15.
(5) Reichardt, H.; Frenzel, A.; Schober, K. Environmentally friendly
wafer production: NF3 Remote microwave plasma for chamber
cleaning. Microelectron. Eng. 2001, 56, 73.
(6) Kastenmeier, B. E.; Oehrlein, G.; Langan, J.; Entley, W. Gas
utilizationinremoteplasmacleaningandstrippingapplications.
J. Vac. Sci. Technol. 2000, A18, 2102.
(7) Goolsby,B.;Vartanian,V.L.;Mendicino,L.;Rivers,J.;Soyemi,A.;Sun,
S.; Turner, M.; Esber, C. Characterization of NF3 chamber cleans on
multiple CVD platforms. Proc. Electrochem. Soc. 2002, 15, 127.
(8) Vartanian, V.; Goolsby, B.; Mendicino, L.; Brown, P. T.; Vires,
J.; Rose, S.; Babbitt, D. Managing fluorinated byproducts of CVD
chamber cleans. Semicond. Int. 2003, 26, 77.
(9) Fthenakis, V.; Kim, H. C.; Alsema, E. Life-cycle emissions from
photovoltaics. Environ. Sci. Technol. 2008, 42 (6), 2168–2174.
(10) Hoag, H. The missing greenhouse gas. News Feature, Nature
Reports Climate Change 2008, 2, 99; www.nature.com/reports/
climatechange.
(11) de Wild-Scholten, M.; Alsema, E.; Fthenakis, V.; Agostinelli, G.;
Dekkers, H.; Roth, K.; Kinzig, V. Fluorinated greenhouse gases
in photovoltaic module manufacturing: potential emissions and
abatement strategies. Proc. 22nd European Photovoltaic Solar
Energy Conference, Milano, Italy, September, 2007.
(12) Schottler, M.; de Wild-Scholten, M. Carbon footprint of PECVD
chamber cleaning. Photovoltaics Int. 2008, 2, 64–69.
(13) Schottler, M.; de Wild-Scholten, M. The carbon footprint of
PECVD chamber cleaning using fluorinated gases. Proc. 23rd
European Photovoltaic Solar Energy Conference, Valencia,
Spain, September, 2008.
(14) Schottler, M.; de Wild-Scholten, M. The life-cycle environmental
impacts of etching silicon wafers and (PE)CVD chamber cleaning.
Proc. Electronics Goes Green 2008+, Berlin, Germany, Sep-
tember, 2008.
(15) Prather, M. J.; Hsu, J. NF3, the greenhouse gas missing from
Kyoto. Geophys. Res. Lett. 2008, 35, L12810.
(16) Weiss, R. F.; Mu¨hle, J.; Salameh, P. K.; Harth, C. M. Nitrogen
trifluoride in the global atmosphere. Geophys. Res. Lett. 2008,
35, L20821.
(17) Intergovernmental Panel on Climate Change (IPCC). Third
Assessment Report: Climate Change, 2001, IPCC: Potsdam,
Germany, p 353.
(18) Intergovernmental Panel on Climate Change (IPCC). Climate
Change 2007: The Physical Science Basis; Cambridge University
Press: Cambridge, U.K., 2007; p 141.
(19) Corporate Responsibility Report; Air Products & Chemicals, Inc,
2009; Air Products & Chemicals: Hometown, PA, p 20; www.
airproducts.com.
(20) Imao S., Kanto Denka, Japan, email communication 10-15-
09.
(21) Raoux, S.; Tanaka, T.; Bhan, M.; Ponnekanti, H.; Seamons, M.;
Deacon, T.; Xia, L.-Q.; Pham, F.; Silvetti, D.; Cheung, D.;
Fairbairn, K.; Johnson, A.; Pearce, R.; Langan, J. Remote
microwave plasma source for cleaning chemical vapor deposi-
tion chambers. J. Vac. Sci. Technol., B: Microelectron. Nanometer
Struct. 1999, 17 (2)), 477–485.
(22) Mendicino, L.; Filipiak, S.; Brown, P. T.; Langan, J.; Ridgeway,
R.; Johnson, A.; Pearce, R.; Maroulis, P.; Atherton, A. Evaluation
of the Applied Materials uclean Technology for DxZ Chamber
Cleans for Perfluorocompound (PFC) Emissions Reductions,
International SEMATECH Technology Transfer 98083547B-TR,
Sematech: Austin, TX, 1998.
(23) International SEMATECH Manufacturing Initiative, “Guidelines
for Environmental Characterizations of Semiconductor Process
Equipment” ISMI Technical Transfer Document 06124825A-
ENG, Sematech: Austin, TX, 2006.
ES100401Y
VOL. 44, NO. 22, 2010 / ENVIRONMENTAL SCIENCE & TECHNOLOGY 9 8757