9654467111 Low Rate Call Girls In Tughlakabad, Delhi NCR
JBS encerra 2T23 com receita de R$89 bi e EBITDA de R$4,5 bi
1. CONSOLIDADO
• Anúncio do plano de dupla listagem no Brasil (B3) e nos EUA (New York Stock Exchange) com o
objetivo de aumentar o valor de mercado da Companhia, atraindo um público mais amplo de
investidores, e ampliar sua capacidade de investimento.
• A Companhia obteve junto a SEC (Securities and Exchange Commission) a efetividade para o
registro de suas onze Notas Sêniores.
• Pagamento de dividendos intermediários no valor de R$2,2 bilhões, representando R$1 por
ação, que poderão ser imputados aos dividendos mínimos obrigatórios referentes ao exercício
social de 2023.
DESTAQUES OPERACIONAIS E FINANCEIROS EM IFRS
DESTAQUES DO 2T23
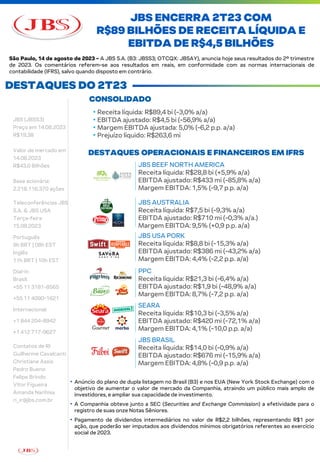
JBS ENCERRA 2T23 COM
R$89 BILHÕES DE RECEITA LÍQUIDA E
EBITDA DE R$4,5 BILHÕES
São Paulo, 14 de agosto de 2023 – A JBS S.A. (B3: JBSS3; OTCQX: JBSAY), anuncia hoje seus resultados do 2º trimestre
de 2023. Os comentários referem-se aos resultados em reais, em conformidade com as normas internacionais de
contabilidade (IFRS), salvo quando disposto em contrário.
JBS (JBSS3)
Preço em 14.08.2023
R$19,38
Valor de mercado em
14.08.2023
R$43,0 Bilhões
Base acionária:
2.218.116.370 ações
Teleconferências JBS
S.A. & JBS USA
Terça-feira
15.08.2023
Português
9h BRT | 08h EST
Inglês
11h BRT | 10h EST
Dial-in
Brasil:
+55 11 3181-8565
+55 11 4090-1621
Internacional:
+1 844 204-8942
+1 412 717-9627
Contatos de RI
Guilherme Cavalcanti
Christiane Assis
Pedro Bueno
Felipe Brindo
Vitor Figueira
Amanda Narihisa
ri_ir@jbs.com.br
JBS BEEF NORTH AMERICA
Receita líquida: R$28,8 bi (+5,9% a/a)
EBITDA ajustado: R$433 mi (-85,8% a/a)
Margem EBITDA: 1,5% (-9,7 p.p. a/a)
JBS USA PORK
Receita líquida: R$8,8 bi (-15,3% a/a)
EBITDA ajustado: R$386 mi (-43,2% a/a)
Margem EBITDA: 4,4% (-2,2 p.p. a/a)
PPC
Receita líquida: R$21,3 bi (-6,4% a/a)
EBITDA ajustado: R$1,9 bi (-48,9% a/a)
Margem EBITDA: 8,7% (-7,2 p.p. a/a)
SEARA
Receita líquida: R$10,3 bi (-3,5% a/a)
EBITDA ajustado: R$420 mi (-72,1% a/a)
Margem EBITDA: 4,1% (-10,0 p.p. a/a)
JBS BRASIL
Receita líquida: R$14,0 bi (-0,9% a/a)
EBITDA ajustado: R$676 mi (-15,9% a/a)
Margem EBITDA: 4,8% (-0,9 p.p. a/a)
JBS AUSTRALIA
Receita líquida: R$7,5 bi (-9,3% a/a)
EBITDA ajustado: R$710 mi (-0,3% a/a.)
Margem EBITDA: 9,5% (+0,9 p.p. a/a)
• Receita líquida: R$89,4 bi (-3,0% a/a)
• EBITDA ajustado: R$4,5 bi (-56,9% a/a)
• Margem EBITDA ajustada: 5,0% (-6,2 p.p. a/a)
• Prejuízo líquido: R$263,6 mi
2. Diante de um quadro de aumento de oferta de aves no mercado global e margens mais apertadas
no negócio de bovinos nos Estados Unidos, executamos no segundo trimestre uma série de
medidas com vistas a aumentar a eficiência de nossos negócios no Brasil e nos Estados Unidos.
Essas iniciativas já começaram a surtir efeito em nossas operações, como demonstram a melhora
das nossas margens, reforçando a nossa crença de que devemos focar naquilo que controlamos
para termos um desempenho financeiro superior em cenários desafiadores como o atual para a
indústria global de proteínas.
Para os próximos meses, observamos também um cenário de maior equilíbrio na oferta de aves,
com potencial positivo nos preços do setor, e já estamos capturando em nossa estrutura de
custos a queda dos preços do milho, condição que também beneficia o negócio de suínos.
Os resultados na Austrália demonstram a melhora no ciclo da oferta de gado, o que se reflete no
aumento da nossa margem na região, que atingiu 9,5%. No Brasil, no segmento de carne bovina, o
trabalho consistente de expansão das vendas de produtos de maior valor agregado, o
fortalecimento da parceria com fornecedores e clientes, o aumento da demanda interna e a
abertura de novos mercados no exterior reforçam a nossa percepção de um cenário positivo para
os próximos trimestres. Nos Estados Unidos, os desafios desse segmento devem se manter.
Mesmo com os desafios de mercado, investindo na expansão das nossas operações e distribuindo
R$ 2,2 bilhões em dividendos, mantivemos a nossa dívida líquida em dólar estável em relação ao
primeiro trimestre de 2023. Estamos preparados para atravessar com segurança o atual cenário, já
que alongamos o prazo médio de nossas dívidas, ampliamos a liquidez e reduzimos o custo do
nosso endividamento.
Esses fatores reforçam também a nossa visão de que a JBS tem uma condição única na indústria
global de proteínas, e acreditamos que ainda não capturamos todo o valor que essa plataforma
oferece. Por isso, entendemos que a nossa proposta de Dupla Listagem, anunciada neste
trimestre, é um movimento transformacional para construir as novas avenidas de crescimento da
Companhia.
Nossa estratégia de Dupla Listagem nos dará mais flexibilidade para financiar o nosso crescimento
e nos desalavancar, além de reduzir o custo de capital. Teremos acesso a uma base mais ampla de
investidores, com grande capacidade financeira, favorecendo o destravamento de valor das
nossas ações e ampliando nossa capacidade de investimento.
Com o registro dos nossos bonds nos Estados Unidos, já somos uma empresa regulada pela
Securities and Exchange Commission (SEC) e também divulgaremos os nossos resultados em
dólar. Isso vai ao encontro do anseio dos nossos investidores para facilitar a comparação da nossa
performance com a dos nossos pares internacionais, além de refletir melhor a estrutura
operacional da Companhia, que tem a maior parte do seu faturamento em dólares.
No momento em que a JBS completa 70 anos, olhamos para o futuro com a segurança de que
nossa plataforma global, aliada à nossa cultura e time, nos permitirão continuar a gerar valor para
todos os stakeholders, e a criar oportunidades para as comunidades onde atuamos e para nossos
mais de 260.000 colaboradores ao redor do mundo.
Gilberto Tomazoni, CEO Global JBS
2
MENSAGEM DO PRESIDENTE
Os resultados deste segundo trimestre de 2023 mostraram mais uma vez a
força da nossa plataforma global diversificada e a nossa capacidade e
agilidade para implementar medidas de gestão operacional para aprimorar
nossa performance comercial e industrial mesmo em um cenário adverso.
Nossas perspectivas mais promissoras ao longo de 2023 começaram a se
materializar. Ainda que o contexto global permaneça desafiador para o setor
de proteínas, temos a convicção de que iniciamos uma trajetória gradual de
recuperação de nossas margens.
4. RECEITA LÍQUIDA
EBITDA AJUSTADO
4
RESULTADOS CONSOLIDADOS 2T23
RESULTADOS CONSOLIDADOS
No 2T23, a JBS registrou uma receita líquida consolidada de R$89,4 bilhões, o que representa
uma queda de 3% em relação ao 2T22.
No período, cerca de 74% das vendas globais da JBS foram realizadas nos mercados
domésticos em que a Companhia atua e 26% por meio de exportações.
Nos últimos 12 meses, a receita líquida atingiu R$367,9 bilhões (US$71,3 bilhões).
No 2T23, o EBITDA ajustado da JBS foi de R$4,5 bilhões, uma queda de 57%, dado uma base
comparativa muito forte divulgada no 2T22, mas apresentou uma importante melhora em
relação ao trimestre anterior. No trimestre, a margem EBITDA ajustada foi de 5,0%.
Nos últimos 12 meses, o EBITDA ajustado atingiu R$20,8 bilhões (U$4,0 bilhões), com margem
EBITDA ajustada de 5,6%.
R$ Milhões 2T23 1T23 ∆% 2T22 ∆% LTM 2T23
Lucro líquido do exercício (incluindo participação dos minoritários) (198,2) (1.429,5) - 4.284,1 - 4.850,7
Resultado financeiro líquido 1.667,9 1.554,1 7,3% 2.512,2 -33,6% 6.852,0
Imposto de renda e contribuição social - corrente e diferido 70,1 (719,4) - 922,5 -92,4% (1.263,4)
Depreciação e amortização 2.657,5 2.592,8 2,5% 2.353,9 12,9% 10.314,2
Resultado de equivalência patrimonial (15,0) (14,4) 4,1% (20,9) -28,1% (53,9)
(=) EBITDA 4.182,3 1.983,6 110,8% 10.051,8 -58,4% 20.699,6
Outras receitas / despesas operacionais 170,9 42,7 300,6% 33,8 405,9% 76,7
Indenização seguro PPC 0,0 (99,1) - 0,0 - (99,1)
Reestruturação PPC Europa 0,0 41,7 - 0,0 - 41,7
Impairment ativos Planterra 4,5 108,2 -95,8% 0,0 - 112,7
Indenização líquida da J&F* 0,0 0,0 - 0,0 - (492,9)
Acordos antitruste 89,1 71,2 25,2% 238,6 -62,6% 349,3
Fundo JBS pela Amazônia 0,0 0,0 - 0,0 - 2,5
Doações e programas sociais 23,1 14,2 62,5% 39,2 -41,2% 62,2
(=) EBITDA Ajustado 4.470,0 2.162,4 106,7% 10.363,4 -56,9% 20.752,6
* Valor líquido de PIS/COFINS
∆% ∆%
R$ Milhões R$ % ROL R$ % ROL 2T23 vs 1T23 R$ % ROL 2T23 vs 2T22 R$ % ROL
Receita Líquida 89.382,6 100,0% 86.683,7 100,0% 3,1% 92.191,4 100,0% -3,0% 367.860,0 100,0%
Custo dos produtos vendidos (79.495,2) -88,9% (79.069,6) -91,2% 0,5% (76.002,9) -82,4% 4,6% (323.434,5) -87,9%
Lucro bruto 9.887,5 11,1% 7.614,2 8,8% 29,9% 16.188,5 17,6% -38,9% 44.425,6 12,1%
Despesas com vendas (5.678,7) -6,4% (5.775,3) -6,7% -1,7% (5.709,4) -6,2% -0,5% (24.174,9) -6,6%
Despesas adm. e gerais (2.529,3) -2,8% (2.670,8) -3,1% -5,3% (2.773,6) -3,0% -8,8% (11.080,0) -3,0%
Resultado financeiro líquido (1.667,9) -1,9% (1.554,1) -1,8% 7,3% (2.512,2) -2,7% -33,6% (6.852,0) -1,9%
Resultado de equivalência patrimonial 15,0 0,0% 14,4 0,0% 4,1% 20,9 0,0% -28,1% 53,9 0,0%
Outras receitas (despesas) (154,6) -0,2% 222,8 0,3% - (7,7) 0,0% 1912,7% 1.214,7 0,3%
Resultado antes do IR e CS (128,1) -0,1% (2.148,9) -2,5% -94,0% 5.206,5 5,6% - 3.587,2 1,0%
Imposto de renda e contribuição social (70,1) -0,1% 719,4 0,8% - (922,5) -1,0% -92,4% 1.263,4 0,3%
Participação dos acionistas não controladores (65,5) -0,1% (23,1) 0,0% 183,3% (331,8) -0,4% -80,3% (203,6) -0,1%
Lucro líquido/prejuízo (263,6) -0,3% (1.452,6) -1,7% -81,9% 3.952,3 4,3% -106,7% 4.647,1 1,3%
EBITDA Ajustado 4.470,0 5,0% 2.162,4 2,5% 106,7% 10.363,4 11,2% -56,9% 20.752,6 5,6%
Lucro por ação (R$) n.m. n.m. - 1,78 - 2,10
2T23 1T23 2T22 LTM 2T23
5. 5
RESULTADO LÍQUIDO
FLUXO DE CAIXA OPERACIONAL E LIVRE
FLUXO DE CAIXA DAS ATIVIDADES DE INVESTIMENTOS
RESULTADOS CONSOLIDADOS 2T23
RESULTADO FINANCEIRO LÍQUIDO
¹Incluidespesa dejuros sobre empréstimos e financiamentosincluídosna rubrica de juros passivos,e juros sobre aplicações financeirasincluídos na rubrica de juros ativos.
No 2T23, o valor total do fluxo de caixa das atividades de investimentos da JBS foi de R$1,8 bilhão,
sendo o principal investimento a adição de ativos imobilizados (CAPEX) no montante de R$2,0 bilhões
no trimestre.
No 2T23, a JBS registrou um prejuízo líquido de R$263,6 milhões.
No 2T23, a despesa financeira da dívida líquida foi de R$1,3 bilhão, valor que corresponde a
US$265 milhões.
No 2T23, o fluxo de caixa das atividades operacionais foi de R$5,3 bilhões, uma importante
evolução quando comparado ao trimestre anterior. O fluxo de caixa livre, após adição de
ativo imobilizado, juros pagos e recebidos, foi de R$1,8 bilhão, com destaque para a melhora
no capital de giro em US$355 milhões, principalmente por conta da redução dos estoques e
na melhora em contas a receber.
R$ Milhões 2T23 1T23 ∆% 2T22 ∆% LTM 2T23
Resultado de variações cambiais ativas e passivas 16,7 280,2 -94,0% (503,0) - 354,5
Ajuste a valor justo de derivativos 75,2 (76,5) - (41,7) - (546,8)
Juros Passivos¹ (2.092,2) (2.052,6) 1,9% (1.709,4) 22,4% (7.785,7)
Juros Ativos¹ 394,2 351,3 12,2% 313,1 25,9% 1.557,5
Impostos, contribuições, tarifas e outros (61,8) (56,4) 9,4% (571,3) -89,2% (431,6)
Resultado financeiro líquido (1.667,9) (1.554,1) 7,3% (2.512,2) -33,6% (6.852,0)
Juros sobre empréstimos e financiamentos (1.409,4) (1.457,9) -3,3% (1.175,4) 19,9% (5.313,9)
Juros sobre aplicação financeira 98,4 90,7 8,4% 90,9 8,2% 380,1
Despesa financeira da dívida líquida¹ (1.311,0) (1.367,2) -4,1% (1.084,4) 20,9% (4.933,9)
6. 2T23 1T23 ∆% 2T22 ∆% 2T23 1T23 ∆% 2T22 ∆%
Dívida bruta 93.799,0 92.710,8 1,2% 97.415,5 -3,7% 19.463,6 18.248,7 6,7% 18.597,8 4,7%
(+) Curto prazo 10.685,6 10.034,5 6,5% 12.711,3 -15,9% 2.217,3 1.975,1 12,3% 2.426,7 -8,6%
% sobre Dívida Bruta 11,4% 10,8% 13,0% 11,4% 10,8% 13,0%
(+) Longo prazo 83.113,4 82.676,3 0,5% 84.704,3 -1,9% 17.246,3 16.273,6 6,0% 16.171,1 6,6%
% sobre Dívida Bruta 88,6% 89,2% 87,0% 88,6% 89,2% 87,0%
(-) Caixa e Equivalentes 13.548,7 8.964,7 51,1% 19.330,4 -29,9% 2.811,4 1.764,6 59,3% 3.690,4 -23,8%
Dívida líquida 80.250,3 83.746,1 -4,2% 78.085,1 2,8% 16.652,2 16.484,2 1,0% 14.907,4 11,7%
Alavancagem 3,87x 3,14x 1,64x 4,15x 3,16x 1,65x
R$ Milhões US$ Milhões
6
BRIDGE DÍVIDA LÍQUIDA
A dívida líquida apresentou um ligeiro aumento de US$168 milhões, apesar do pagamento de
dividendos no montante de US$448 milhões, da manutenção do plano de Capex em US$394
milhões; e dos juros provisionados de US$263 milhões. Contudo, esses valores foram
compensados pelo EBITDA ajustado de US$903 milhões e a melhora no capital de giro em
US$355 milhões, conforme gráfico acima.
ENDIVIDAMENTO
(US$ milhões)
3,16x
(903)
4,15x
RESULTADOS CONSOLIDADOS 2T23
A JBS encerrou o trimestre com R$13,5 bilhões em caixa e possui US$3,3 bilhões disponíveis
em linhas de crédito rotativas, sem garantia real, sendo US$2,9 bilhões na JBS USA e US$450
milhões na JBS Brasil, equivalentes a R$15,9 bilhões pelo câmbio de fechamento do período.
Assim, disponibilidade total da Companhia é de R$29,4 bilhões.
No fechamento do 2T23, a dívida líquida ficou em US$16,7 bilhões (R$80,3 bilhões) um
aumento de US$168 milhões ou 1% quando comparado ao fechamento do 1T23. A JBS
encerrou o trimestre com uma alavancagem em reais de 3,87x e em dólares de 4,15x fruto da
redução do EBITDA no período.
7. USD²
86,7%
BRL
13,3%
7
13,47% a.a.
5,00% a.a.
Cronograma de Amortização
da Dívida (US$ Milhões)¹
Bonds
75%
Bancos
Comerciais
16%
CRA
9%
ENDIVIDAMENTO PROFORMA
ABERTURA
POR FONTE
ABERTURA POR
MOEDA E CUSTO
¹ Inclui recursos disponíveis em caixa e linhas de crédito rotativas e garantidas da JBS USA e JBS Brasil
² Inclui dívidas em outras moedas, como Euros e dólares canadenses
6,13% a.a.
Caixa e
equivalentes
Linhas de crédito rotativas
USD 2.850mi nos EUA
Linhas de crédito rotativas
USD 450mi no Brasil
Prazo médio = 9,3 anos
Custo médio = 6,13% a.a.
RESULTADOS CONSOLIDADOS 2T23
2.811
2.217
298 377
163
2.064
1.081
755
1.786
1.890
2.930 2.983
505
2.414
2.850
450
Caixa e
Equivalentes
Caixa
Curto Prazo 2024 2025 2026 2027 2028 2029 2030 2031 2032 2033 2034... ...2052
8. 8
UNIDADES DE NEGÓCIOS 2T23
UNIDADES DE NEGÓCIOS – IFRS R$
UNIDADES DE NEGÓCIOS – USGAAP US$
Milhões 2T23 1T23 ∆% 2T22 ∆% LTM 2T23
Receita Líquida
Seara R$ 10.310,4 10.329,6 -0,2% 10.680,1 -3,5% 43.439,9
JBS Brasil R$ 13.986,2 12.199,6 14,6% 14.108,1 -0,9% 56.697,3
JBS Beef North America R$ 28.770,2 27.356,8 5,2% 27.170,1 5,9% 113.946,2
JBS Australia R$ 7.471,4 7.244,9 3,1% 8.239,2 -9,3% 31.689,2
JBS USA Pork R$ 8.798,0 9.392,6 -6,3% 10.388,9 -15,3% 39.940,9
Pilgrim's Pride R$ 21.314,7 21.620,6 -1,4% 22.775,0 -6,4% 88.051,8
Outros R$ 1.272,2 1.270,4 0,1% 1.160,2 9,6% 4.727,8
Eliminações R$ -2.540,5 -2.730,9 -7,0% -2.330,3 9,0% -10.633,1
Total R$ 89.382,6 86.683,7 3,1% 92.191,4 -3,0% 367.860,0
EBITDA Ajustado
Seara R$ 419,9 147,0 185,7% 1.505,4 -72,1% 3.051,0
JBS Brasil R$ 675,7 296,6 127,8% 803,2 -15,9% 2.137,8
JBS Beef North America R$ 433,5 115,8 274,2% 3.051,1 -85,8% 4.101,8
JBS Australia R$ 710,4 -17,7 - 712,3 -0,3% 1.817,2
JBS USA Pork R$ 386,3 231,7 66,8% 679,8 -43,2% 2.627,4
Pilgrim's Pride R$ 1.858,5 1.395,8 33,1% 3.635,7 -48,9% 7.102,0
Outros R$ -11,3 -3,8 196,4% -21,4 -47,3% -72,9
Eliminações R$ -3,0 -3,0 0,0% -2,7 10,2% -11,8
Total R$ 4.470,0 2.162,4 106,7% 10.363,4 -56,9% 20.752,7
Margem EBITDA Ajustada
Seara % 4,1% 1,4% 2,6 p.p. 14,1% -10,0 p.p. 7,0%
JBS Brasil % 4,8% 2,4% 2,4 p.p. 5,7% -0,9 p.p. 3,8%
JBS Beef North America % 1,5% 0,4% 1,1 p.p. 11,2% -9,7 p.p. 3,6%
JBS Australia % 9,5% -0,2% 9,8 p.p. 8,6% 0,9 p.p. 5,7%
JBS USA Pork % 4,4% 2,5% 1,9 p.p. 6,5% -2,2 p.p. 6,6%
Pilgrim's Pride % 8,7% 6,5% 2,3 p.p. 16,0% -7,2 p.p. 8,1%
Outros % -0,9% -0,3% -0,6 p.p. -1,8% 1,0 p.p. -1,5%
Total % 5,0% 2,5% 2,5 p.p. 11,2% -6,2 p.p. 5,6%
Milhões 2T23 1T23 ∆% 2T22 ∆% LTM 2T23
Receita Líquida
JBS Beef North America US$ 5.810,6 5.266,4 10,3% 5.521,5 5,2% 22.084,7
JBS Australia US$ 1.509,0 1.394,7 8,2% 1.674,3 -9,9% 6.135,1
JBS USA Pork US$ 1.776,9 1.808,1 -1,7% 2.111,2 -15,8% 7.725,9
Pilgrim's Pride US$ 4.308,1 4.165,6 3,4% 4.631,6 -7,0% 17.070,1
Adjusted EBITDA
JBS Beef North America US$ 83,4 -23,2 - 624,3 -86,6% 576,1
JBS Australia US$ 129,5 18,5 600,0% 106,0 22,2% 285,9
JBS USA Pork US$ 27,0 66,4 -59,3% 213,6 -87,4% 282,6
Pilgrim's Pride US$ 248,7 151,9 63,7% 623,3 -60,1% 924,0
Adjusted EBITDA Margin
JBS Beef North America % 1,4% -0,4% 1,9 p.p. 11,3% -9,9 p.p. 2,6%
JBS Australia % 8,6% 1,3% 7,3 p.p. 6,3% 2,3 p.p. 4,7%
JBS USA Pork % 1,5% 3,7% -2,2 p.p. 10,1% -8,6 p.p. 3,7%
Pilgrim's Pride % 5,8% 3,6% 2,1 p.p. 13,5% -7,7 p.p. 5,4%
9. No 2T23, a Seara registrou receita líquida de R$10,3 bilhões, uma queda de 3% em relação ao
2T22, como reflexo da menor receita líquida na exportação. O EBITDA ajustado atingiu R$420
milhões, com 4,1% de margem EBITDA, que continua pressionada pela sobre oferta global de
aves. Por outro lado, observa-se uma melhora sequencial, como consequência da correção dos
problemas operacionais enfrentados nos trimestres anteriores.
No mercado externo, a receita líquida em dólares foi de US$1,1 bilhão, o que representa uma
queda de 7% em relação ao 2T22, dado a queda nos preços médios em dólares em 14% a/a,
mas que foi parcialmente compensada pelo crescimento de 8% nos volumes vendidos.
Conforme mencionado anteriormente, a queda do preço foi resultado do excesso de oferta
de aves global, que continua a impactar os preços em dólares.
As vendas no mercado doméstico totalizaram R$5,1 bilhões, permanecendo estável em relação
ao 2T22. O excesso de oferta de frango pressionou o crescimento dos preços no mercado
interno. Em linha com a estratégia de investir em inovação, variedade e qualidade, a Seara
inaugurou em março a nova planta de empanados de frango em Rolândia, a maior da América
Latina. Apesar de ainda estar em fase de maturação, essa planta está em ritmo acelerado de
produção, e com bom desempenho de vendas. A Seara também lançou a nova linha sabor do dia
a dia, pratos prontos com receitas do cotidiano do consumidor brasileiro. E por fim, a extensão
da linha do frango de padaria.
Os investimentos na marca Seara seguem trazendo resultados positivos para a Companhia.
Além de se consolidar como a marca mais presente nos lares brasileiros em diversas
categorias, é a marca que mais cresceu em penetração e recompra entre 2T22 e 2T23.
9
SEARA
UNIDADES DE NEGÓCIOS 2T23
∆% ∆%
R$ % ROL R$ % ROL QoQ R$ % ROL YoY R$ % ROL
Receita Líquida 10.310,4 100,0% 10.329,6 100,0% -0,2% 10.680,1 100,0% -3,5% 43.439,9 100,0%
Custo dos produtos vendidos (8.817,6) -85,5% (9.141,7) -88,5% -3,5% (8.082,2) -75,7% 9,1% (36.005,1) -82,9%
Lucro bruto 1.492,8 14,5% 1.187,9 11,5% 25,7% 2.597,9 24,3% -42,5% 7.434,8 17,1%
EBITDA Ajustado 419,9 4,1% 147,0 1,4% 185,7% 1.505,4 14,1% -72,1% 3.051,0 7,0%
IFRS - R$ Milhões
LTM 2T23
2T23 1T23 2T22
10. No 2T23, a JBS Brasil registrou uma receita líquida de R$14,0 bilhões, estável em relação ao ano
anterior, mas com um crescimento de 15% na comparação trimestral.
No mercado externo, a receita líquida em dólares da carne bovina in natura subiu 10% quando
comparado ao 2T22, como resultado do maior volume exportado. Após a confirmação de um
caso atípico de BSE no estado de Pará, o ministério da Agricultura e Pecuária brasileiro
promoveu o auto embargo nas exportações de carne bovina para a China durante o 1T23. O
Brasil ficou sem exportar por aproximadamente um mês naquele trimestre. Portanto, o 2T23
refletiu a retomada das importações da China no período. Além disso, o ciclo favorável pecuário
e a maior demanda internacional pela carne brasileira na comparação anual também impactaram
positivamente as vendas.
No mercado doméstico, a receita na categoria de carne bovina in natura cresceu 2% na
comparação anual, impactada pelo aumento do volume vendido. Esse crescimento é atribuído à
maior disponibilidade de animais disponíveis para abate e ao contínuo foco na melhoria da
execução comercial e na expansão do mix de produtos de maior valor agregado.
O EBITDA totalizou R$675,7 milhões, com margem EBITDA de 4,8% no 2T23. Segundo dados
publicados pelo CEPEA-ESALQ, o preço do gado vivo durante o trimestre foi de
aproximadamente R$266/arroba, 7% menor na comparação trimestral, também contribuindo
para a melhora da rentabilidade quando comparado ao trimestre anterior.
10
JBS BRASIL
Nota: Em 1 de março de 2020, através de um processo de reestruturação societária, as lojas Swift foram transferidas para a subsidiária direta
Seara Alimentos. Apesar das lojas Swift estarem na estrutura societária da Seara Alimentos, para fins de análise e apresentação de resultados, a
Administração da Companhia decidiu alocar os resultados da Swift no segmento operacional JBS Brasil.
UNIDADES DE NEGÓCIOS 2T23
∆% ∆%
R$ % ROL R$ % ROL QoQ R$ % ROL YoY R$ % ROL
Receita Líquida 13.986,2 100,0% 12.199,6 100,0% 14,6% 14.108,1 100,0% -0,9% 56.697,3 100,0%
Custo dos produtos vendidos (11.852,9) -84,7% (10.604,2) -86,9% 11,8% (11.839,5) -83,9% 0,1% (48.353,7) -85,3%
Lucro bruto 2.133,3 15,3% 1.595,4 13,1% 33,7% 2.268,7 16,1% -6,0% 8.343,6 14,7%
EBITDA Ajustado 675,7 4,8% 296,6 2,4% 127,8% 803,2 5,7% -15,9% 2.137,8 3,8%
1T23 2T22
IFRS - R$ Milhões
2T23 LTM 2T23
11. ¹A diferença no EBITDA da JBS Beef North America em IFRS e USGAAP, além do câmbio, se deve aos impactos da adoção do IFRS 16 a partir do
1T19 e a critérios diferentes de contabilização dos estoques: em IFRS os estoques são contabilizados a custo médio, enquanto em USGAAP
são marcados a mercado. Cálculo de volume e preço não consideram impacto de aquisições.
11
JBS BEEF NORTH AMERICA
UNIDADES DE NEGÓCIOS 2T23
Em IFRS e reais, a receita líquida no 2T23 foi de R$28,8 bilhões, um aumento de 6% em relação
ao 2T22, com um EBITDA ajustado de R$433,5 milhões, e uma margem EBITDA ajustada de
1,5%. Esses resultados incluem o impacto da depreciação de 0,6% do câmbio médio, que foi de
R$4,92 no 2T22 para R$4,95 no 2T23.
Em USGAAP e US$, a receita líquida foi de US$5,8 bilhões, um aumento de 5% comparado ao
2T22 e o EBITDA ajustado foi de US$83,4 milhões, com margem de 1,4%.
No trimestre, as margens de carne bovina na América do Norte sofreram impacto relevante em
relação ao ano anterior, como consequência do ciclo de gado na região, reduzindo a
disponibilidade de animais para abate e aumentando o custo. Por outro lado, a melhora
sequencial na rentabilidade foi reflexo da sazonalidade favorável do período, além de melhorias
na nossa operação. No trimestre, de acordo com o USDA, os preços do boi gordo
permaneceram em patamares elevados, crescendo 26% a/a no 2T23 para US$179/cwt,
enquanto os preços da carne bovina no atacado cresceram 17% a/a no mesmo período.
No acumulado do ano as exportações de carne bovina dos EUA caíram 11% a/a, de acordo com
o USDA, principalmente por conta da restrição da oferta e menor demanda asiática. Os 3
principais destinos dos EUA continuam sendo Coréia do Sul, Japão e China.
É importante ressaltar que, mesmo em um cenário mais desafiador para a indústria, a JBS
continuou concentrando seus esforços em melhorar a performance comercial e operacional, já
capturando ganhos de eficiência em diversas frentes.
∆% ∆%
R$ % ROL R$ % ROL QoQ R$ % ROL YoY R$ % ROL
Receita Líquida 28.770,2 100,0% 27.356,8 100,0% 5,2% 27.170,1 100,0% 5,9% 113.946,2 100,0%
Custo dos produtos vendidos (27.138,0) -94,3% (25.909,7) -94,7% 4,7% (22.781,6) -83,8% 19,1% (104.241,4) -91,5%
Lucro bruto 1.632,2 5,7% 1.447,2 5,3% 12,8% 4.388,5 16,2% -62,8% 9.704,8 8,5%
EBITDA Ajustado 433,5 1,5% 115,8 0,4% 274,2% 3.051,1 11,2% -85,8% 4.101,8 3,6%
LTM 2T23
2T22
IFRS - R$ Milhões
2T23 1T23
∆% ∆%
US$ % ROL US$ % ROL QoQ US$ % ROL YoY US$ % ROL
Receita Líquida 5.810,6 100,0% 5.266,4 100,0% 10,3% 5.521,5 100,0% 5,2% 22.084,7 100,0%
Custo dos produtos vendidos (5.693,8) -98,0% (5.246,9) -99,6% 8,5% (4.869,1) -88,2% 16,9% (21.326,8) -96,6%
Lucro bruto 116,8 2,0% 19,5 0,4% 498,7% 652,4 11,8% -82,1% 757,8 3,4%
EBITDA Ajustado 83,4 1,4% (23,2) -0,4% n.m. 624,3 11,3% -86,6% 576,1 2,6%
USGAAP¹ - US$ Milhões
2T23 1T23 2T22 LTM 2T23
12. ¹A diferença no EBITDA da JBS Australia em IFRS e USGAAP, além do câmbio, se deve aos impactos da adoção do IFRS 16 a partir do 1T19 e a
critérios diferentes de contabilização dos ativos biológicos, em IFRS estão marcados a mercado, enquanto em USGAAP estão a custo médio.
Cálculo de volume e preço não consideram impacto de aquisições.
12
JBS AUSTRALIA
UNIDADES DE NEGÓCIOS 2T23
Considerando os resultados em IFRS e reais, a receita líquida no 2T23 foi de R$7,5 bilhões (-9%
a/a) e o EBITDA ajustado foi de R$710,4 milhões, com uma margem EBITDA de 9,5%. Esses
resultados incluem o impacto da depreciação de 0,6% do câmbio médio, que foi de R$4,92 no
2T22 para R$4,95 no 2T23.
Em USGAAP e US$, a receita líquida foi de US$1,5 bilhão (-10% a/a) no 2T23. No trimestre, o
EBITDA ajustado foi de US$129,5 milhões no 2T23, com margem EBITDA de 8,6%.
As vendas no mercado interno, que representaram 36% da receita total no trimestre, foram
5% superiores ao 2T22, impulsionado pelo maior crescimento do volume vendido. No mercado
externo, a receita líquida reduziu 7% em relação ao 2T22, como reflexo dos preços no mercado
asiático mais fraco, mas que foi parcialmente compensado por um crescimento nas vendas
para a China.
O volume do negócio de carne bovina cresceu 8% comparado ao 2T22, dado o crescimento da
exportação. Adicionalmente, a melhora na margem EBITDA também reflete o menor preço de
aquisição do gado, dado a maior disponibilidade de animais em função do ciclo mais favorável.
O negócio de aquicultura segue crescendo, impactado por uma maior demanda, que acabou
refletido em preços melhores.
A receita líquida do negócio de suínos cresceu como reflexo do programa de melhoria da
sanidade do rebanho, impactando positivamente os volumes.
A Primo, unidade de alimentos preparados, registrou aumento de 4% na receita líquida como
resultado do aumento preço.
∆% ∆%
US$ % ROL US$ % ROL QoQ US$ % ROL YoY US$ % ROL
Receita Líquida 1.509,0 100,0% 1.394,7 100,0% 8,2% 1.674,3 100,0% -9,9% 6.135,1 100,0%
Custo dos produtos vendidos (1.363,8) -90,4% (1.357,4) -97,3% 0,5% (1.546,0) -92,3% -11,8% (5.780,7) -94,2%
Lucro bruto 145,2 9,6% 37,3 2,7% 289,2% 128,3 7,7% 13,1% 354,4 5,8%
EBITDA Ajustado 129,5 8,6% 18,5 1,3% 600,0% 106,0 6,3% 22,2% 285,9 4,7%
LTM 2T23
USGAAP¹ - US$ Milhões
2T23 1T23 2T22
∆% ∆%
R$ % ROL R$ % ROL QoQ R$ % ROL YoY R$ % ROL
Receita Líquida 7.471,4 100,0% 7.244,9 100,0% 3,1% 8.239,2 100,0% -9,3% 31.689,2 100,0%
Custo dos produtos vendidos (6.372,4) -85,3% (6.848,6) -94,5% -7,0% (7.111,5) -86,3% -10,4% (28.188,0) -89,0%
Lucro bruto 1.099,0 14,7% 396,4 5,5% 177,3% 1.127,7 13,7% -2,5% 3.501,2 11,0%
EBITDA Ajustado 710,4 9,5% (17,7) -0,2% n.m. 712,3 8,6% -0,3% 1.817,2 5,7%
LTM 2T23
IFRS - R$ Milhões
2T23 1T23 2T22
13. Em IFRS e reais, a receita líquida no 2T23 foi de R$8,8 bilhões, 15% menor que o 2T22 e o
EBITDA ajustado foi de R$386 milhões, com margem EBITDA ajustada de 4,4%. Esses
resultados incluem o impacto da depreciação de 0,6% do câmbio médio, que foi de R$4,92 no
2T22 para R$4,95 no 2T23.
Em USGAAP e US$, a receita líquida foi de US$1,8 bilhão, uma queda de 16% comparado ao
2T22, com EBITDA ajustado de US$27 milhões e margem de 1,5%. A principal diferença neste
trimestre entre o EBITDA em USGAAP e IFRS se deu pelo impacto da contabilização dos
estoques pelo valor a mercado em USGAAP e pelo custo médio em IFRS.
No mercado doméstico, os preços da carne suína no atacado caíram aproximadamente 21% a/a
no 2T23, ainda como reflexo do excesso de oferta. Contudo, de acordo com o USDA, a
produção de carne suína já apresentou uma leve queda (-0,4% a/a), enquanto os níveis de
estoques do setor seguem em tendência de queda. Na comparação entre junho e abril, o pico
do ano, a queda nos estoques foram de aproximadamente 14%.
No mercado internacional, os dados do USDA acumulados para o ano indicam um aumento de
exportações de carne suína em 10%, especialmente para a China, a Coreia do Sul e o México.
Os preços ainda baixos no mercado interno e a menor exportação de regiões produtoras
importantes, como a Europa, estão sustentando esse crescimento.
¹A diferença no EBITDA da JBS USA Pork em IFRS e USGAAP, além do câmbio, se deve aos impactos da adoção do IFRS 16 a partir do 1T19 e a critérios diferentes de
contabilização. Em IFRS os ativos biológicos são marcados a mercado e os estoques são contabilizados a custo médio, enquanto no USGAAP os ativos biológicos são
mantidos a custo médio e os estoques marcados a mercado. Cálculo de volume e preço não consideram impacto de aquisições.
13
JBS USA PORK
UNIDADES DE NEGÓCIOS 2T23
∆% ∆%
US$ % ROL US$ % ROL QoQ US$ % ROL YoY US$ % ROL
Receita Líquida 1.776,9 100,0% 1.808,1 100,0% -1,7% 2.111,2 100,0% -15,8% 7.725,9 100,0%
Custo dos produtos vendidos (1.750,0) -98,5% (1.730,0) -95,7% 1,2% (1.911,8) -90,6% -8,5% (7.420,9) -96,1%
Lucro bruto 26,9 1,5% 78,1 4,3% -65,6% 199,4 9,4% -86,5% 305,0 3,9%
EBITDA Ajustado 27,0 1,5% 66,4 3,7% -59,3% 213,6 10,1% -87,4% 282,6 3,7%
LTM 2T23
USGAAP¹ - US$ Milhões
2T23 1T23 2T22
∆% ∆%
R$ % ROL R$ % ROL QoQ R$ % ROL YoY R$ % ROL
Receita Líquida 8.798,0 100,0% 9.392,6 100,0% -6,3% 10.388,9 100,0% -15,3% 39.940,9 100,0%
Custo dos produtos vendidos (7.825,2) -88,9% (8.497,3) -90,5% -7,9% (9.217,6) -88,7% -15,1% (34.742,5) -87,0%
Lucro bruto 972,8 11,1% 895,3 9,5% 8,7% 1.171,4 11,3% -17,0% 5.198,4 13,0%
EBITDA Ajustado 386,3 4,4% 231,7 2,5% 66,8% 679,8 6,5% -43,2% 2.627,4 6,6%
2T23 1T23 2T22 LTM 2T23
IFRS - R$ Milhões
14. ¹A diferença no EBITDA entre os resultados em IFRS e USGAAP da PPC, além do câmbio, se deve aos impactos da adoção do IFRS 16 a partir do 1T19 e
a critérios diferentes de contabilização da amortização das aves matrizes: em IFRS, a amortização do ativo biológico, por seu caráter de mais longo
prazo, é considerada uma despesa passível de ajuste no EBITDA, enquanto em USGAAP a amortização do ativo biológico é contabilizada no Custo do
Produto Vendido e não é ajustada no EBITDA.
14
PILGRIM’S PRIDE CORPORATION
UNIDADES DE NEGÓCIOS 2T23
Considerando os resultados em IFRS e reais, a PPC apresentou receita líquida de R$21,3 bilhões
no 2T23, redução de 6% em relação ao 2T22, e o EBITDA ajustado de R$1,9 bilhão, com margem
EBITDA de 8,7%. Esses resultados incluem o impacto da depreciação de 0,6% do câmbio médio,
que foi de R$4,92 no 2T22 para R$4,95 no 2T23.
Em USGAAP e US$, a receita líquida da PPC no 2T23 foi de US$4,3 bilhões, 7% menor do que no
2T22, e o EBITDA ajustado foi de US$249 milhões com margem de 5,8%.
Nos Estados Unidos, apesar dos desafios contínuos nos preços dos cortes de aves que são
utilizados como matéria-prima (Big Bird), a melhora sequencial nas margens é resultado do
intenso foco na excelência operacional, da diversificação do portfólio e da oferta de produtos
de maior valor agregado, com marca. Além disso, o crescimento junto aos clientes-chave tem
sido um importante pilar para crescimento da rentabilidade nas principais categorias.
O mercado mexicano melhorou à medida que os fundamentos de oferta e demanda tornaram-
se cada vez mais equilibrados e os desafios na operação de frango vivo foram reduzidos,
enquanto continuamos a aumentar nossos programas e marcas de valor agregado.
Na Europa, seguiu-se a trajetória positiva de crescimento de margens, impulsionada pela
otimização contínua do parque fabril, esforços de recuperação de custos, consolidação das
atividades de back-office e aumentos das parceiras junto aos Clientes-chave.
∆% ∆%
US$ % ROL US$ % ROL QoQ US$ % ROL YoY US$ % ROL
Receita Líquida 4.308,1 100,0% 4.165,6 100,0% 3,4% 4.631,6 100,0% -7,0% 17.070,1 100,0%
Custo dos produtos vendidos (4.029,7) -93,5% (3.992,6) -95,8% 0,9% (3.954,9) -85,4% 1,9% (16.025,5) -93,9%
Lucro bruto 278,4 6,5% 173,0 4,2% 60,9% 676,8 14,6% -58,9% 1.044,6 6,1%
EBITDA Ajustado 248,7 5,8% 151,9 3,6% 63,7% 623,3 13,5% -60,1% 924,0 5,4%
USGAAP¹ - US$ Milhões
2T23 1T23 2T22 LTM 2T23
∆% ∆%
R$ % ROL R$ % ROL QoQ R$ % ROL YoY R$ % ROL
Receita Líquida 21.314,7 100,0% 21.620,6 100,0% -1,4% 22.775,0 100,0% -6,4% 88.051,8 100,0%
Custo dos produtos vendidos (18.846,4) -88,4% (19.620,0) -90,7% -3,9% (18.247,2) -80,1% 3,3% (78.139,2) -88,7%
Lucro bruto 2.468,2 11,6% 2.000,6 9,3% 23,4% 4.527,8 19,9% -45,5% 9.912,6 11,3%
EBITDA Ajustado 1.858,5 8,7% 1.395,8 6,5% 33,1% 3.635,7 16,0% -48,9% 7.102,0 8,1%
IFRS - R$ Milhões
2T23 1T23 2T22 LTM 2T23
16. 2T23 (%) Consolidado JBS Brasil Seara
JBS Beef North
America
JBS Australia JBS USA Pork PPC
Matéria-Prima 75,9% 87,8% 69,5% 85,8% 76,0% 72,2% 53,6%
Processamento (incluindo
insumos e embalagens)
13,0% 5,0% 19,8% 5,7% 8,7% 13,7% 30,3%
Mão de obra 11,1% 7,2% 10,8% 8,6% 15,3% 14,1% 16,1%
Grande
China¹
25,4%
África e
Oriente
Médio
13,4%
EUA
10,8%
Japão
10,5%
Coreia
do Sul
7,9%
U.E.
6,0%
Outros
26,0%
US$
4,9 bilhões
2T22
Nota
1.
Considera
China
e
Hong
Kong
16
TABELA 1- CAPEX
Grande China¹
30,3%
África e
Oriente
Médio
10,3%
Japão
8,8%
Coreia do
Sul
8,8%
EUA
8,3%
U.E.
6,6%
Outros
26,9%
US$
4,8 bilhões
2T23
GRÁFICO 1 - EXPORTAÇÕES JBS NO 2T23 E NO 2T22
TABELAS E GRÁFICOS ANEXOS
-1,7%
TABELA 2- ABERTURA DO CPV
∆% ∆%
R$ Milhões R$ % CAPEX R$ % CAPEX QoQ R$ % CAPEX YoY R$ % CAPEX
Capex Total 1.950,8 100,0% 1.718,3 100,0% 13,5% 2.629,0 100,0% -25,8% 10.078,6 100,0%
Expansão 948,8 48,6% 946,7 55,1% 0,2% 1.490,9 56,7% -36,4% 5.319,4 52,8%
Manutenção 1.002,0 51,4% 771,5 44,9% 29,9% 1.138,2 43,3% -12,0% 4.759,2 47,2%
2T23 1T23 2T22 LTM 2T23
17. 17
DEMONSTRAÇÕES FINANCEIRAS 2T23
Balanço Patrimonial
(Em milhões de reais)
Ativo Circulante 30/06/23 31/12/22
Caixa e equivalentes de caixa 12.739 13.182
Caixa margem 810 679
Contas a receber de clientes 16.665 20.235
Estoques 26.374 28.142
Ativos biológicos 8.392 9.711
Impostos a recuperar 5.089 5.331
Derivativos a receber 462 443
Outros ativos circulantes 1.718 1.668
TOTAL DO CIRCULANTE 72.248 79.391
Ativo Não-Circulante 30/06/23 31/12/22
Impostos a recuperar 8.525 9.166
Ativos biológicos 2.655 2.619
Créditos com empresas ligadas 974 951
Imposto de renda e contribuição social diferidos 3.577 3.161
Derivativos a receber 598 123
Outros ativos não circulantes 1.072 1.118
17.401 17.138
Investimentos controladas, joint ventures e coligadas 300 295
Imobilizado 61.064 62.171
Direito de uso de arrendamentos 8.295 8.375
Intangível 9.595 10.328
Ágio 29.440 30.412
TOTAL DO NÃO CIRCULANTE 126.095 128.720
TOTAL DO ATIVO 198.343 208.111
Consolidado
18. 18
DEMONSTRAÇÕES FINANCEIRAS 2T23
Balanço Patrimonial
(Em milhões de reais)
Passivo Circulante 30/06/23 31/12/22
Fornecedores 24.530 31.010
Fornecedores risco sacado 3.729 3.071
Empréstimos e financiamentos 10.686 8.229
Imposto de renda e contribuição social a pagar 149 475
Obrigações fiscais 669 726
Obrigações trabalhistas e sociais 5.347 6.251
Arrendamentos a pagar 1.693 1.788
Dividendos declarados 2 0
Provisão para riscos processuais 846 909
Derivativos a pagar 868 560
Outros passivos circulantes 2.145 2.142
TOTAL DO CIRCULANTE 50.664 55.160
Passivo Não Circulante 30/06/23 31/12/22
Empréstimos e financiamentos 83.113 84.126
Obrigações fiscais 543 606
Obrigações trabalhistas e sociais 2.521 2.379
Arrendamentos a pagar 7.213 7.196
Imposto de renda e contribuição social diferidos 6.559 7.112
Provisão para riscos processuais 1.440 1.321
Outros passivos não circulantes 542 402
TOTAL DO NÃO CIRCULANTE 101.932 103.141
Patrimônio Líquido 30/06/23 31/12/22
Capital social 23.576 23.576
Reservas de capital (792) (808)
Reserva de reavaliação 33 36
Reserva de lucros 18.653 18.653
Outros resultados abrangentes 4.816 4.886
Prejuízos acumulados (3.931) -
Atribuído à participação dos controladores 42.355 46.344
Participação dos não controladores 3.391 3.465
TOTAL DO PATRIMÔNIO LÍQUIDO 45.747 49.809
TOTAL DO PASSIVO E PATRIMÔNIO LÍQUIDO 198.343 208.111
Consolidado
19. 19
DEMONSTRAÇÕES FINANCEIRAS 2T23
Demonstrações do resultado para os trimestres findos em 30 de junho
(Em milhões de reais)
2023 2022
RECEITA LÍQUIDA 89.383 92.191
Custo dos produtos vendidos (79.495) (76.003)
LUCRO BRUTO 9.887 16.189
Administrativas e gerais (2.529) (2.774)
Com vendas (5.679) (5.709)
Outras despesas (230) (74)
Outras receitas 75 67
DESPESAS OPERACIONAIS (8.363) (8.491)
RESULTADO OPERACIONAL 1.525 7.698
Receitas financeiras 486 313
Despesas financeiras (2.154) (2.825)
(1.668) (2.512)
Resultado de equivalência patrimonial 15 21
RESULTADO ANTES DA PROVISÃO PARA IMPOSTO DE RENDA E
CONTRIBUIÇÃO SOCIAL
(128) 5.207
Imposto de renda e contribuição social corrente (158) (1.630)
Imposto de renda e contribuição social diferidos 88 708
(70) (922)
LUCRO LÍQUIDO (198) 4.284
ATRIBUÍDO A:
Participação dos controladores (264) 3.952
Participação dos não controladores 65 332
(198) 4.284
Resultado por ação ordinária (básico e diluído) - em reais n.m. 1,78
Consolidado
20. 20
DEMONSTRAÇÕES FINANCEIRAS 2T23
Demonstrações dos fluxos de caixa para os trimestres findos em 30 de junho
(Em milhões de reais)
Fluxo de caixa 2023 2022
Lucro líquido atribuído aos acionistas controladores (198) 4.284
Ajustes por:
Depreciação e amortização 2.658 2.354
Perda estimada com crédito de liquidação duvidosa 9 17
Resultado de equivalência patrimonial (15) (21)
Resultado na venda de imobilizado 15 0
Imposto de renda e contribuição social diferidos 70 922
Resultado financeiro líquido 1.668 2.512
Plano de opções de ações 12 12
Provisões para riscos processuais 109 65
Perda por ajuste ao valor recuperável 18 -
Perdas estimadas para valor realizável dos estoques (4) 13
Fair value (marcação a mercado) dos ativos biológicos 14 228
Acordos Antitruste 89 239
4.444 10.626
Variação em:
Contas a receber 1.220 (1.733)
Estoques 928 (862)
Impostos a recuperar 277 (995)
Outros ativos circulantes e não circulantes (348) 781
Ativos biológicos (642) (1.408)
Fornecedores e fornecedores de risco sacado (571) 516
Parcelamentos fiscais, trabalhistas e sociais (40) (99)
Outros passivos circulantes e não circulantes 294 (181)
Imposto de renda e contribuição social pagos (150) (2.499)
Pagamento dos acordos Antitruste (150) (17)
Variações em ativos e passivos operacionais 817 (6.498)
Caixa gerado pelas (aplicado nas) atividades operacionais 5.261 4.128
Juros pagos (1.699) (1.291)
Juros recebidos 202 172
Caixa líquido de juros gerado pelas (aplicado nas) atividades operacionais 3.764 3.009
Fluxo de caixa das atividades de investimentos
Adições de ativo imobilizado (1.951) (2.629)
Adição de ativo intangível (5) (15)
Recebimento na venda de ativo imobilizado 10 43
Incorporação/ Aquisição de controladas, líquido do caixa obtido na aquisição (7) (19)
Recebimento de dividendos 10 -
Transações com partes relacionadas 1 1
Outros 94 -
Caixa aplicado nas atividades de investimentos (1.847) (2.619)
Fluxo de caixa das atividades de financiamentos
Empréstimos e financiamentos captados 15.619 16.391
Pagamentos de empréstimos e financiamentos (10.426) (11.796)
Pagamentos de arrendamento mercantil (554) (545)
Derivativos recebidos/pagos (137) (448)
Pagamentos de dividendos (2.218) (2.218)
Pagamentos de dividendos não-controladores (11) (6)
Caixa Margem (98) 70
Aquisição de ações em tesouraria PPC - (443)
Aquisição de ações de emissão própria - (1.837)
Alienação de ações de emissão própria - 824
Caixa líquido aplicado nas atividades de financiamentos 2.175 (7)
Variação cambial sobre caixa e equivalentes de caixa (318) 1.665
Variação líquida 3.774 2.049
Caixa e equivalentes de caixa inicial 8.965 17.282
Caixa e equivalentes de caixa no final do período 12.739 19.330
Consolidado
21. 21
DISCLAIMER
Nós fazemos declarações sobre eventos futuros que estão sujeitas a riscos e incertezas. Tais
declarações têm como base crenças e suposições de nossa Administração e informações a que
a Companhia atualmente tem acesso. Declarações sobre eventos futuros incluem informações
sobre nossas intenções, crenças ou expectativas atuais, assim como aquelas dos membros do
Conselho de Administração e Diretores da Companhia.
As ressalvas com relação a declarações e informações acerca do futuro também incluem
informações sobre resultados operacionais possíveis ou presumidos, bem como declarações
que são precedidas, seguidas ou que incluem as palavras "acredita", "poderá", "irá", "continua",
"espera", "prevê", "pretende", "planeja", "estima" ou expressões semelhantes.
As declarações e informações sobre o futuro não são garantias de desempenho. Elas envolvem
riscos, incertezas e suposições porque se referem a eventos futuros, dependendo, portanto,
de circunstâncias que poderão ocorrer ou não. Os resultados futuros e a criação de valor para
os acionistas poderão diferir de maneira significativa daqueles expressos ou sugeridos pelas
declarações com relação ao futuro. Muitos dos fatores que irão determinar estes resultados e
valores estão além da nossa capacidade de controle ou previsão.
22. CONSOLIDATED
OPERATIONAL AND FINANCIAL HIGHLIGHTS IN IFRS
2Q23 HIGHLIGHTS
São Paulo, August 14, 2023 – JBS S.A. (B3: JBSS3; OTCQX: JBSAY), announces today its 2Q23 results. The comments
made herein are in US dollars, in accordance with international accounting standards (IFRS), unless otherwise specified.
JBS (JBSS3)
Price on 14.08.2023
US$3.90
Market Cap on
08.14.2023
US$8.7 Billion
Total Shares:
2.218.116.370
Conference Call
JBS S.A. & JBS USA
Tuesday
15.08.2023
Portuguese
9h BRT | 08h EST
English
11h BRT | 10h EST
Dial-in
Brazil:
+55 11 3181-8565
+55 11 4090-1621
International:
+1 844 204-8942
+1 412 717-9627
IR Contacts
Guilherme Cavalcanti
Christiane Assis
Pedro Bueno
Felipe Brindo
Vitor Figueira
Amanda Narihisa
ri_ir@jbs.com.br
JBS BEEF NORTH AMERICA
Net Sales: US$5.8 bi (+5.2% y/y)
Adjusted EBITDA:US$87.5 mi (-85.9% y/y)
Adjusted EBITDA Margin: 1.5% (-9.7 p.p. y/y)
JBS USA PORK
Net Sales: US$1.8 bi (-15.8% y/y)
Adjusted EBITDA:US$78.0 mi (-43.5% y/y)
Adjusted EBITDA Margin : 4.4% (-2.2 p.p. y/y)
PPC
Net Sales: US$4.3 bi (-7.0% y/y)
Adjusted EBITDA:US$375.3 mi (-49.2% y/y)
Adjusted EBITDA Margin: 8.7% (-7.2 p.p. y/y)
SEARA
Net Sales: US$2.1 bi (-4.1% y/y)
Adjusted EBITDA:US$84.8 mi (-72.3% y/y)
Adjusted EBITDA Margin : 4.1% (-10.0 p.p. y/y)
JBS BRASIL
Net Sales: US$2.8 bi (-1.5% y/y)
Adjusted EBITDA:US$136.5 mi (-16.4% y/y)
Adjusted EBITDA Margin: 4.8% (-0.9 p.p. y/y)
JBS AUSTRALIA
Net Sales: US$1.5 bi (-9.9% y/y)
Adjusted EBITDA:US$143.5 mi (-0.9% y/y)
Adjusted EBITDA Margin: 9.5% (+0.9 p.p. y/y)
• Net Sales: US$18.1 bi (-3.6% y/y)
• Adjusted EBITDA:US$902.8 mi (-57.1% y/y)
• Adjusted EBITDA Margin: 5.0% (-6.2 p.p. y/y)
• Net Loss: US$53.2 mi
JBS ENDS 2Q23 WITH
NET REVENUE OF US$18.1 BILLION
AND EBITDA OF US$903 MILLION
• Announcement of the dual listing plan in Brazil (B3) and the US (New York Stock Exchange) with
the aim of increasing the Company’s market value, attracting a wider range of investors, and
expanding the investment capacity.
• JBS obtained with the SEC (Securities and Exchange Commission) the effectiveness to register
its eleven senior notes.
• Payment of interim dividends in the amount of US$448 million, corresponding to US$0.20 per
share, that may be netted against mandatory minimum dividends for the fiscal year ending
December 31, 2023.
23. Facing a situation of increased supply of poultry in the global market and tighter margins in the
beef business in the United States, in the second quarter we executed a series of measures aiming
to increase the efficiency of our businesses in Brazil and the United States. These initiatives have
already started to have an effect on our operations, as shown by the improvement of our margins,
reinforcing our belief that we should focus on what we control to achieve superior financial
performance in challenging scenarios like the current one for the global protein industry.
In the coming months, we also see a scenario of a more balanced poultry supply, with potential
positive impacts on sector prices, and we are already capturing the decrease in corn prices in our
cost structure, a situation that also benefits our pork business.
The results in Australia show an improvement in the cattle supply cycle, which is reflected in the
increase of our margin in the region, reaching 9.5%. In Brazil, in the beef segment, the consistent
work to expand sales of higher value-added products, strengthening of partnerships with
suppliers and customers, increasing domestic market demand, and opening of new foreign
markets reinforce our perception of a positive situation for the upcoming quarters. In the United
States, the challenges for beef will continue.
Even with market challenges, investing in the expansion of our operations and distributing R$ 2.2
billion in dividends, we kept our net dollar debt stable compared to the first quarter of 2023. We
are prepared to navigate the current scenario safely, having extended the average term of our
debts, increased liquidity and reduced the cost of our debt.
These factors also reinforce our view that JBS has a unique position in the global protein industry,
and we believe we have not yet captured all the value this platform offers. Therefore, we
understand that our dual listing proposal, announced this quarter, is a transformational move to
build the company's new growth avenues.
Our dual listing strategy will give us more flexibility to finance our growth and de-leverage, in
addition to reducing capital costs. We will have access to a broader investor base, with great
financial capacity, favoring the unlocking of value of our shares and expanding our investment
capacity.
With the registration of our bonds in the United States, we are already a company regulated by
the Securities and Exchange Commission (SEC) and will also disclose our financial results in dollars.
This is aligned with our investors´ wishes for an easier comparison of our performance against
our global peers. It also more accurately represents the company's operational framework, given
that a significant portion of our revenue is in dollars.
As JBS celebrates its 70th anniversary, we look to the future with confidence that our global
platform, coupled with our culture and strong team, will allow us to continue generating value for
our stakeholders, and create opportunities for both the communities where we operate and our
more than 260,000 employees around the world.
Gilberto Tomazoni, CEO Global JBS
2
MESSAGE FROM THE CEO
The results of this second quarter of 2023 once again demonstrated the
strength of our diversified global platform and our ability and agility to
implement operational management measures to improve our commercial
and industrial performance, even in an adverse scenario. Our promising
prospects for 2023 have begun to materialize. Although the global context
remains challenging for the protein sector, we have confidence that we
have started a gradual recovery of our margins.
24. 3
2Q23 CONSOLIDATED HIGHLIGHTS
Note: graphs in millions
2Q22
2Q23
2T22 2T23
NET REVENUE
$18.1Bn
18,735
18,052
2Q22 2Q23
2,106
903
11.2%
5.0%
2Q22 2Q23
ADJUSTED EBITDA NET LOSS
803
-53
77
366
2Q22 2Q23
-$53.2Mn
FREE CASH FLOW
$366.2Mn
$902.8Mn
25. NET REVENUE
ADJUSTED EBITDA
4
2Q23 CONSOLIDATED RESULTS
CONSOLIDATED NET REVENUE
In 2Q23, JBS recorded consolidated net revenue of US$18.1 billion, which represents a
decrease of 3.6% compared to 2Q22.
For the period, approximately 74% of JBS global sales were made in the domestic markets in
which the company operates and 26% through exports.
In the last 12 months, net revenue reached US$ 71.3 billion.
In 2Q23, JBS adjusted EBITDA was US$902.8 million, a decrease of 57.1%, compared to a
very strong EBITDA disclosed in 2Q22, but there was also an important improvement
compared to the last quarter. Adjusted EBITDA margin was 5.0% in the quarter.
In the last 12 months, adjusted EBITDA reached US$4.0 billion, with an adjusted EBITDA
margin of 5.6%.
* Value Net of PIS/COFINS
∆% ∆%
US$ Million US$ % NR US$ % NR 2Q23 vs 1Q23 US$ % NR 2Q23 vs 2Q22 US$ % NR
Net Revenue 18,052.1 100.0% 16,687.2 100.0% 8.2% 18,735.2 100.0% -3.6% 71,254.0 100.0%
Cost of Goods Sold (16,055.2) -88.9% (15,221.5) -91.2% 5.5% (15,445.4) -82.4% 3.9% (62,664.8) -87.9%
Gross Profit 1,996.9 11.1% 1,465.8 8.8% 36.2% 3,289.8 17.6% -39.3% 8,589.1 12.1%
Selling Expenses (1,146.9) -6.4% (1,111.8) -6.7% 3.2% (1,160.3) -6.2% -1.2% (4,680.5) -6.6%
General and Adm. Expenses (510.8) -2.8% (514.2) -3.1% -0.6% (563.6) -3.0% -9.4% (2,144.4) -3.0%
Net Financial Income (expense) (336.9) -1.9% (299.2) -1.8% 12.6% (510.5) -2.7% -34.0% (1,327.0) -1.9%
Equity in earnings of subsidiaries 3.0 0.0% 2.8 0.0% 9.2% 4.2 0.0% -28.5% 10.5 0.0%
Other Income (expense) (31.2) -0.2% 42.9 0.3% - (1.6) 0.0% 1900.6% 229.9 0.3%
Profit (loss) before taxes (25.9) -0.1% (413.7) -2.5% -93.7% 1,058.1 5.6% n.a. 677.5 1.0%
Income and social contribution taxes (14.2) -0.1% 138.5 0.8% - (187.5) -1.0% -92.5% 240.9 0.3%
Minority interest (13.2) -0.1% (4.4) 0.0% 197.3% (67.4) -0.4% -80.4% (39.6) -0.1%
Net Income (Loss) (53.2) -0.3% (279.6) -1.7% -81.0% 803.2 4.3% -106.6% 878.8 1.2%
Adjusted EBITDA 902.8 5.0% 416.3 2.5% 116.9% 2,106.0 11.2% -57.1% 4,007.9 5.6%
Earnings per Share n.a. n.a. - 0.36 - 0.40
2Q23 1Q23 2Q22 LTM 2Q23
US$ Million 2Q23 1Q23 ∆% 2Q22 ∆% LTM 2Q23
Net income for the period (including minority interest) (40.0) (275.2) - 870.6 - 918.4
Financial income (expense), net 336.9 299.2 12.6% 510.5 -34.0% 1,327.0
Current and deferred income taxes 14.2 (138.5) - 187.5 -92.5% (240.9)
Depreciation and amortization 536.7 499.1 7.5% 478.4 12.2% 1,999.9
Equity in subsidiaries (3.0) (2.8) 9.2% (4.2) -28.5% (10.5)
(=) EBITDA 844.7 381.9 121.2% 2,042.7 -58.6% 3,994.0
Other income / expenses 34.5 8.2 320.2% 6.9 402.8% 16.7
PPC Insurance Indemnity 0.0 (19.1) - 0.0 - (19.1)
PPC Europe Reestructuring 0.0 8.0 - 0.0 - 8.0
Impairment Planterra Assets 0.9 20.8 -95.6% 0.0 - 21.7
Net indemnity J&F* 0.0 0.0 - 0.0 - (93.8)
Antitrust Agreements 18.0 13.7 31.4% 48.5 -62.9% 67.7
Fund for the Amazon 0.0 0.0 - 0.0 - 0.5
Donations and social projects 4.7 2.7 70.5% 8.0 -41.6% 12.1
(=) Adjusted EBITDA 902.8 416.3 116.9% 2,106.1 -57.1% 4,007.9
26. 5
NET RESULT
CASH FLOW FROM OPERATING ACTIVITIES AND FREE CASH FLOW
NET CASH PROVIDED (USED) BY INVESTING ACTIVITIES
2Q23 CONSOLIDATED RESULTS
NET FINANCIAL RESULTS
¹¹Includes the interest expenses from loans and financings which are included in the interest expense and interest income lines..
In 2Q23, JBS recorded a net loss of US$ 53.2 million.
In 2Q23, net debt financial expense was US$265 million.
In 2Q23, cash flow from operating activities was US$1.1 billion, an important evolution when
compared to the previous quarter. Free cash flow, after adding property, plant and
equipment, interest paid and received, was US$366 million, highlighting the improvement of
the working capital of US$355 million, mainly due to the reduction in inventories and the
improvement in accounts receivable.
In 2Q23, the total amount of cash flow from JBS investment activities was US$373 million, with the
main investment being the addition of fixed assets (CAPEX) in the amount of US$394 million in the
quarter.
US$ Million 2Q23 1Q23 ∆% 2Q22 ∆% LTM 2Q23
Exchange rate variation 3.4 53.9 -93.8% (102.2) - 70.6
Fair value adjustments on derivatives 15.2 (14.7) - (8.5) - (105.4)
Interest expense¹ (422.6) (395.1) 6.9% (347.4) 21.6% (1,532.8)
Interest income¹ 79.6 67.6 17.7% 63.6 25.1% 307.8
Taxes, contribution, fees and others (12.5) (10.9) 14.8% (116.1) -89.3% (86.2)
Finance income (expense) (336.9) (299.2) 12.6% (510.5) -34.0% (1,346.1)
Interest expenses from loans and financings (284.6) (280.7) 1.4% (238.9) 19.2% (1,339.9)
Interest income from investments 19.9 17.5 13.8% 18.5 7.5% 93.3
Net debt financial expense¹ (264.8) (263.2) 0.6% (220.4) 20.1% (1,246.6)
27. 6
NET DEBT BRIDGE
Net debt showed a slight increase of US$168 million, despite the dividends payment in the
amount of US$448 million, maintenance of the capex plan at US$394 million; and accrued
interest of US$263 million. These amounts were offset by an adjusted EBITDA of US$903
million, and an improvement in working capital of US$355 million, as shown in the graph
above.
INDEBTEDNESS
(US$ million)
3.16x
(903)
4.15x
2Q23 CONSOLIDATED RESULTS
2Q23 1Q23 ∆% 2Q22 ∆%
Gross Debt 19,463.6 18,248.7 6.7% 18,597.8 4.7%
(+) Short Term Debt 2,217.3 1,975.1 12.3% 2,426.7 -8.6%
% of the Gross Debt 11.4% 10.8% 13.0%
(+) Long Term Debt 17,246.3 16,273.6 6.0% 16,171.1 6.6%
% of the Gross Debt 88.6% 89.2% 87.0%
(-) Cash and Equivalents 2,811.4 1,764.6 59.3% 3,690.4 -23.8%
Net Debt 16,652.2 16,484.2 1.0% 14,907.4 11.7%
Leverage 4.15x 3.16x 1.65x
US$ Million
JBS ended the quarter with US$2.8 billion in cash and has US$3.3 billion available in revolving
credit lines, without guarantees, of which US$2.9 billion is at the JBS USA level and US$450
million at JBS Brazil. Therefore, the Company’s total availability is US$6.1 billion.
At the close of 2Q23, net debt stood at US$16.7 billion an increase of US$168 million or 1%
when compared to the closing of 1Q23. JBS ended the quarter with leverage of 4.15x in
dollars given the reduction in EBITDA for the period.
28. USD²
86.7%
BRL
13.3%
7
13.47% p.a.
5.00% p.a.
Debt Maturity
Schedule (U$ Mn)¹
Bonds
75%
Banks
16%
CRA
9%
PROFORMA INDEBTEDNESS
SOURCE
BREAKDOWN
CURRENCY & COST
BREAKDOWN
¹ Includes funds available in cash and revolving guaranteed credit lines from JBS USA and JBS Brazil
² Includes debts in other currencies, such as Euros and Canadian Dollars
6.13% p.a.
Cash and
Equivalents
Revolving credit facilities
USD2.8 bn in the US
Revolving credit facilities
USD450 mn in Brazil
Average Term = 9.3 yrs
Average Cost = 6.13% p.a.
CONSOLIDATED RESULTS 2Q23
2,811
2,217
298 377
163
2,064
1,081
755
1,786
1,890
2,930 2,983
505
2,414
2,850
450
Cash and
Cash
Equivalents
Short Term 2024 2025 2026 2027 2028 2029 2030 2031 2032 2033 2034... ...2052
29. 8
BUSINESS UNITS– IFRS US$
2Q23 BUSINESS UNITS
BUSINESS UNITS – USGAAP US$
Million 2Q23 1Q23 ∆% 2Q22 ∆% LTM 2Q23
Net Revenue
Seara US$ 2,082.3 1,988.5 4.7% 2,170.4 -4.1% 8,411.6
JBS Brazil US$ 2,824.7 2,348.5 20.3% 2,867.1 -1.5% 10,982.3
JBS Beef North America US$ 5,810.6 5,266.4 10.3% 5,521.5 5.2% 22,084.7
JBS Australia US$ 1,509.0 1,394.7 8.2% 1,674.4 -9.9% 6,135.0
JBS USA Pork US$ 1,776.9 1,808.2 -1.7% 2,111.2 -15.8% 7,725.9
Pilgrim's Pride US$ 4,304.8 4,162.1 3.4% 4,628.4 -7.0% 17,056.5
Others US$ 256.9 244.6 5.1% 235.7 9.0% 917.5
Eliminations US$ -513.1 -525.7 -2.4% -473.6 8.3% -2,059.6
Total US$ 18,052.1 16,687.2 8.2% 18,735.2 -3.6% 71,254.0
Adjusted EBITDA
Seara US$ 84.8 28.3 199.8% 305.9 -72.3% 586.2
JBS Brazil US$ 136.5 57.1 139.0% 163.2 -16.4% 415.5
JBS Beef North America US$ 87.5 22.3 292.6% 620.0 -85.9% 786.4
JBS Australia US$ 143.5 -3.4 - 144.7 -0.9% 354.1
JBS USA Pork US$ 78.0 44.6 74.9% 138.2 -43.5% 505.2
Pilgrim's Pride US$ 375.3 268.7 39.7% 738.8 -49.2% 1,376.8
Others US$ -2.3 -0.7 210.9% -4.4 -47.6% -14.0
Eliminations US$ -0.6 -0.6 4.8% -0.6 9.0% -2.3
Total US$ 902.8 416.3 116.9% 2,106.0 -57.1% 4,007.9
Adjusted EBITDA Margin
Seara % 4.1% 1.4% 2.6 p.p. 14.1% -10.0 p.p. 7.0%
JBS Brazil % 4.8% 2.4% 2.4 p.p. 5.7% -0.9 p.p. 3.8%
JBS Beef North America % 1.5% 0.4% 1.1 p.p. 11.2% -9.7 p.p. 3.6%
JBS Australia % 9.5% -0.2% 9.8 p.p. 8.6% 0.9 p.p. 5.7%
JBS USA Pork % 4.4% 2.5% 1.9 p.p. 6.5% -2.2 p.p. 6.6%
Pilgrim's Pride % 8.7% 6.5% 2.3 p.p. 16.0% -7.2 p.p. 8.1%
Others % -0.9% -0.3% -0.6 p.p. -1.8% 1.0 p.p. -1.5%
Total % 5.0% 2.5% 2.5 p.p. 11.2% -6.2 p.p. 5.6%
Million 2Q23 1Q23 ∆% 2Q22 ∆% LTM 2Q23
Net Revenue
JBS Beef North America US$ 5,810.6 5,266.4 10.3% 5,521.5 5.2% 22,084.7
JBS Australia US$ 1,509.0 1,394.7 8.2% 1,674.3 -9.9% 6,135.1
JBS USA Pork US$ 1,776.9 1,808.1 -1.7% 2,111.2 -15.8% 7,725.9
Pilgrim's Pride US$ 4,308.1 4,165.6 3.4% 4,631.6 -7.0% 17,070.1
Adjusted EBITDA
JBS Beef North America US$ 83.4 -23.2 - 624.3 -86.6% 576.1
JBS Australia US$ 129.5 18.5 600.0% 106.0 22.2% 285.9
JBS USA Pork US$ 27.0 66.4 -59.3% 213.6 -87.4% 282.6
Pilgrim's Pride US$ 248.7 151.9 63.7% 623.3 -60.1% 924.0
Adjusted EBITDA Margin
JBS Beef North America % 1.4% -0.4% 1.9 p.p. 11.3% -9.9 p.p. 2.6%
JBS Australia % 8.6% 1.3% 7.3 p.p. 6.3% 2.3 p.p. 4.7%
JBS USA Pork % 1.5% 3.7% -2.2 p.p. 10.1% -8.6 p.p. 3.7%
Pilgrim's Pride % 5.8% 3.6% 2.1 p.p. 13.5% -7.7 p.p. 5.4%
30. 9
SEARA
In 2Q23, Seara recorded net revenue of US$2.1 billion, a decrease of 4% compared to 2Q22, as
a reflection of lower net revenues from exports. Adjusted EBITDA reached US$85 million, with
a 4.1% EBITDA margin, which continues to be pressured by the global oversupply of poultry.
On the other hand, there is a sequential improvement, as a result of correcting operational
problems faced in previous quarters.
In the export market, net revenue in dollars was US$1.1 billion, which represents a decrease of
7% compared to 2Q22, given the lower average prices in dollars of 14% y/y, but it was partially
offset by the 8% growth in volumes sold. As previously mentioned, the lower prices were a
result of the poultry global oversupply, which continues to impact dollar prices.
Domestic market sales totaled US$1.0 billion, in line with 2Q22. The chicken oversupply
pressured the capacity to increase prices in the domestic market. In line with the investing
strategy in innovation, mix and quality, Seara inaugurated in March a breaded chicken plant in
Rolândia, the largest in Latin America. Despite still being in the ramp-up phase, this plant is at
an accelerated pace of production, and with a good sales performance. Seara also launched
new products with flavors that cater to the everyday recipes of the Brazilian consumer. And
finally, the launching of new items in the rotisserie chicken category.
Investments in the Seara brand continue to bring positive results for the Company. In addition
to consolidating itself as the most present brand in the Brazilian household in several
categories, it is the brand that grew the most in terms of penetration and repurchase between
2Q22 and 2Q23.
2Q23 BUSINESS UNITS
∆% ∆%
US$ % NR US$ % NR QoQ US$ % NR YoY US$ % NR
Net Revenue 2,082.3 100.0% 1,988.5 100.0% 4.7% 2,170.4 100.0% -4.1% 8,411.6 100.0%
Cost of Goods Sold (1,780.8) -85.5% (1,759.8) -88.5% 1.2% (1,642.5) -75.7% 8.4% (6,976.2) -82.9%
Gross Profit 301.5 14.5% 228.7 11.5% 31.8% 528.0 24.3% -42.9% 1,435.4 17.1%
Adjusted EBITDA 84.8 4.1% 28.3 1.4% 199.8% 305.9 14.1% -72.3% 586.2 7.0%
LTM 2Q23
IFRS - US$ Million
2Q23 1Q23 2Q22
31. 10
JBS BRASIL
In 2Q23, JBS Brasil recorded net revenue of US$2.8 billion, in line with the previous year, but a
20% growth in relation to the previous quarter.
In the export Market, net revenue in dollars from in natura beef increased by 10% when
compared to 2Q22, as a result of the higher export volume. After the confirmation of an
atypical case of BSE in Pará state, the Brazilian Ministry of Agriculture and Livestock promoted
a self-embargo on beef exports to China during the 1Q23. Brazil was out of the export market
to China for approximately one month during that quarter. Therefore, the results of the 2Q23
reflect the reopening of imports from China for the full period. In addition, the favorable
livestock cycle and the greater international demand for Brazilian beef also had a positive
impact on sales in the annual comparison.
In the domestic market, revenue in the fresh beef category grew 2% YoY, impacted by the
sales volume increase. This growth is attributed to the greater availability of animals for
processing and the continued focus on improving commercial execution and expanding the mix
of higher value-added products.
EBITDA totaled US$136.5 million, with an EBITDA margin of 4.8% in 2Q23. According to data
published by CEPEA-ESALQ, the price of live cattle during the quarter was approximately
R$266/arroba, 7% lower in the quarterly comparison, also contributing to the improvement in
profitability when compared to the previous period.
2Q23 BUSINESS UNITS
Note: On March 1, 2020, through a corporate restructuring process, the Swift stores were transferred to the direct subsidiary Seara Alimentos.
Despite the fact that the Swift stores are part of Seara Alimentos' corporate structure, for the purposes of analysis and presentation of results,
management decided to allocate the Swift stores results to the JBS Brazil operating segment.
∆% ∆%
US$ % NR US$ % NR QoQ US$ % NR YoY US$ % NR
Net Revenue 2,824.7 100.0% 2,348.5 100.0% 20.3% 2,867.1 100.0% -1.5% 10,982.3 100.0%
Cost of Goods Sold (2,393.9) -84.7% (2,041.4) -86.9% 17.3% (2,406.0) -83.9% -0.5% (9,365.6) -85.3%
Gross Profit 430.9 15.3% 307.1 13.1% 40.3% 461.0 16.1% -6.5% 1,616.7 14.7%
Adjusted EBITDA 136.5 4.8% 57.1 2.4% 139.0% 163.2 5.7% -16.4% 415.5 3.8%
IFRS - US$ Million
2Q23 1Q23 2Q22 LTM 2Q23
32. ¹The difference in JBS Beef North America EBITDA in IFRS and USGAAP, in addition to the FX, is attributed to the adoption of IFRS16 from
1Q19 onwards and different accounting criteria in relation to inventories: in IFRS they are measured through the average cost while in
USGAAP they are marked-to-market. Volume and price calculations exclude the impact of acquisitions.
11
JBS BEEF NORTH AMERICA
In IFRS and US$, net revenue for JBS Beef North America in 2Q23 was US$5.8 billion, an
increase of 5% compared to 2Q22, with an adjusted EBITDA of US$87.5 million, and an adjusted
EBITDA margin of 1.5%.
In USGAAP and US$, net revenue was US$5.8 billion, an increase of 5% compared to 2Q22 and
the adjusted EBITDA was US$83.4 million, with a 1.4% margin.
During the quarter, beef margins in North America suffered a material impact compared to the
previous year, as a result of changes in market conditions due to the turn of the cattle cycle in
that region, reducing the availability of animals for processing and therefore a cost increase.
On the other hand, the sequential improvement in profitability was a reflection of the favorable
seasonality, in addition to improvements in our operations. In the quarter, according to the
USDA, live cattle prices remained at high levels, increasing 26% YoY to US$179/ctw, while
wholesale beef prices grew 17% YoY.
Year to date exports of beef from the US decreased 11% compared to the same period of last
year, according to the USDA, mainly due to a restricted supply and lower Asian demand. The
three main US destinations remain South Korea, Japan and China.
It is important to emphasize that even in a more challenging scenario for the industry, JBS
continued to focus its efforts on improving commercial and operational performance, having
already captured several efficiency gains in various areas.
2Q23 BUSINESS UNITS
∆% ∆%
US$ % NR US$ % NR QoQ US$ % NR YoY US$ % NR
Net Revenue 5,810.6 100.0% 5,266.4 100.0% 10.3% 5,521.5 100.0% 5.2% 22,084.7 100.0%
Cost of Goods Sold (5,693.8) -98.0% (5,246.9) -99.6% 8.5% (4,869.1) -88.2% 16.9% (21,326.8) -96.6%
Gross Profit 116.8 2.0% 19.5 0.4% 498.7% 652.4 11.8% -82.1% 757.8 3.4%
Adjusted EBITDA 83.4 1.4% (23.2) -0.4% n.m. 624.3 11.3% -86.6% 576.1 2.6%
USGAAP¹ - US$ Million
2Q23 1Q23 2Q22 LTM 2Q23
∆% ∆%
US$ % NR US$ % NR QoQ US$ % NR YoY US$ % NR
Net Revenue 5,810.6 100.0% 5,266.4 100.0% 10.3% 5,521.5 100.0% 5.2% 22,084.7 100.0%
Cost of Goods Sold (5,480.9) -94.3% (4,987.8) -94.7% 9.9% (4,629.7) -83.8% 18.4% (20,214.9) -91.5%
Gross Profit 329.7 5.7% 278.6 5.3% 18.3% 891.8 16.2% -63.0% 1,869.8 8.5%
Adjusted EBITDA 87.5 1.5% 22.3 0.4% 292.6% 620.0 11.2% -85.9% 786.4 3.6%
LTM 2Q23
IFRS - US$ Million
2Q23 1Q23 2Q22
33. ¹The difference in JBS Australia EBITDA in IFRS and USGAAP, in addition to the FX, is attributed to the adoption of IFRS16 from 1Q19 onwards
and different accounting criteria in relation to biological assets: in IFRS they are marked-to-market, while in USGAAP they are measured
through the average cost. Volume and price calculations exclude the impact of acquisitions.
12
JBS AUSTRALIA
∆% ∆%
US$ % NR US$ % NR QoQ US$ % NR YoY US$ % NR
Net Revenue 1,509.0 100.0% 1,394.7 100.0% 8.2% 1,674.3 100.0% -9.9% 6,135.1 100.0%
Cost of Goods Sold (1,363.8) -90.4% (1,357.4) -97.3% 0.5% (1,546.0) -92.3% -11.8% (5,780.7) -94.2%
Gross Profit 145.2 9.6% 37.3 2.7% 289.2% 128.3 7.7% 13.1% 354.4 5.8%
Adjusted EBITDA 129.5 8.6% 18.5 1.3% 600.0% 106.0 6.3% 22.2% 285.9 4.7%
LTM 2Q23
USGAAP¹ - US$ Million
2Q23 1Q23 2Q22
In IFRS and US$, net revenue for JBS Australia in 2Q23 was US$1.5 billion (-10% YoY) and
adjusted EBITDA was US$143.5 million, with an EBITDA margin of 9.5%.
In USGAAP and US$, net revenue was US$1.5 billion (-10% YoY) in 2Q23. In the quarter,
adjusted EBITDA was US$ 129.5 million, with an EBITDA margin of 8.6%.
Domestic market sales, which accounted for 36% of the total revenue in the quarter, were 5%
higher than in 2Q22, driven by higher growth in sales volume. In the export market, net
revenue decreased by 7% compared to 2Q22, as a reflection of weaker prices in the Asian
market, but which were partially offset by an increase in sales to China.
Volumes from the beef business grew 8% compared to 2Q22, given the growth in export
volumes. Additionally, the improvement in the EBITDA margin also reflects the lower purchase
price of cattle, given the greater availability of animals due to the more favorable cycle.
The aquaculture business continues to grow due to greater demand, which is reflected in price
increases.
The pork business net revenue grew as a result of the herd health improvement program,
positively impacting volumes.
Primo, the prepared foods unit, recorded a 4% increase in net revenue as a result of price
increases.
2Q23 BUSINESS UNITS
∆% ∆%
US$ % NR US$ % NR QoQ US$ % NR YoY US$ % NR
Net Revenue 1,509.0 100.0% 1,394.7 100.0% 8.2% 1,674.4 100.0% -9.9% 6,135.0 100.0%
Cost of Goods Sold (1,287.0) -85.3% (1,318.4) -94.5% -2.4% (1,445.2) -86.3% -10.9% (5,454.9) -88.9%
Gross Profit 222.0 14.7% 76.3 5.5% 190.9% 229.2 13.7% -3.1% 680.1 11.1%
Adjusted EBITDA 143.5 9.5% (3.4) -0.2% - 144.7 8.6% -0.9% 354.1 5.8%
IFRS - US$ Million
2Q23 1Q23 2Q22 LTM 2Q23
34. ¹The difference in JBS USA Pork EBITDA in IFRS and USGAAP, in addition to the FX, is attributed to the adoption of IFRS16 from 1Q19 onwards and
different accounting criteria. In IFRS, the inventories are measured through the average cost while in USGAAP they are marked-to-market and
biological assets are marked to market, while in USGAAP they are measured through the average cost. Volume and price calculations exclude the
impact of acquisitions.
13
JBS USA PORK
∆% ∆%
US$ % NR US$ % NR QoQ US$ % NR YoY US$ % NR
Net Revenue 1,776.9 100.0% 1,808.1 100.0% -1.7% 2,111.2 100.0% -15.8% 7,725.9 100.0%
Cost of Goods Sold (1,750.0) -98.5% (1,730.0) -95.7% 1.2% (1,911.8) -90.6% -8.5% (7,420.9) -96.1%
Gross Profit 26.9 1.5% 78.1 4.3% -65.6% 199.4 9.4% -86.5% 305.0 3.9%
Adjusted EBITDA 27.0 1.5% 66.4 3.7% -59.3% 213.6 10.1% -87.4% 282.6 3.7%
LTM 2Q23
USGAAP¹ - US$ Million
2Q23 1Q23 2Q22
In IFRS and US$, net revenue for JBS USA Pork in 2Q23 was US$1.8 billion, 16% lower than
2Q22 and adjusted EBITDA was US$78 million, with an adjusted EBITDA margin of 4.4%.
In USGAAP and US$, net revenue was US$1.8 billion, a decrease of 16% compared to 2Q22,
with an adjusted EBITDA of US$27 million and a margin of 1.5%. The main difference this
quarter between EBITDA under USGAAP and IFRS was due to the impact of accounting for
inventory at market value under USGAAP and at average cost under IFRS.
In the domestic market, wholesale pork prices fell by approximately 21% YoY in 2Q23, given
the oversupply situation of pork in the US Market. However, according to the USDA, pork
production has already shown a slight reduction (-0.4% YoY), and the sector´s inventory levels
are on a downward trend. In the comparison between June and April, the peak of the year, the
reduction in inventory was approximately 14%.
In the international market, USDA data accumulated for the year showed a 10% increase in
pork exports, especially to China, South Korea and Mexico. Low prices in the domestic market
and lower exports from important producing regions, such as Europe, are sustaining this
growth.
2Q23 BUSINESS UNITS
∆% ∆%
US$ % NR US$ % NR QoQ US$ % NR YoY US$ % NR
Net Revenue 1,776.9 100.0% 1,808.1 100.0% -1.7% 2,111.2 100.0% -15.8% 7,725.9 100.0%
Cost of Goods Sold (1,580.4) -88.9% (1,635.8) -90.5% -3.4% (1,873.2) -88.7% -15.6% (6,723.1) -87.0%
Gross Profit 196.5 11.1% 172.3 9.5% 14.0% 238.0 11.3% -17.5% 1,002.8 13.0%
Adjusted EBITDA 78.0 4.4% 44.6 2.5% 74.9% 138.2 6.5% -43.5% 505.2 6.5%
LTM 2Q23
IFRS - US$ Million
2Q23 1Q23 2Q22
35. ¹The difference in PPC’s EBITDA in IFRS and USGAAP, in addition to the FX, is attributed to the adoption of IFRS 16 from 1Q19 onwards and to
different accounting criteria in relation to breeding flock amortization: in IFRS, amortization of the breeding flock, due to its long term nature, is
considered as an expense that can be adjusted in EBITDA, while in USGAAP amortization of the breeding flock is accounted as cost of goods sold and
not adjustable in EBITDA.
14
PILGRIM’S PRIDE CORPORATION
∆% ∆%
US$ % NR US$ % NR QoQ US$ % NR YoY US$ % NR
Net Revenue 4,308.1 100.0% 4,165.6 100.0% 3.4% 4,631.6 100.0% -7.0% 17,070.1 100.0%
Cost of Goods Sold (4,029.7) -93.5% (3,992.6) -95.8% 0.9% (3,954.9) -85.4% 1.9% (16,025.5) -93.9%
Gross Profit 278.4 6.5% 173.0 4.2% 60.9% 676.8 14.6% -58.9% 1,044.6 6.1%
Adjusted EBITDA 248.7 5.8% 151.9 3.6% 63.7% 623.3 13.5% -60.1% 924.0 5.4%
USGAAP¹ - US$ Million
2Q23 1Q23 2Q22 LTM 2Q23
In IFRS and US$, net revenue for PPC was US$4.3 billion in 2Q23, a 7% decrease compared to
2Q22, and an adjusted EBITDA of US$375 million, with an EBITDA margin of 8.7%.
In USGAAP and US$, PPC's net revenue in 2Q23 was US$4.3 billion, 7% lower than in 2Q22, and
adjusted EBITDA was US$249 million with a margin of 5.8%.
In the United States, despite the adverse scenario in the prices of chicken cuts used for raw
material (Big Bird), the sequential improvement in margins is the result of the intense focus on
operational excellence, the diversification of the portfolio and the supply of branded products
with greater value-added. In addition, growth with key customers has been an important pillar
for increased profitability in the main categories.
The Mexican market has improved as supply and demand fundamentals have become
increasingly balanced and challenges in the live chicken operation have decreased as we
continue to grow our value-added programs and brands.
In Europe, the positive path of margin growth was impacted by the continuous optimization of
operations, cost recovery efforts, consolidation of back-office activities and growth of
partnerships with key customers.
2Q23 BUSINESS UNITS
∆% ∆%
US$ % NR US$ % NR QoQ US$ % NR YoY US$ % NR
Net Revenue 4,304.8 100.0% 4,162.1 100.0% 3.4% 4,628.4 100.0% -7.0% 17,056.5 100.0%
Cost of Goods Sold (3,806.3) -88.4% (3,777.0) -90.7% 0.8% (3,708.2) -80.1% 2.6% (15,136.2) -88.7%
Gross Profit 498.5 11.6% 385.1 9.3% 29.4% 920.2 19.9% -45.8% 1,920.3 11.3%
Adjusted EBITDA 375.3 8.7% 268.7 6.5% 39.7% 738.8 16.0% -49.2% 1,376.8 8.1%
IFRS - US$ Million
2Q23 1Q23 2Q22 LTM 2Q23
37. Great China¹
25.4%
Africa and
Middle East
13.4%
USA
10.8%
Japan
10.5%
South
Korea
7.9%
E.U.
6.0%
Others
26.0%
US$
4.9 billion
2Q22
Nota
1.
Considering
China
and
Hong
Kong
16
Great China¹
30.3%
Africa and
Middle East
10.3%
Japan
8.8%
South
Korea
8.8%
USA
8.3%
E.U.
6.6%
Others
26.9%
US$
4.8 billion
2Q23
-1.7%
2Q23 (%) Consolidated JBS Brazil Seara
JBS Beef North
America
JBS Australia JBS USA Pork PPC
Raw material (livestock) 75.9% 87.8% 69.5% 85.8% 76.0% 72.2% 53.6%
Processing (including
ingredients and packaging)
13.0% 5.0% 19.8% 5.7% 8.7% 13.7% 30.3%
Labor Cost 11.1% 7.2% 10.8% 8.6% 15.3% 14.1% 16.1%
GRAPH 1 – JBS EXPORTS IN 2Q23 AND 2Q22
TABLES AND GRAPHS
TABLE 1 - CAPEX
TABLE 2 – COGS BREAKDOWN
∆% ∆%
US$ Million US$ % CAPEX US$ % CAPEX QoQ US$ % CAPEX YoY US$ % CAPEX
Total Capex 394.0 100.0% 330.8 100.0% 13.5% 534.3 100.0% -25.8% 1,945.0 100.0%
Expansion 191.6 48.6% 182.2 55.1% 0.2% 303.0 56.7% -36.4% 1,025.7 52.7%
Maintenance 202.4 51.4% 148.5 44.9% 29.9% 231.3 43.3% -12.0% 919.3 47.3%
2Q23 1Q23 2Q22 LTM 2Q23
38. 17
2Q23 FINANCIAL STATEMENTS
Balance Sheet
In million of American Dollars - US$
Current Assets 06/30/23 12/31/22
Cash and cash equivalents 2,643 2,526
Margin cash 168 130
Trade accounts receivable 3,458 3,878
Inventories 5,473 5,394
Biological assets 1,741 1,861
Recoverable taxes 1,056 1,022
Derivative assets 96 85
Other current assets 356 320
TOTAL CURRENT ASSETS 14,992 15,216
Non-Current Assets 06/30/23 12/31/22
Recoverable taxes 1,769 1,757
Biological assets 551 502
Related party receivables 202 182
Deferred income taxes 742 606
Derivative assets 124 24
Other non-current assets 222 214
3,611 3,285
Investments equity-accounted investees 62 57
Property, plant and equipment 12,671 11,915
Right of use asset 1,721 1,605
Intangible assets 1,991 1,979
Goodwill 6,109 5,829
- -
TOTAL NON-CURRENT ASSETS 26,165 24,670
TOTAL ASSETS 41,157 39,886
Consolidated
39. 18
2Q23 FINANCIAL STATEMENTS
Balance Sheet
In million of American Dollars - US$
Current Liabilities 06/30/23 12/31/22
Trade accounts payable 5,090 5,943
Supply chain finance 774 589
Loans and financing 2,217 1,577
Income taxes 31 91
Other taxes payable 139 139
Accrued payroll and social charges 1,109 1,198
Lease liabilities 351 343
Dividends payable 1 0
Provision for legal proceedings 176 174
Derivative liabilities 180 107
Other current liabilities 445 410
TOTAL CURRENT LIABILITIES 10,513 10,572
Non-Current Liabilities 06/30/23 12/31/22
Loans and financing 17,246 16,123
Income and other taxes payable 113 116
Payroll and social charges 523 456
Lease liabilities 1,497 1,379
Deferred income taxes 1,361 1,363
Provision for legal proceedings 299 253
Other non-current liabilities 112 77
TOTAL NON-CURRENT LIABILITIES 21,151 19,768
Equity 06/30/23 12/31/22
Share capital - common shares 13,178 13,178
Capital reserve (190) (193)
Other reserves (36) (35)
Profit reserves 4,300 4,300
Accumulated other comprehensive income (7,610) (8,349)
Accumulated losses (780) -
Attributable to company shareholders 8,862 8,900
Attributable to non-controlling interest 631 646
TOTAL EQUITY 9,493 9,546
TOTAL LIABILITIES AND EQUITY 41,157 39,886
Consolidated
40. 19
2Q23 FINANCIAL STATEMENTS
Statements of income for the three month period ended June 30
In million of American Dollars - US$
2023 2022
NET REVENUE 18,052 18,735
Cost of sales (16,055) (15,445)
GROSS PROFIT 1,997 3,290
General and administrative expenses (511) (564)
Selling expenses (1,147) (1,160)
Other expenses (46) (15)
Other income 15 14
OPERATING EXPENSES (1,689) (1,725)
OPERATING PROFIT 308 1,564
Finance income 98 64
Finance expense (435) (574)
NET FINANCE EXPENSE (337) (511)
Share of profit of equity-accounted investees, net of tax 3 4
PROFIT (LOSS) TAXES (26) 1,058
Current income taxes (32) (331)
Deferred income taxes 18 144
(14) (187)
NET INCOME (40) 871
ATTRIBUTABLE TO:
Company shareholders (53) 803
Non-controlling interest 13 67
(40) 871
Basic earnings per share - common shares (R$) n.m. 0.86
Consolidated
41. 20
2Q23 FINANCIAL STATEMENTS
Statements of cash flows for the three month period ended June 30
In million of American Dollars - US$
Cash flow 2023 2022
Net Income (loss) (40) 871
Adjustments for: -
Depreciation and amortization 537 478
Allowance for doubtful accounts 2 3
Share of profit of equity-accounted investees (3) (4)
(Gain) loss on assets sales 3 0
Taxes expense 14 187
Finance expense (income), net 337 511
Share-based compensation 2 2
Provisions 22 13
Impairment of Goodwill and property, plant and equipment 4 -
Estimated losses for realizable value of inventories (1) 3
Fair value (market to market) of biological assets 3 46
DOJ (Department of Justice) and antitrust agreements 18 48
897 2,159
Changes in assets and liabilities: - -
Trade accounts receivable 246 (352)
Inventories 187 (175)
Recoverable taxes 56 (202)
Other current and non-current assets (70) 159
Biological assets (130) (286)
Trade accounts payable and supply chain finance (115) 105
Tax payable in installments (8) (20)
Other current and non-current liabilities 59 (37)
Income taxes paid (30) (508)
DOJ and Antitrust agreements payment (30) (3)
Changes in operating assets and liabilities 165 (1,320)
Cash provided by (used in) operating activities 1,062 839
Interest paid (343) (262)
Interest received 41 35
-
Cash net of interest provided by (used in) operating activities 760 612
Cash flow from investing activities
Purchases of property, plant and equipment (394) (534)
Purchases and disposables of intangible assets (1) (3)
Proceeds from sale of property, plant and equipment 2 9
Acquisitions, net of cash acquired (1) (4)
Dividends received 2 -
Related party transactions 0 0
Other 19 -
Cash provided by (used in) investing activities (373) (532)
Cash flow from financing activities
Proceeds from loans and financings 3,154 3,331
Payments of loans and financings (2,106) (2,397)
Payments of lease (112) (111)
Derivative instruments received (Settled) (28) (91)
Dividends paid (448) (451)
Dividends paid to non-controlling interest (2) (1)
Margin cash (20) 14
PPC share repurchase - (90)
Purchase of treasury shares - (373)
Disposal of treasury shares - 168
Cash used in financing activities 439 (1)
Effect of exchange rate changes on cash and cash equivalents (64) 338
- -
Net change in cash and cash equivalents 762 416
Cash and cash equivalents at the beggining of period 1,811 3,512
Cash and cash equivalents at the end of period 2,573 3,928
Consolidated
42. 21
DISCLAIMER
We make statements about future events that are subject to risks and uncertainties. Such
statements are based on the beliefs and assumptions of our Management and information to
which the Company currently has access. Statements about future events include information
about our current intentions, beliefs or expectations, as well as those of the members of the
Company's Board of Directors and Officers.
Disclaimers with respect to forward-looking statements and information also include
information on possible or presumed operating results, as well as statements that are
preceded, followed or that include the words "believe," "may," "will," "continue," “expects,"
"predicts," "intends," "plans," "estimates," or similar expressions.
Forward-looking statements and information are not guarantees of performance. They
involve risks, uncertainties and assumptions because they refer to future events, depending,
therefore, on circumstances that may or may not occur. Future results and shareholder value
creation may differ materially from those expressed or implied by the forward-looking
statements. Many of the factors that will determine these results and values are beyond our
ability to control or predict.
43. CONSOLIDATED
OPERATIONAL AND FINANCIAL HIGHLIGHTS IN IFRS
2Q23 HIGHLIGHTS | IFRS (BRL)
São Paulo, August 14, 2023 – JBS S.A. (B3: JBSS3; OTCQX: JBSAY), announces today its 2Q23 results. The comments
made herein are in Brazilian Reais, in accordance with international accounting standards (IFRS), unless otherwise specified.
JBS (JBSS3)
Price on 14.08.2023
R$19.38
Market Cap on
08.14.2023
R$43.0 Billion
Total Shares:
2.218.116.370
Conference Call
JBS S.A. & JBS USA
Tuesday
15.08.2023
Portuguese
9h BRT | 08h EST
English
11h BRT | 10h EST
Dial-in
Brazil:
+55 11 3181-8565
+55 11 4090-1621
International:
+1 844 204-8942
+1 412 717-9627
IR Contacts
Guilherme Cavalcanti
Christiane Assis
Pedro Bueno
Felipe Brindo
Vitor Figueira
Amanda Narihisa
ri_ir@jbs.com.br
JBS BEEF NORTH AMERICA
Net Sales: R$28.8 bi (+5.9% y/y)
Adjusted EBITDA: R$433 mi (-85.8% y/y)
Adjusted EBITDA Margin : 1.5% (-9.7 p.p. y/y)
JBS USA PORK
Net Sales: R$8.8 bi (-15.3% y/y)
Adjusted EBITDA: R$386 mi (-43.2% y/y)
Adjusted EBITDA Margin : 4.4% (-2.2 p.p. y/y)
PPC
Net Sales: R$21.3 bi (-6.4% y/y)
Adjusted EBITDA: R$1.9 bi (-48.9% y/y)
Adjusted EBITDA Margin: 8.7% (-7.2 p.p. y/y)
SEARA
Net Sales: R$10.3 bi (-3.5% y/y)
Adjusted EBITDA: R$420 mi (-72.1% y/y)
Adjusted EBITDA Margin : 4.1% (-10.0 p.p. y/y)
JBS BRASIL
Net Sales: R$14.0 bi (-0.9% y/y)
Adjusted EBITDA: R$676 mi (-15.9% y/y)
Adjusted EBITDA Margin: 4.8% (-0.9 p.p. y/y)
JBS AUSTRALIA
Net Sales: R$7.5 bi (-9.3% y/y)
Adjusted EBITDA: R$710 mi (-0.3% y/y)
Adjusted EBITDA Margin: 9.5% (+0.9 p.p. y/y)
• Net Sales: R$89.4 bi (-3.0% y/y)
• Adjusted EBITDA: R$4.5 bi (-56.9% y/y)
• Adjusted EBITDA Margin: 5.0% (-6.2 p.p. y/y)
• Net Loss: R$263.6 mi
JBS ENDS 2Q23 WITH
NET REVENUE OF R$89 BILLION
AND EBITDA OF R$4.5 BILLION
• Announcement of the dual listing plan in Brazil (B3) and in the US (New York Stock Exchange)
with the aim of increasing the Company’s market value, attracting a wider range of investors,
and expanding the investment capacity.
• JBS obtained with the SEC (Securities and Exchange Commission) the effectiveness to register
its eleven senior notes.
• Payment of interim dividends in the amount of R$2.2 billion, corresponding to R$1 per share,
that may be netted against mandatory minimum dividends for the fiscal year ending December
31, 2023.
44. Facing a situation of increased supply of poultry in the global market and tighter margins in the
beef business in the United States, in the second quarter we executed a series of measures aiming
to increase the efficiency of our businesses in Brazil and the United States. These initiatives have
already started to have an effect on our operations, as shown by the improvement of our margins,
reinforcing our belief that we should focus on what we control to achieve superior financial
performance in challenging scenarios like the current one for the global protein industry.
In the coming months, we also see a scenario of a more balanced poultry supply, with potential
positive impacts on sector prices, and we are already capturing the decrease in corn prices in our
cost structure, a situation that also benefits our pork business.
The results in Australia show an improvement in the cattle supply cycle, which is reflected in the
increase of our margin in the region, reaching 9.5%. In Brazil, in the beef segment, the consistent
work to expand sales of higher value-added products, strengthening of partnerships with
suppliers and customers, increasing domestic market demand, and opening of new foreign
markets reinforce our perception of a positive situation for the upcoming quarters. In the United
States, the challenges for beef will continue.
Even with market challenges, investing in the expansion of our operations and distributing R$ 2.2
billion in dividends, we kept our net dollar debt stable compared to the first quarter of 2023. We
are prepared to navigate the current scenario safely, having extended the average term of our
debts, increased liquidity and reduced the cost of our debt.
These factors also reinforce our view that JBS has a unique position in the global protein industry,
and we believe we have not yet captured all the value this platform offers. Therefore, we
understand that our dual listing proposal, announced this quarter, is a transformational move to
build the company's new growth avenues.
Our dual listing strategy will give us more flexibility to finance our growth and de-leverage, in
addition to reducing capital costs. We will have access to a broader investor base, with great
financial capacity, favoring the unlocking of value of our shares and expanding our investment
capacity.
With the registration of our bonds in the United States, we are already a company regulated by
the Securities and Exchange Commission (SEC) and will also disclose our financial results in dollars.
This is aligned with our investors´ wishes for an easier comparison of our performance against
our global peers. It also more accurately represents the company's operational framework, given
that a significant portion of our revenue is in dollars.
As JBS celebrates its 70th anniversary, we look to the future with confidence that our global
platform, coupled with our culture and strong team, will allow us to continue generating value for
our stakeholders, and create opportunities for both the communities where we operate and our
more than 260,000 employees around the world.
Gilberto Tomazoni, CEO Global JBS
2
MESSAGE FROM THE CEO
The results of this second quarter of 2023 once again demonstrated the
strength of our diversified global platform and our ability and agility to
implement operational management measures to improve our commercial
and industrial performance, even in an adverse scenario. Our promising
prospects for 2023 have begun to materialize. Although the global context
remains challenging for the protein sector, we have confidence that we
have started a gradual recovery of our margins.
45. 3
2Q23 CONSOLIDATED HIGHLIGHTS
Note: graphs in millions
2Q22
2Q23
2T22 2T23
NET REVENUE
92,191
89,383
2Q22 2Q23
10,363
4,470
11.2%
5.0%
2Q22 2Q23
ADJUSTED EBITDA NET LOSS
3,952
-264
380
1,813
2Q22 2Q23
FREE CASH FLOW
R$89.4Bn
-R$263.6Mn
R$4.5Bn
R$1.8Bn
46. NET REVENUE
ADJUSTED EBITDA
4
2Q23 CONSOLIDATED RESULTS
CONSOLIDATED NET REVENUE
In 2Q23, JBS recorded consolidated net revenue of R$89.4 billion, which represents a
decrease of 3% compared to 2Q22.
For the period, approximately 74% of JBS global sales were made in the domestic markets in
which the company operates and 26% through exports.
In the last 12 months, net revenue reached R$367.9 billion (US$ 71.3 billion).
In 2Q23, JBS adjusted EBITDA was R$4.5 billion, a decrease of 57%, compared to a very
strong EBITDA disclosed in 2Q22, but there was also an important improvement compared
to the last quarter. Adjusted EBITDA margin was 5.0% in the quarter.
In the last 12 months, adjusted EBITDA reached R$ 20.8 billion (US$4.0 billion), with an
adjusted EBITDA margin of 5.6%.
* Value Net of PIS/COFINS
R$ Million 2Q23 1Q23 ∆% 2Q22 ∆% LTM 2Q23
Net income for the period (including minority interest) (198.2) (1,429.5) - 4,284.1 - 4,850.7
Financial income (expense), net 1,667.9 1,554.1 7.3% 2,512.2 -33.6% 6,852.0
Current and deferred income taxes 70.1 (719.4) - 922.5 -92.4% (1,263.4)
Depreciation and amortization 2,657.5 2,592.8 2.5% 2,353.9 12.9% 10,314.2
Equity in subsidiaries (15.0) (14.4) 4.1% (20.9) -28.1% (53.9)
(=) EBITDA 4,182.3 1,983.6 110.8% 10,051.8 -58.4% 20,699.6
Other income / expenses 170.9 42.7 300.6% 33.8 405.9% 76.7
PPC Insurance Indemnity 0.0 (99.1) - 0.0 - (99.1)
PPC Europe Reestructuring 0.0 41.7 - 0.0 - 41.7
Impairment Europe Assets 4.5 108.2 -95.8% 0.0 - 112.7
Net indemnity J&F* 0.0 0.0 - 0.0 - (492.9)
Antitrust Agreements 89.1 71.2 25.2% 238.6 -62.6% 349.3
Fund for the Amazon 0.0 0.0 - 0.0 - 2.5
Donations and social projects 23.1 14.2 62.5% 39.2 -41.2% 62.2
(=) Adjusted EBITDA 4,470.0 2,162.4 106.7% 10,363.4 -56.9% 20,752.6
∆% ∆%
R$ Million R$ % NR R$ % NR 2Q23 vs 1Q23 R$ % NR 2Q23 vs 2Q22 R$ % NR
Net Revenue 89,382.6 100.0% 86,683.7 100.0% 3.1% 92,191.4 100.0% -3.0% 367,860.0 100.0%
Cost of Goods Sold (79,495.2) -88.9% (79,069.6) -91.2% 0.5% (76,002.9) -82.4% 4.6% (323,434.5) -87.9%
Gross Profit 9,887.5 11.1% 7,614.2 8.8% 29.9% 16,188.5 17.6% -38.9% 44,425.6 12.1%
Selling Expenses (5,678.7) -6.4% (5,775.3) -6.7% -1.7% (5,709.4) -6.2% -0.5% (24,174.9) -6.6%
General and Adm. Expenses (2,529.3) -2.8% (2,670.8) -3.1% -5.3% (2,773.6) -3.0% -8.8% (11,080.0) -3.0%
Net Financial Income (expense) (1,667.9) -1.9% (1,554.1) -1.8% 7.3% (2,512.2) -2.7% -33.6% (6,852.0) -1.9%
Equity in earnings of subsidiaries 15.0 0.0% 14.4 0.0% 4.1% 20.9 0.0% -28.1% 53.9 0.0%
Other Income (expense) (154.6) -0.2% 222.8 0.3% - (7.7) 0.0% 1912.7% 1,214.7 0.3%
Profit (loss) before taxes (128.1) -0.1% (2,148.9) -2.5% -94.0% 5,206.5 5.6% - 3,587.2 1.0%
Income and social contribution taxes (70.1) -0.1% 719.4 0.8% - (922.5) -1.0% -92.4% 1,263.4 0.3%
Minority interest (65.5) -0.1% (23.1) 0.0% 183.3% (331.8) -0.4% -80.3% (203.6) -0.1%
Net Income (Loss) (263.6) -0.3% (1,452.6) -1.7% -81.9% 3,952.3 4.3% -106.7% 4,647.1 1.3%
Adjusted EBITDA 4,470.0 5.0% 2,162.4 2.5% 106.7% 10,363.4 11.2% -56.9% 20,752.6 5.6%
Earnings per Share n.m. n.m. - 1.78 - 2.10
2Q23 1Q23 2Q22 LTM 2Q23
47. 5
NET RESULT
CASH FLOW FROM OPERATING ACTIVITIES AND FREE CASH FLOW
NET CASH PROVIDED (USED) BY INVESTING ACTIVITIES
2Q23 CONSOLIDATED RESULTS
NET FINANCIAL RESULTS
¹¹Includes the interest expenses from loans and financings which are included in the interest expense and interest income lines.
In 2Q23, JBS recorded a net loss of R$ 263.6 million.
In 2Q23, net debt financial expense was R$1.3 billion (US$265 million).
In 2Q23, cash flow from operating activities was R$5.3 billion, an important evolution when
compared to the previous quarter. Free cash flow, after adding property, plant and
equipment, interest paid and received, was R$1.8 billion, highlighting the improvement of the
working capital of US$355 million, mainly due to the reduction in inventories and the
improvement in accounts receivable.
In 2Q23, the total amount of cash flow from JBS investment activities was R$1.8 billion, with
the main investment being the addition of fixed assets (CAPEX) in the amount of R$2 billion
in the quarter.
R$ Million 2Q23 1Q23 ∆% 2Q22 ∆% LTM 2T23
Exchange rate variation 16.7 280.2 -94.0% (503.0) - 354.5
Fair value adjustments on derivatives 75.2 (76.5) - (41.7) - (546.8)
Interest expense¹ (2,092.2) (2,052.6) 1.9% (1,709.4) 22.4% (7,785.7)
Interest income¹ 394.2 351.3 12.2% 313.1 25.9% 1,557.5
Taxes, contribution, fees and others (61.8) (56.4) 9.4% (571.3) -89.2% (431.6)
Finance income (expense) (1,667.9) (1,554.1) 7.3% (2,512.2) -33.6% (6,852.0)
Interest expenses from loans and financings (1,409.4) (1,457.9) -3.3% (1,175.4) 19.9% (5,313.9)
Interest income from investments 98.4 90.7 8.4% 90.9 8.2% 380.1
Net debt financial expense¹ (1,311.0) (1,367.2) -4.1% (1,084.4) 20.9% (4,933.9)
48. 6
NET DEBT BRIDGE
Net debt showed a slight increase of US$168 million, despite the dividends payment in the
amount of US$448 million, maintenance of the capex plan at US$394 million; and accrued
interest of US$263 million. These amounts were offset by an adjusted EBITDA of US$903
million, and an improvement in working capital of US$355 million, as shown in the graph
above.
INDEBTEDNESS
(US$ million)
3.16x
(903)
4.15x
2Q23 CONSOLIDATED RESULTS
JBS ended the quarter with R$13.5 billion in cash and has US$3.3 billion available in revolving
credit lines, without guarantees, of which US$2.9 billion is at the JBS USA level and US$450
million at JBS Brazil, equivalent to R$15.9 billion at the closing exchange rate for the period.
Therefore, the Company’s total availabilitiy is R$29.4 billion.
At the close of 2Q23, net debt stood at US$16.7 billion (R$80.3 billion) an increase of US$168
million or 1% when compared to the closing of 1Q23. JBS ended the quarter with a leverage
of 3.87x in Reais and 4.15x in dollars given the reduction in EBITDA for the period.
2Q23 1Q23 ∆% 2Q22 ∆% 2Q23 1Q23 ∆% 2Q22 ∆%
Gross Debt 93,799.0 92,710.8 1.2% 97,415.5 -3.7% 19,463.6 18,248.7 6.7% 18,597.8 4.7%
(+) Short Term Debt 10,685.6 10,034.5 6.5% 12,711.3 -15.9% 2,217.3 1,975.1 12.3% 2,426.7 -8.6%
% of the Gross Debt 11.4% 10.8% 13.0% 11.4% 10.8% 13.0%
(+) Long Term Debt 83,113.4 82,676.3 0.5% 84,704.3 -1.9% 17,246.3 16,273.6 6.0% 16,171.1 6.6%
% of the Gross Debt 88.6% 89.2% 87.0% 88.6% 89.2% 87.0%
(-) Cash and Equivalents 13,548.7 8,964.7 51.1% 19,330.4 -29.9% 2,811.4 1,764.6 59.3% 3,690.4 -23.8%
Net Debt 80,250.3 83,746.1 -4.2% 78,085.1 2.8% 16,652.2 16,484.2 1.0% 14,907.4 11.7%
Leverage 3.87x 3.14x 1.64x 4.15x 3.16x 1.65x
R$ Million US$ Million
49. USD²
86.7%
BRL
13.3%
7
13.47% p.a.
5.00% p.a.
Debt Maturity
Schedule (U$ Mn)¹
Bonds
75%
Banks
16%
CRA
9%
PROFORMA INDEBTEDNESS
SOURCE
BREAKDOWN
CURRENCY & COST
BREAKDOWN
¹ Includes funds available in cash and revolving guaranteed credit lines from JBS USA and JBS Brazil
² Includes debts in other currencies, such as Euros and Canadian Dollars
6.13% p.a.
Cash and
Equivalents
Revolving credit facilities
USD2.8 bn in the US
Revolving credit facilities
USD450 mn in Brazil
Average Term = 9.3 yrs
Average Cost = 6.13% p.a.
CONSOLIDATED RESULTS 2Q23
2,811
2,217
298 377
163
2,064
1,081
755
1,786
1,890
2,930 2,983
505
2,414
2,850
450
Cash and
Cash
Equivalents
Short Term 2024 2025 2026 2027 2028 2029 2030 2031 2032 2033 2034... ...2052
50. 8
BUSINESS UNITS– IFRS US$
2Q23 BUSINESS UNITS
BUSINESS UNITS – USGAAP US$
Million 2Q23 1Q23 ∆% 2Q22 ∆% LTM 2Q23
Net Revenue
Seara R$ 10,310.4 10,329.6 -0.2% 10,680.1 -3.5% 43,439.9
JBS Brazil R$ 13,986.2 12,199.6 14.6% 14,108.1 -0.9% 56,697.3
JBS Beef North America R$ 28,770.2 27,356.8 5.2% 27,170.1 5.9% 113,946.2
JBS Australia R$ 7,471.4 7,244.9 3.1% 8,239.2 -9.3% 31,689.2
JBS USA Pork R$ 8,798.0 9,392.6 -6.3% 10,388.9 -15.3% 39,940.9
Pilgrim's Pride R$ 21,314.7 21,620.6 -1.4% 22,775.0 -6.4% 88,051.8
Others R$ 1,272.2 1,270.4 0.1% 1,160.2 9.6% 4,727.8
Eliminations R$ -2,540.5 -2,730.9 -7.0% -2,330.3 9.0% -10,633.1
Total R$ 89,382.6 86,683.7 3.1% 92,191.4 -3.0% 367,860.0
Adjusted EBITDA
Seara R$ 419.9 147.0 185.7% 1,505.4 -72.1% 3,051.0
JBS Brazil R$ 675.7 296.6 127.8% 803.2 -15.9% 2,137.8
JBS Beef North America R$ 433.5 115.8 274.2% 3,051.1 -85.8% 4,101.8
JBS Australia R$ 710.4 -17.7 - 712.3 -0.3% 1,817.2
JBS USA Pork R$ 386.3 231.7 66.8% 679.8 -43.2% 2,627.4
Pilgrim's Pride R$ 1,858.5 1,395.8 33.1% 3,635.7 -48.9% 7,102.0
Others R$ -11.3 -3.8 196.4% -21.4 -47.3% -72.9
Eliminations R$ -3.0 -3.0 0.0% -2.7 10.2% -11.8
Total R$ 4,470.0 2,162.4 106.7% 10,363.4 -56.9% 20,752.7
Adjusted EBITDA Margin
Seara % 4.1% 1.4% 2.6 p.p. 14.1% -10.0 p.p. 7.0%
JBS Brazil % 4.8% 2.4% 2.4 p.p. 5.7% -0.9 p.p. 3.8%
JBS Beef North America % 1.5% 0.4% 1.1 p.p. 11.2% -9.7 p.p. 3.6%
JBS Australia % 9.5% -0.2% 9.8 p.p. 8.6% 0.9 p.p. 5.7%
JBS USA Pork % 4.4% 2.5% 1.9 p.p. 6.5% -2.2 p.p. 6.6%
Pilgrim's Pride % 8.7% 6.5% 2.3 p.p. 16.0% -7.2 p.p. 8.1%
Others % -0.9% -0.3% -0.6 p.p. -1.8% 1.0 p.p. -1.5%
Total % 5.0% 2.5% 2.5 p.p. 11.2% -6.2 p.p. 5.6%
Million 2Q23 1Q23 ∆% 2Q22 ∆% LTM 2Q23
Net Revenue
JBS Beef North America US$ 5,810.6 5,266.4 10.3% 5,521.5 5.2% 22,084.7
JBS Australia US$ 1,509.0 1,394.7 8.2% 1,674.3 -9.9% 6,135.1
JBS USA Pork US$ 1,776.9 1,808.1 -1.7% 2,111.2 -15.8% 7,725.9
Pilgrim's Pride US$ 4,308.1 4,165.6 3.4% 4,631.6 -7.0% 17,070.1
Adjusted EBITDA
JBS Beef North America US$ 83.4 -23.2 - 624.3 -86.6% 576.1
JBS Australia US$ 129.5 18.5 600.0% 106.0 22.2% 285.9
JBS USA Pork US$ 27.0 66.4 -59.3% 213.6 -87.4% 282.6
Pilgrim's Pride US$ 248.7 151.9 63.7% 623.3 -60.1% 924.0
Adjusted EBITDA Margin
JBS Beef North America % 1.4% -0.4% 1.9 p.p. 11.3% -9.9 p.p. 2.6%
JBS Australia % 8.6% 1.3% 7.3 p.p. 6.3% 2.3 p.p. 4.7%
JBS USA Pork % 1.5% 3.7% -2.2 p.p. 10.1% -8.6 p.p. 3.7%
Pilgrim's Pride % 5.8% 3.6% 2.1 p.p. 13.5% -7.7 p.p. 5.4%
51. 9
SEARA
In 2Q23, Seara recorded net revenue of R$10.3 billion, a decrease of 3% compared to 2Q22, as
a reflection of lower net revenues from exports. Adjusted EBITDA reached R$420 million, with
a 4.1% EBITDA margin, which continues to be pressured by the global oversupply of poultry.
On the other hand, there is a sequential improvement, as a result of correcting operational
problems faced in previous quarters.
In the export market, net revenue in dollars was US$1.1 billion, which represents a decrease of
7% compared to 2Q22, given the lower average prices in dollars of 14% y/y, but it was partially
offset by the 8% growth in volumes sold. As previously mentioned, the lower prices were a
result of the poultry global oversupply, which continues to impact dollar prices.
Domestic market sales totaled R$5.1 billion, in line with 2Q22. The chicken oversupply
pressured the capacity to increase prices in the domestic market. In line with the investing
strategy in innovation, mix and quality, Seara inaugurated in March a breaded chicken plant in
Rolândia, the largest in Latin America. Despite still being in the ramp-up phase, this plant is at
an accelerated pace of production, and with a good sales performance. Seara also launched
new products with flavors that cater to the everyday recipes of the Brazilian consumer. And
finally, the launching of new items in the rotisserie chicken category.
Investments in the Seara brand continue to bring positive results for the Company. In addition
to consolidating itself as the most present brand in the Brazilian household in several
categories, it is the brand that grew the most in terms of penetration and repurchase between
2Q22 and 2Q23.
2Q23 BUSINESS UNITS
∆% ∆%
R$ % NR R$ % NR QoQ R$ % NR YoY R$ % NR
Net Revenue 10,310.4 100.0% 10,329.6 100.0% -0.2% 10,680.1 100.0% -3.5% 43,439.9 100.0%
Cost of Goods Sold (8,817.6) -85.5% (9,141.7) -88.5% -3.5% (8,082.2) -75.7% 9.1% (36,005.1) -82.9%
Gross Profit 1,492.8 14.5% 1,187.9 11.5% 25.7% 2,597.9 24.3% -42.5% 7,434.8 17.1%
Adjusted EBITDA 419.9 4.1% 147.0 1.4% 185.7% 1,505.4 14.1% -72.1% 3,051.0 7.0%
LTM 2Q23
2Q23 1Q23 2Q22
IFRS - R$ Million