SlideShare a Scribd company logo
1 of 1
Download to read offline
WAREN SPORTS SUPPLY, YEAR-END WORKSHEET, DECEMBER 31, 2013 Student Name__Craig Stenberg _______________
TRANSACTIONS LIST A Instructor____Day_________Date Due____2/3/2016_____________
(Accounts with no activity in this worksheet are excluded in this solution.)
ACCT ACCOUNT
NO. TITLE
DEBIT CREDIT DEBIT CREDIT ID # DEBIT ID # CREDIT DEBIT CREDIT DEBIT CREDIT DEBIT CREDIT
ASSETS
10100 Cash 11,025.19 108,942.44 108,942.44 108,942.44
10200 Accounts receivable 11,065.00 45,522.00 45,522.00 45,522.00
10300 Allowance for doubtful accounts 3,250.81 1,149.19 3,780.14 2,630.95 2,630.95
10400 Inventory 101,681.00 101,681.00 96,615.00 198,296.00 198,296.00
10600 Marketable securities 24,000.00 24,000.00 24,000.00
10800 Fixed assets 320,665.00 332,590.00 332,590.00 332,590.00
10900 Accumulated depreciation 81,559.50 81,559.50 35,109.50 116,669.00 116,669.00
LIABILITIES
20100 Accounts payable 11,279.35 8,767.15 8,767.15 8,767.15
20300 Federal income taxes withheld 1,326.76 1,706.61 1,706.61 1,706.61
20400 State unemployment taxes payable 281.17 87.93 87.93 87.93
20500 Federal unemployment taxes payable 83.31 26.05 26.05 26.05
20600 F.I.C.A. taxes payable 1,593.30 2,236.64 2,236.64 2,236.64
20700 Federal incomes taxes payable 29,797.00 52,184.99 52,184.99 52,184.99
20900 Interest payable 197.26 197.26 197.26
21000 Notes payable 80,000.00 80,000.00 80,000.00
STOCKHOLDERS' EQUITY
26000 Common stock 225,000.00 225,000.00 225,000.00 225,000.00
29000 Retained earnings 90,264.99 90,264.99 90,264.99 90,264.99
REVENUE AND GROSS PROFIT
30100 Sales 1,588,571.00 1,588,571.00 1,588,571.00
30200 Sales returns and allowances 61,111.00 61,111.00 61,111.00
30300 Sales discounts taken 15,405.82 15,405.82 15,405.82
30400 Cost of goods sold 1,024,887.29 1,024,887.29 1,024,887.29
30500 Purchases 1,132,955.00 1,132,955.00 0.00
30600 Purchases returns and allowances 19,445.00 19,445.00 0.00 0.00
30700 Purchases discounts taken 16,650.40 16,650.40 0.00 0.00
30800 Freight-in 24,642.69 24,642.69 0.00 0.00
31200 Miscellaneous revenue 825.00 825.00 825.00
EXPENSES
40100 Rent expense 57,600.00 57,600.00 57,600.00
40200 Advertising expense 21,905.00 21,905.00 21,905.00
40300 Office supplies expense 5,621.45 5,621.45 5,621.45
40400 Depreciation expense 35,109.50 35,109.50 35,109.50
40500 Wages and salaries expense 141,198.14 141,198.14 141,198.14
40600 Payroll tax expense 11,528.80 11,528.80 11,528.80
40700 Federal income tax expense 52,184.99 52,184.99 52,184.99
40800 Interest expense 197.26 197.26 197.26
40900 Bad debt expense 3,780.14 3,780.14 3,780.14
41000 Other operating expense 29,287.75 29,287.75 29,287.75
Sub-totals 444,436.19 444,436.19 2,115,140.28 2,115,140.27 0.00 1,248,869.58 0.00 1,248,869.58 2,169,167.58 2,169,167.57 1,459,817.14 1,589,396.00 709,350.44 579,771.57
Net Income (Loss) ----------------- ----------------- ----------------- ----------------- -------- ----------------- -------- ----------------- ----------------- ----------------- 129,578.86 129,578.86
Less Income Tax Exp. Payable 52,184.99 52,184.99
TOTALS 77,393.87 77,393.87
TRIAL BALANCE
12/31/13
UNADJUSTED
TRIAL BALANCE
12/31/12
POST CLOSING
BALANCE
SHEETYEAR-END ADJUSTMENTS
ADJUSTED
TRIAL BALANCE
INCOME
STATEMENT

More Related Content

Similar to ACTG 335 Year End Worksheet

Presentation to investors
Presentation to investorsPresentation to investors
Presentation to investorsVictoria Rock
 
viability-presentation-se-98b.pptx
viability-presentation-se-98b.pptxviability-presentation-se-98b.pptx
viability-presentation-se-98b.pptxSAYKEATTAN
 
Ejecuciones de ingresos a junio 2016
Ejecuciones de ingresos  a junio 2016Ejecuciones de ingresos  a junio 2016
Ejecuciones de ingresos a junio 2016German Rodriguez
 
Trial BalanceChester, Inc.Trial Balances for years ending December.docx
Trial BalanceChester, Inc.Trial Balances for years ending December.docxTrial BalanceChester, Inc.Trial Balances for years ending December.docx
Trial BalanceChester, Inc.Trial Balances for years ending December.docxturveycharlyn
 
BTE 302TEST 1NameCMR 302Test IAnswer the Following.docx
BTE 302TEST 1NameCMR 302Test IAnswer the Following.docxBTE 302TEST 1NameCMR 302Test IAnswer the Following.docx
BTE 302TEST 1NameCMR 302Test IAnswer the Following.docxcurwenmichaela
 
S&W Second Quarter Fiscal 2018 Financial Results
S&W Second Quarter Fiscal 2018 Financial Results S&W Second Quarter Fiscal 2018 Financial Results
S&W Second Quarter Fiscal 2018 Financial Results Agropages Com
 

Similar to ACTG 335 Year End Worksheet (20)

Literal g3 cedulagastos-dic_2017
Literal g3 cedulagastos-dic_2017Literal g3 cedulagastos-dic_2017
Literal g3 cedulagastos-dic_2017
 
Literal g3 cedulagastos-jun_2017
Literal g3 cedulagastos-jun_2017Literal g3 cedulagastos-jun_2017
Literal g3 cedulagastos-jun_2017
 
Literal g3 cedulagastos-abr_2017
Literal g3 cedulagastos-abr_2017Literal g3 cedulagastos-abr_2017
Literal g3 cedulagastos-abr_2017
 
Literal g3 cedulagastos2017-feb_2017
Literal g3 cedulagastos2017-feb_2017Literal g3 cedulagastos2017-feb_2017
Literal g3 cedulagastos2017-feb_2017
 
Literal g3 cedulagastos-ago_2017
Literal g3 cedulagastos-ago_2017Literal g3 cedulagastos-ago_2017
Literal g3 cedulagastos-ago_2017
 
Literal g3 cedulagastos-jul_2017
Literal g3 cedulagastos-jul_2017Literal g3 cedulagastos-jul_2017
Literal g3 cedulagastos-jul_2017
 
Literal g3 cedulagastos-may_2017
Literal g3 cedulagastos-may_2017Literal g3 cedulagastos-may_2017
Literal g3 cedulagastos-may_2017
 
Literal g3 cedulagastos-nov_2017
Literal g3 cedulagastos-nov_2017Literal g3 cedulagastos-nov_2017
Literal g3 cedulagastos-nov_2017
 
Literal g3 cedulagastos-sep_2017
Literal g3 cedulagastos-sep_2017Literal g3 cedulagastos-sep_2017
Literal g3 cedulagastos-sep_2017
 
Literal g3 cedulagastos-oct_2017
Literal g3 cedulagastos-oct_2017Literal g3 cedulagastos-oct_2017
Literal g3 cedulagastos-oct_2017
 
Literal g3 cedulagastos2017-mar_2017
Literal g3 cedulagastos2017-mar_2017Literal g3 cedulagastos2017-mar_2017
Literal g3 cedulagastos2017-mar_2017
 
Literal g3 cedulagastos-dic_2018
Literal g3 cedulagastos-dic_2018Literal g3 cedulagastos-dic_2018
Literal g3 cedulagastos-dic_2018
 
Presentation to investors
Presentation to investorsPresentation to investors
Presentation to investors
 
viability-presentation-se-98b.pptx
viability-presentation-se-98b.pptxviability-presentation-se-98b.pptx
viability-presentation-se-98b.pptx
 
Ejecuciones de ingresos a junio 2016
Ejecuciones de ingresos  a junio 2016Ejecuciones de ingresos  a junio 2016
Ejecuciones de ingresos a junio 2016
 
Ingresos 2013
Ingresos 2013Ingresos 2013
Ingresos 2013
 
Literal g3 g-feb_2018
Literal g3 g-feb_2018Literal g3 g-feb_2018
Literal g3 g-feb_2018
 
Trial BalanceChester, Inc.Trial Balances for years ending December.docx
Trial BalanceChester, Inc.Trial Balances for years ending December.docxTrial BalanceChester, Inc.Trial Balances for years ending December.docx
Trial BalanceChester, Inc.Trial Balances for years ending December.docx
 
BTE 302TEST 1NameCMR 302Test IAnswer the Following.docx
BTE 302TEST 1NameCMR 302Test IAnswer the Following.docxBTE 302TEST 1NameCMR 302Test IAnswer the Following.docx
BTE 302TEST 1NameCMR 302Test IAnswer the Following.docx
 
S&W Second Quarter Fiscal 2018 Financial Results
S&W Second Quarter Fiscal 2018 Financial Results S&W Second Quarter Fiscal 2018 Financial Results
S&W Second Quarter Fiscal 2018 Financial Results
 

ACTG 335 Year End Worksheet

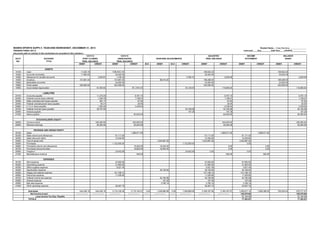
  • 1. WAREN SPORTS SUPPLY, YEAR-END WORKSHEET, DECEMBER 31, 2013 Student Name__Craig Stenberg _______________ TRANSACTIONS LIST A Instructor____Day_________Date Due____2/3/2016_____________ (Accounts with no activity in this worksheet are excluded in this solution.) ACCT ACCOUNT NO. TITLE DEBIT CREDIT DEBIT CREDIT ID # DEBIT ID # CREDIT DEBIT CREDIT DEBIT CREDIT DEBIT CREDIT ASSETS 10100 Cash 11,025.19 108,942.44 108,942.44 108,942.44 10200 Accounts receivable 11,065.00 45,522.00 45,522.00 45,522.00 10300 Allowance for doubtful accounts 3,250.81 1,149.19 3,780.14 2,630.95 2,630.95 10400 Inventory 101,681.00 101,681.00 96,615.00 198,296.00 198,296.00 10600 Marketable securities 24,000.00 24,000.00 24,000.00 10800 Fixed assets 320,665.00 332,590.00 332,590.00 332,590.00 10900 Accumulated depreciation 81,559.50 81,559.50 35,109.50 116,669.00 116,669.00 LIABILITIES 20100 Accounts payable 11,279.35 8,767.15 8,767.15 8,767.15 20300 Federal income taxes withheld 1,326.76 1,706.61 1,706.61 1,706.61 20400 State unemployment taxes payable 281.17 87.93 87.93 87.93 20500 Federal unemployment taxes payable 83.31 26.05 26.05 26.05 20600 F.I.C.A. taxes payable 1,593.30 2,236.64 2,236.64 2,236.64 20700 Federal incomes taxes payable 29,797.00 52,184.99 52,184.99 52,184.99 20900 Interest payable 197.26 197.26 197.26 21000 Notes payable 80,000.00 80,000.00 80,000.00 STOCKHOLDERS' EQUITY 26000 Common stock 225,000.00 225,000.00 225,000.00 225,000.00 29000 Retained earnings 90,264.99 90,264.99 90,264.99 90,264.99 REVENUE AND GROSS PROFIT 30100 Sales 1,588,571.00 1,588,571.00 1,588,571.00 30200 Sales returns and allowances 61,111.00 61,111.00 61,111.00 30300 Sales discounts taken 15,405.82 15,405.82 15,405.82 30400 Cost of goods sold 1,024,887.29 1,024,887.29 1,024,887.29 30500 Purchases 1,132,955.00 1,132,955.00 0.00 30600 Purchases returns and allowances 19,445.00 19,445.00 0.00 0.00 30700 Purchases discounts taken 16,650.40 16,650.40 0.00 0.00 30800 Freight-in 24,642.69 24,642.69 0.00 0.00 31200 Miscellaneous revenue 825.00 825.00 825.00 EXPENSES 40100 Rent expense 57,600.00 57,600.00 57,600.00 40200 Advertising expense 21,905.00 21,905.00 21,905.00 40300 Office supplies expense 5,621.45 5,621.45 5,621.45 40400 Depreciation expense 35,109.50 35,109.50 35,109.50 40500 Wages and salaries expense 141,198.14 141,198.14 141,198.14 40600 Payroll tax expense 11,528.80 11,528.80 11,528.80 40700 Federal income tax expense 52,184.99 52,184.99 52,184.99 40800 Interest expense 197.26 197.26 197.26 40900 Bad debt expense 3,780.14 3,780.14 3,780.14 41000 Other operating expense 29,287.75 29,287.75 29,287.75 Sub-totals 444,436.19 444,436.19 2,115,140.28 2,115,140.27 0.00 1,248,869.58 0.00 1,248,869.58 2,169,167.58 2,169,167.57 1,459,817.14 1,589,396.00 709,350.44 579,771.57 Net Income (Loss) ----------------- ----------------- ----------------- ----------------- -------- ----------------- -------- ----------------- ----------------- ----------------- 129,578.86 129,578.86 Less Income Tax Exp. Payable 52,184.99 52,184.99 TOTALS 77,393.87 77,393.87 TRIAL BALANCE 12/31/13 UNADJUSTED TRIAL BALANCE 12/31/12 POST CLOSING BALANCE SHEETYEAR-END ADJUSTMENTS ADJUSTED TRIAL BALANCE INCOME STATEMENT