2. Increased Neurovascular Thermoregulatory responses on
cutaneous blood vessels and sweat glands due to an Increase in
Core temperature during passive heat stress.
WilsonChristopher.D,Saade Marina,WilsonConnor,WongAmanda,Yuan AngelaandYung Ching.
Abstract: Heatexchange withthe environmentisparamountfor homeostasis of the humanbody.
How the body dealswithinternal temperature changeshasbeen afocuspointof past research
aimingtounderstand how thermoregulatory mechanismsfunctionunder differentconditions.The
purpose of thisstudywas to investigate the neurovascularchangesassociatedwitharise inbody
Core Temperature (CT),whilethe body’sability todissipate heatislimited.Additionally,further
extratestingwasinvestedintodiscoveringthe primarythermoreceptorsresponsiblefor
thermoregulatory controls while conflictinginformationwas senttosensorycontrol centres. CTwas
elevated byincreasingambienttemperature viasubmergingoursubjects’ lowerlimbsinaheatbath
and insulatingtheminthermal blankets. Anextratestprotocol wasa continuationof heatingtest,
withthe additionof placinga hand inan ice bath,with conflictingsignalsof hotandcoldbeing
deliveredto hypothalamiccontrol centres. Total peripheral Resistance (TPR) andMeanArterial
Pressure showedsignificantdecreases incorrelationwithanincrease inCT.Furthermore,Cardiac
Output,HeartRate and MetabolicRate showedsignificantincreases,proposingapossible
compensatoryresponse tothe fall observedinTPRandMAP. Extra testingshowednosignificant
change in cardiac andskinresistance values,withthe exceptionto temperature of the forehead.
Increasedvasodilationof peripheralblood vessels,pressure changesandwith cardiacandmetabolic
compensatory responses indicatedarelationshipwithelevated CT.However,more researchis
neededtoprovide aclearerinsightintopotential conflictionsbetweencentral andperipheral
thermoreceptors.
Key Words: Thermoregulation, Core Temperature, Peripheral Resistance, Arterial Pressure.
Introduction
Thermoregulationisanintegral partof any livingorganism, inwhichthisheatexchangewiththe
external environmentgovernsall biological mechanisms.InHumans,thermoregulatorysystemsare
controlledbythe homeostaticregulationof the HypothalamicThermoregulatoryCentre, which
directsphysiological alterationsinresponsetochangesinambienttemperature(Tanseyetal.2014).
The hypothetical situationsof the neurovascularthermoregulatoryresponsesinrelationtoincrease
ininternal bodytemperature are of particularinterest.Whatwouldhappentosympatheticand
cardiac activitywhenthe bodyisheatedbeyonditsthermal neutralzone hasyettobe fully
documented,withchangesin sweatglandactivityand cutaneousbloodvesselsstillremaining
precarious.Concurrently,withchangesinambienttemperature beyond/bellow the thermal neutral
zone,Core thermorecepetorslocatedinthe anteriorHypothalamusandPeripheral
3. thermorecepetorslocatedinthe cutaneouslayer of the skinreporttothe Hypothalamiccontrol
centre so appropriate compensatorymechanismscanbe initiated(Bratincsak andPalkovits.2005;
Tanseyetal. 2014). What remainsuncleariswhichof these twothermorecpetorscouldbe the
primaryinitiatorforthermoregulatorystabilization.
Past researchhasshownthat functioningof cardiacactivitycanbe effected byheating(Cabanacet
al.1977; Ichinose andNishiyasu.2012; NielsenandBodil etal.1993; Stephensonetal.1981), with
particularinterestbeinginvestedintothe effectof internal temperature changesandthe effecton
sympatheticcontrol onbloodvessels(Kellog.2006; Kurzet al.1995; Lopezand Michael et al.1994;
Tanseyetal. 2014) and stimulationof cutaneoussweatglands(Charkoudian.2003; Havenith.2001;
Juniperetal. 1967). However,alotof studyhas gone intothe effectof bodymechanismstocombat
hypothermiaandthe waycoolingcancontrol thermoregulatoryresponse (Cabanaetal.1977). With
responsesdue toheating,itstill remainingrelativelyunclearinitsfunctioning’sinthe academic
community.Whatare neededtobe investigatedare the directphysiological neurovascular
responsesthatoccur duringa periodof passive heartstress,associatingalinkage betweenarise in
meanbodytemperature anditseffectsonsympatheticcontrol of sweatglandsandbloodvesselsas
well aschangesincardiac activity.
Furthermore,whatisunclearisthatas central receptorsare stimulatedbyanincrease incore
temperature and peripheral receptorsare stimulatedbycool temperatures,how the hypothalamic
control centreswill processthisinformation.Ithasbeenreportedthatelevationof body
temperature willinitiate ahypothalamicnegative feedbackloopenhancingprocessesof bodyheat
dissipationtothe externalenvironmentdue tocentral thermoreceptors(KennyandJay.2013).
Conversely,accordingtoan experimentconductedbyBratincsakandPalkovits(2005),as laboratory
Rats were stimulatedbycoldambienttemperaturesperipheral thermorecpetorsappearedtobe the
maininitiatorof thermoregulatoryactionswithlittle stimulationobservedinintracranial
thermorecpetors.Thus, inhumanstudies,simultaneousexposure tobothcool andhot
temperatures,whilemeasuring skintemperaturesalongwith skinresistance andcardiacchanges;it
shouldbe possible todetermineacorrelationwithanincrease inCore temperature.
Firstly,the purpose of thisstudywasto determinethe effectsarise incore bodytemperature will
have for neurovascularthermoregulatory responses.Secondly,toobservethe effectsstimulationof
peripheral andcentral thermorecpetors hasoncentral control centres,whileendeavouring tofind
the primarythermoreceptorthatgovernsthermoregulatoryresponses.Lastly,we testedthe
hypothesisthatinHumans,asCore Temperature increasesadecrease intotal peripheral resistance
of cutaneousbloodvesselsandskinresistance fromsweatgladsecretionwould be observedasa
resultof passive heatstress.
Methods
Subjects– Studieswere performedon14 healthymale subjects(age: 20.6 ± 0.63 yr; height:178.18
± 6.4 cm; weight:74.85 ± 12.7 kg; surface area ratio:1.9 ± 0.18 m2
) and 14 healthyfemale subjects
(age:20.9 ± 0.83 yr; height:166.37 ± 1.0 cm; weight:60.86 ± 11.68 kg; surface area ratio:1.69 ± 0.2
m2
).Each subjectwasinformedonthe purpose andprocedure of thisstudy.All subjectswitha
4. historyof respiratoryand/orcardiacmedical issueswere advisednottoparticipate andwere
excludedfromthe experiments.Verbalconsentwasobtained.
Study protocol – Subjectswere informednottoconsume anyfood,aswell asto emptytheirbladder
30 minutespriortothe experiment.Duringcontrol period,subjectwereseatedandrestedat
standardlaboratoryambienttemperature andhumidity(≈25°Cand30-50%RH). Subjectswere
connectedtoa FinometerMINIfor40 minutesforthe control periodaswell asthe 40 minutes
heatingperiodand5 minutesforthe extratest.Duringeachof the tests,subjectsforearmwas
placedona boardmountedbya tripod,the subjectsmovementswere kepttoaminimal.Forthe
heatingperiod,subject’slegswere submergedinaheatbath,withtemperature maintained
between41-43°C. Additionally,subjectswerewrappedinasheet,blanketanda thermal blanket.
Subject’score temperature wasconstantlymaintained,withtestingtobe stoppedif temperature
rose above 40°C. Duringthe extratest,subject’slegsare keptinthe heatbath andwere remained
insulatedwithsheetsand blankets.During40minof the control and 40min of the heatingtest,
recordingswere measuredin10minute intervals,withmeanvaluescalculatedfromtwoorthree
recordingstakenacrosseach 10 minute interval. Forthe five minute periodforthe extra test,one of
the subject’shandswasplacedinan ice bath. Recordingswere takenin1minute intervalsacrossthe
five minute period,withfirstrecordingbeginningone minuteintothe test.All Recordingstakenfor
the extratestwere conductedthe same wayas theywere inthe heatingandcontrol periods. All of
the subjectswere testedforeachexperiment,withall studiesbeingconductedonthe same day.
Measurements– In all the tests,Core Temperature (CT),local skintemperature (measuredinthree
locations,the finger,the forearmandthe forehead) andSkinResistance (SR) were measured.Oral
Temperature (OT) wasmeasuredonlyforthe control andheatingtests.CTwas measuredwithasoft
micro-thermistorinsertedintothe external auditorymeatus,withtemperature displayedona
“PowerLab”applicationchart(recordingssetforarange between35-39°C).OT wasmeasuredusing
a clinical thermometer,withthe thermometerheldunderthe subject’stonguefor2 minutesto
allowaccurate measurement.Local skintemperature wasmeasuredusingan“Ezi Scan”
thermometer,eachmeasurementwasconductedonthe same positiontoensure accuracy.SRwas
measured,withanindifferentelectrode (appliedwithconductingjelly) strappedontosubject’sarm.
A searchingelectrodeconnectedtoanohm-meter,(andbycircuit,the indifferentelectrode)
measuredthe subject’ssupraclavicularareafordetectable SR(SRValues∞≤were recordedtothe
nearesttrue value).Additionally,HeartRate (HR),CardiacOutput(CO),Stroke Volume(SV),Mean
Arterial Pressure (MAP),Total Peripheral Resistance(TPR),SystolicBloodPressure (SBP)and
DiastolicBloodPressure (DBP) were measuredacrossall tests.All cardiacmeasurementswere
measuredusingthe FinometerMINI.Respiratory values,Tidal Volume (VT),Frequency(Breathsper
minute),minuteventilation(VE) andoxygenconsumption(VO2) weremeasuredforthe control and
heatingperiodsonly.Allrespiratoryvalueswere measuredusinga“PowerLab”pneumotachometer;
all valueswere ‘zeroed’tobaseline betweeneachreading.MetabolicRate (MR) wascalculatedfor
bothcontrol and heatingtests ( MR= ((VO2l/min)×(KJequivalentkj/l)×60) ⁄(Bodysurface Aream2
) ).
CT, local skintemperaturesandSRwere identifiedin3-minuteintervalsacrossthe 40-mintesof the
control and heatingperiods.OT,Cardiacresponsesandrespiratoryresponseswereidentifiedtwice
in5-minute intervalsacrossthe control andheatingperiods. Duringthe extratestperiodCT,local
skintemperatures,SRandcardiacresponseswere identifiedin1-minuteintervalsduringthe 5-
minute period.“MicrosoftWindows”program“Excel”wasusedto uploadandaverage all
measurementsobtainedacrossall tests.
5. Statistical Analysis– Student’spairedT-testswasused todetermine statisticalsignificant
differencesbetweentemperature changesof CT,local skinttemperaturesandOTas well asSR,
cardiac responsesandrespiratoryresponsesbetweenthe recordingsof the lastcontrol
measurementandreadingsof the heatingperiod.Additionally,statistical significance wasassessed
betweenvaluesforCT,local skintemperatures,all cardiacresponsesaswell asSRduringthe last
recordingof the heatingperiodandtheirextratestmeasurementsateachone minute interval.All
statistical testswere conductedforeachsubject.P-valuesforstatistical analysisforsignificance was
setfor <0.05. Means,standard errorvaluesof data and anystatistical representative illustrations
foundinresultswere calculatedandconstructedusingthe Microsoft’sexcel program.
Results
Temperature - Baseline recordingsbeforeonsetof the heatingtestremainedconstantforCT,OT
and Local skinTemperatures(36.19°C± 0.14°C forCT, 36.48°C ± 0.05°C forOT, 34.22°C ± 0.13°C for
Foreheadtemperature,31.70°C ± 0.25°C for Forearmtemperature,31.19°C ± 0.45°C forFinger
temperature) withthe exceptionattime period -30intocontrol were meanFingertemperature
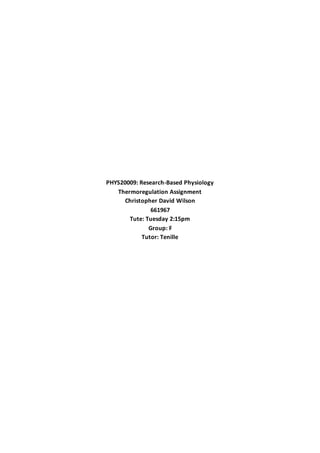
recordedan significantincrease (p<0.05). Figure 1 representschangesinCT,OTand local Skin
temperaturesfromthe onsetof the control period(from -40minto-10min) and forthe durationof
the heatingtest(from10minto 40min). Duringthe heatingtest,statisticallysignificantincreasesin
meanCT, Forearmtemperature andFingertemperaturewere recorded20minin(36.59°C ± 0.14°C,
32.25°C ± 0.31, and 32.52°C ± 0.39°C; p < 0.05 for eachrespectively).Additionally,significant
increaseswere observedforall meantemperature valuesat30min andat the end readingof the
heatingperiod(36.70°C ± 0.14°C, 36.68°C ± 0.07°C, 34.65°C ± 0.14°C, 32.35°C ± 0.28°C and 32.93°C ±
0.37°C for CT, OT, Forehead,ForearmandFingerrespectively;p< 0.05 for all measurementsat
30min; 36.65°C ± 0.15°C, 36.79 ± 0.06°C, 34.71°C ± 0.17°C, 32.92°C ± 0.30° and33.40°C ± 0.33°C;
p<0.05 for all measurementsat40min).All significantdatapointsrecordedduringthe heatingtest
periodwere measuredincomparisontothe lastmeanvalue takenduringthe control (36.9°C ±
0.14°C, 36.48°C ± 0.05°C, 34.22°C ± 0.13°C, 31.70°C ± 0.25°C, 31.19°C ± 0.45°C; for CT, OT,Forehead,
Forearmand Fingertemperature at -10minrespectively).
Baseline readingsforthe extratestwere notsignificantlydifferentfromthe closure of the heating
period.Figure 2representschangesinCT,Foreheadtemperature,ForearmtemperatureandFinger
temperature duringthe extratest(5minduration) withone recordingtakeneveryminute.A
Statistical significantincreaseswasobservedforForeheadTemperature(34.06°C± 0.24°C; p<0.05 at
5min relative tolastheatingmeasurementof the Foreheadat0min:34.71°C ± 0.17°C).
6. 30.00
31.00
32.00
33.00
34.00
35.00
36.00
37.00
-40 -30 -20 -10 0 10 20 30 40
Temperature(oC)
Time (mins)
Core
Temperature
Oral
Temperature
Forhead Temp
Forearm
Temperature
Finger
Temperature
* * * * *
*
*
*
*
*
*
*
*
*
Figure 1: Changes in Core Temperature (CT), OralTemperature (OT) and localSkinTemperarures (For Forehead,Forearm andFingure) during controlperiod
(-40min to -10min)theninto theheating period (10min to40min). Baseline temperatures wererecorded at labratory ambient temperature, heating test
results wererecodedwhilesubject's legs weresubmerged in a heat bath (41-43°C). Values aremeans ±SE (n=28). An significantdifferencewas recorded for
Fingure temperaturein controlperiod attime -30min (p<0.05). Singificant differences wererecorded for CT, Forearmand Finger at20min into heating test
(p<0.05 respectively).Singificant differences wererecorded for allparameters at 30min and40min intoheating test(p<0.05 for allparemeters ateachtime
point). All significant readings in the heating test weremeasured incomparison tolast recording ofthecontrol (-10min).
* Represents significant value
(p<0.05) against t=-10
31.00
32.00
33.00
34.00
35.00
36.00
37.00
38.00
0 1 2 3 4 5
Temperature(°C)
Time (min)
Core Temperature
Forehead Temperature
Forearm Temperature
Finger Temperature
*
Figure 2: Changesin CoreTemperature (CT) andlocal skintemperatures (For Froehead,Forearm andfinger) for theduration ofthe
extra test(1-5min). Meausurment at time0minis from thelast reading taken at end ofheating test. Temperatures were recorded
with subject's legs submergedin a heatbath(41-43°C)andhand placed in anicebucket.Values aremeans ±SE(n=28). An Significant
differencewas recordedat 4mininto theextra test for Fiorehead termperature(p<0.05). Significantrecordings weremeasured in
comparison to thelastvalueoftheheating period (0min).
* Represents significant value
(p<0.05) against t=0
Skin resistance – MeasurementsforSRremainedconstantforbaseline recordings(2.77Ω ± 0.24Ω at
-10min) before the onsetof the heatingperiod.Figure3representschangesinSRforthe durationof
the heatingperiod(10-40min) incomparisontoa control period(-40 to -10min).Statistical
significantdecreaseswereobservedinmeanSRvaluesateachreadingforthe heatingtest
measuredin10minintervals(1.64Ω ± 0.31Ω, 0.40Ω ± 0.15Ω, 0.17Ω ± 0.04Ω and 0.10Ω ± 0.02Ω;
p<0.05 at eachtime point).All significantdatapointsrecordedduringthe heatingtestperiodwere
measuredincomparisontothe lastmeanvalue takenduringthe control (2.77Ω ± 0.24Ω for SR at -
10min).
7. 0.00
0.50
1.00
1.50
2.00
2.50
3.00
3.50
-40 -30 -20 -10 0 10 20 30 40
SkinResistance(Ω)
Time (mins)
Figure 3: Changes in Skinresistance(SR) during control period(-40min to -10min) thenintothe heating period(10minto
40min). SR was recorded at ambiant labratorytemperaturesfor control period, subjects legs were submergedinheat
bath (41-43°C) andcoveredin blankets and thermal blanket. Valuesare means ± SE (n=28). Significant differenceswere
observedfor eachrecordinginthe heating period(p<0.05 at eachmeasurment point) incomparisonto the last
measurment taken inthe control period (-10min).
*
* * *
* Represents significant value (p<0.05) against t=-10
0.00
0.02
0.04
0.06
0.08
0.10
0.12
0.14
0.16
0 1 2 3 4 5
SkinResistance(Ω)
Time(min)
Figure 4: Changes in Skinresistance (SR)from sweatingduring for the durationof the extra test (1-5min).
Meausurment at time 0minis from the last reading taken at end ofheating test. SR was recorded withsubjects
legs submerged in heat bath(41-43°C) andhandplacedinice bath. Values are means ± SE (n=28).
SR recordingsduringextratestperiodremainedrelativelyconstantwithnosignificantdifference
betweenfirstandlastreadingstaken(0.10Ω ± 0.02Ω at time 0min;0.11Ω ± 0.03Ω at time 5 min).
Figure 4 representschangesobservedinSRforthe 5min extratestperiod.
Cardiovascular – MeasurementsforSBP,DBPand MAP remainedconstantthroughoutbaseline
recordings(120.91mmHg ± 3.06mmHg, 70.21mmHg ± 2.18mmHg and 87.89mmHg ± 2.40mmHg for
SBP,DBP and MAP respectivelyat -10min).Figure 5representsall changesinSPB,DBPand MAPfor
the durationof the heatingperiod(10-40min) incomparisontothe control (-40 to -10min).
Statisticallysignificantincreaseswereobservedforthe meanvaluesof SBPduring30minand 40min
periodsof the heatingtest(125.82mmHg ± 3.37mmHg and 126.11mmHg ± 3.43mmHg; p<0.05 for
both30min and 40min intervalsrespectively).Inaddition,statisticallysignificantdecreaseswere
recordedformeanvaluesof DBP and MAPduringboth the 30min and 40min time periodsof the
heatingtest(66.12mmHg ± 1.80mmHg and64.50mmHg ± 170mmHg; p<0.05 and0.00 at 30min and
40min respectivelyforDBP;83.18mmHg ± 1.83mmHg and 82.07mmHg ± 1.76mmHg; p<0.05 at
30min and 40min respectivelyforMAP).All significantdatapointsrecordedduringthe heatingtest
periodwere measuredincomparisontothe lastmeanvalue takenduringthe control (120.91mmHg
± 3.06mmHg, 70.21mmHg ± 2.18mmHg, 87.89mmHg ± 2.40mmHg; for SBP,DBP and MAP at -
10min).Recordingsforthe extraTest period(5min) remainedrelativelyconstantthroughouttesting
(126.11mmHg ± 3.43, 64.11mmHg ± 1.76mmHg and 82.07mmHg ± 1.76mmHg for SBP,DBP and MAP
8. respectivelyattime 0min;124.07mmHg ± 3.53mmHg, 67.39mmHg ± 1.78mmHg and 84.75mmHg ±
1.61mmHg respectivelyattime 5min).Figure 6representschangesobservedinthe extratestperiod.
HR measurementswere stable atbaseline before initiationof the heatingperiod(78.71bpm ±
2.39bpm at -10min).Figure 7 representschangesinHRduringthe heatingperiod(10-40min) in
comparisontothe control (-40 to -10min).Statisticallysignificantincreaseswere observedformean
valuesof HR at times20min,30min and 40min of heatingperiod(88.91bpm ± 2.82bpm, 92.86bpm ±
2.81bpm and 96.27bpm ± 3.02; p<0.05 for each time interval respectively). All significantdata
pointsrecordedduringthe heatingtestperiodweremeasuredincomparisontothe lastmeanvalue
takenduringthe control (78.71bpm ± 2.39bpm forHR at -10min).Extratest recordingsforHR were
not significateacrossthe 5minperiod(96.27bpm ± 3.02bpm and 92.34bpm ± 4.50bpm fortimes
0min and5min respectively).Figure8representsthe changesinmeanHRvaluesforthe durationof
the extratest.
Recordingsof SV were constantforbaseline measurementsbefore onsetof heatingperiod(81.13mL
± 2.56mL at -10min).Figure 9 isthe representationof meanSV valuesforthe heatingperiod(10-
40min) and control (-40 to -10min).Statisticallysignificant increaseswereobservedformeanSV
values30minand 40min intothe heatingperiod(86.20mL ± 3.26mL and86.34mL ± 3.38mL; p<0.05
for eachtime pointrespectively).Allsignificantdatapointsrecordedduringthe heatingtestperiod
were measuredincomparisontothe lastmeanvalue takenduringthe control (81.13ml ± 3.73ml for
SV at -10min).MeanSV valuesforextratestperiodshowednosignificantchange in5minof testing
(86.34mL ± 3.38mL and 84.29mL ± 4.26mL at 0min and 5minrespectively).Figure 10represents
changesinmeanSV valuesthroughoutthe Extratest.
Mean CO valuesrecordedforbaseline wereconsistentbefore onsetof the heatingperiod
(6.32L/min± 0.33L/min at -10min).Figure 11 representsthe changesof meanCOvaluesobserved
for the durationof the heatingperiod(10-40min) comparedtothe control (-40 to -10min).
StatisticallysignificantincreaseswererecordedformeanCOvalues at20min, 30min and 40min into
the heatingperiod(6.92L/min ± 0.34L/min,7.05L/min ± 0.29L/min and 7.23L/min ± 0.33L/min;
p<0.05 for each time pointrespectively). All significantdatapointsrecordedduringthe heatingtest
periodwere measuredincomparisontothe lastmeanvalue takenduringthe control (6.32L/min ±
0.33L/min for CO at -10min). CO valuesof the extratestperiod(5min) hadno significantchange
(7.23L/min± 0.33L/min and 7.30L/min ± 0.36L/min for 0min and5min respectively).Figure12
representschangesinthe meanCOvaluesthroughoutthe extratestperiod.
Baseline recordingsformeanTPRvaluesremainedconsistentthroughoutcontrol period(0.89 ± 0.04
at -10min).Figure 13 isrepresentative of changesinmeanTPRvaluesthroughoutthe heatingperiod
(10-40min) in comparisontothe control (-40 to -10min).Statisticallysignificantdecreaseswere
observedinmeanTPRvaluesat20min, 30min and 40min intothe heatingperiod(0.78 ± 0.04, 0.74 ±
0.03 and 0.71 ± 0.03; p<0.05 foreach time pointrespectively). All significantdatapointsrecorded
duringthe heatingtest periodwere measuredincomparisontothe lastmeanvalue takenduringthe
control (0.89 ± 0.04 forTPR at -10min).MeanTPR valueswere notsignificantlydifferentduring
period(5min) of the extratest(0.71 ± 0.03 and 0.76 ± 0.03 at 0minand 5min respectively).Figure 14
representsthe changesinmeanTPRvaluesforthe durationof the extratest.
9. 60.00
70.00
80.00
90.00
100.00
110.00
120.00
130.00
140.00
-40 -20 0 20 40
BloodPrssure(mmHg)
Time (mins)
Systolic Blood Pressure
Diastolic Blood Pressure
Mean Arterial Pressure
*
* *
Figure 5: Changes in Systolic Blood Pressure (SBP), Diastolic BloodPressure (DBP) andMeanArterialPressure (MAP)
during control period (-40min to -10min) thenintothe heatingperiod(10minto 40min). Subjects cardiovascular
measurments were taken using FinometerMIDI withsubject seatedandrestedforbothcontrol and heating period.
Druring heatingperiod subjects legs were submergedinheat bath(41-43°C) and wrapedinthermalblanket. Values are
means ± SE (n=28). Significant differences were obsevedfor all BP values at 30minintoheating period(p<0.05for SBP,
DBPand MAPrespectiv;ey). Significant differences were also recorded forallvalues at 40minof heatingperiod(p=0.04,
0.00&0.00 respectively). All significant readings inthe heating test were measuredin comparison to last recording of the
control (-10min).
*
* *
* Representssignificant
value (p<0.05) against
t=-10
60.00
70.00
80.00
90.00
100.00
110.00
120.00
130.00
140.00
0 1 2 3 4 5
BloodPressure(mmHg)
Time (mins)
Systolic
Blood
Pressure
Diastolic
Blood
Pressure
Mean
Arterial
Pressure
Figure 6: Changes in Systolic Blood Pressure (SBP), Diastolic BloodPressure (DBP) andMeanArterialPressure
(MAP) during extra test period(1-5min). Meausurment at time 0minis from the last readingtakenat endof
heating test. Duringextra test, cardiac readings were recordedonthe Finometer MINI withsubject seatedand
rested, legs placed in heat bath(41-43°C) andhandplacedintoice bucket. Values are means ± SE (n=28).
10. 70.00
75.00
80.00
85.00
90.00
95.00
100.00
-40 -30 -20 -10 0 10 20 30 40
HeartRate(Bpm)
Time (mins)
*
*
*
Figure 7: Changes in Heart Rate (HR) during control period(-40minto -10min) thenintothe heating period(10minto
40min). Subjects cardiovascular measurments were takenusing Finometer MIDI with subject seated andrested for both
control andheating period. Druring heating period subjects legs were submergedinheat bath (41-43°C) andwrapedin
thermal blanket. Values are means± SE (n=28). Significant differenceswere oberserved in the heating period at times
20min, 30minand40min(p<0.05 at eachreading). All significant readings inthe heating test were measuredin
comparisonto last recording ofthe control (-10min).
* Represents significant value (p<0.05) against t=-10
86.00
88.00
90.00
92.00
94.00
96.00
98.00
100.00
102.00
104.00
0 1 2 3 4 5
HeartRate(Beastpermin)
Time (min)
Figure 8: Changes in Heart Rate (HR) during extra test period (1-5min). ). Meausurment at time 0min is fromthe last
reading takenat endof heating test. During extra test, cardiac readings were recordedon the Finometer MINI with
subject seated and rested, legs placedinheat bath(41-43°C) andhand placed into ice bucket. Values are means ± SE
(n=28).
76.00
78.00
80.00
82.00
84.00
86.00
88.00
90.00
92.00
-40 -30 -20 -10 0 10 20 30 40
SttokeVolume(mL)
Time (mins)Figure 9: Changes in Stroke Volume (SR)duringcontrol period (-40min to -10min)then intothe heatingperiod(10minto
40min). Subjects cardiovascularmeasurments were takenusing FinometerMIDI with subject seated andrested for
both control and heatingperiod. Druringheating periodsubjects legs were submergedin heat bath(41-43°C) and
wrapedinthermal blanket. Valuesare means ± SE (n=28). Significant differences were recordedfor meanvalues at
30min and40mininto the heating period (.p<0.05 respectively).). All significant readings in the heating test were
measured in comparison to last recording of the control (-10min).
* *
* Represents significant value (p<0.05) against t=-10
11. 76.00
78.00
80.00
82.00
84.00
86.00
88.00
90.00
92.00
0 0.5 1 1.5 2 2.5 3 3.5 4 4.5 5
StrokeVolume(mL)
Time(min)
Figure 10: Changes in Stroke Volume (SV) during extra test period (1-5min). Meausurment at time 0minis from the last reading
takenat endof heatingtest. Duringextra test, cardiac readings were recordedonthe Finometer MINI with subject seatedand
rested, legs placed in heat bath(41-43°C) andhandplacedintoice bucket. Values are means ± SE (n=28).
5.00
5.50
6.00
6.50
7.00
7.50
8.00
-40 -30 -20 -10 0 10 20 30 40
CardiacOutput(L./mins)
Time (mins)
*
*
Fingure 11: Changes inCardiac Output (CO) duringcontrol period(-40minto -10min)theninto the heating period (10minto
40min). Subjects cardiovascular measurments were takenusing Finometer MIDI with subject seated andrested for bothcontrol
and heating period. Druring heatingperiodsubjects legs were submergedinheat bath(41-43°C) and wrapedinthermal blanket.
Valuesare means ± SE (n=28). Significant differences were observedin time periods 20min, 30minand40min into the heatingtest
(p<0.05 for each measurment). All significant readings inthe heating test were measuredincomparisonto last recordingof the
control (-10min).
*
* Represents significant value (p<0.05) against t=-10
6.60
6.80
7.00
7.20
7.40
7.60
7.80
8.00
0 0.5 1 1.5 2 2.5 3 3.5 4 4.5 5
CardiacOutput(L/Min)
Time (min)
Figure 12: Changes in Cardiac Output (CO) during extra test period (1-5min). Meausurment at time 0minis from the last reading
takenat endof heatingtest. Duringextra test, cardiac readings were recordedonthe Finometer MINI with subject seatedand
rested, legs placed in heat bath(41-43°C) andhandplacedintoice bucket. Values are means ± SE (n=28). An significant difference
was recordedat the finalmeasurment for mean SV (p=0.03).
12. 0.65
0.70
0.75
0.80
0.85
0.90
0.95
1.00
-40 -30 -20 -10 0 10 20 30 40
TotalPeripheralResistance
Time (mins)
*
*
*
Figure 13: Changes in Total Peripheral Resistance (TRP) duringcontrol period (-40minto -10min)then into the heatingperiod
(10min to 40min). Subjects cardiovascular measurments were takenusing Finometer MIDI withsubject seatedandrestedfor
both control and heatingperiod. Druringheating periodsubjects legs were submergedin heat bath(41-43°C) andwrapedin
thermal blanket. Values are means ± SE (n=28). Significant differenceswere observed intime 20min, 30minand at the endof
the heating period(p<0.05 foreachmeasurment). All significant readings inthe heating test were measuredincomparisonto
last recording ofthe control (-10min).
* Represents significant value (p<0.05) against t=-10
0.66
0.68
0.70
0.72
0.74
0.76
0.78
0.80
0.82
0 0.5 1 1.5 2 2.5 3 3.5 4 4.5 5
TotalPeripheralResisitance
Time(min)
Figure 14: Changes in Total Peripheral Resistance (TPR)during extra test period(1-5min). Meausurment at time 0minis
from the last readingtaken at endof heatingtest. Duringextra test, cardiac readings were recordedonthe Finometer
MINI withsubject seatedandrested, legs placedinheat bath(41-43°C) and handplacedintoice bucket. Valuesare
means ± SE (n=28).
Respiratory – Measurementsof RR,VE,VT and VO2 all recordedconsistentbaselinemeasurements
before the onsetof the heatingperiod(16.23bth/min ±0.92bth/min,10.08L/min ± 0.53L/min,0.61L
± 0.03L and 0.29L/min ± 0.02L/Min at -10minrespectively).Figures15-18 representchanges
observedforRR,VE, VT and VO2 respectivelyforthe durationof the Heatingperiod(10-40min) in
comparisontothe control (-40 to -10min).Statisticallysignificantincreaseswere recordedformean
RR valuesat the 20min,30min and 40min of heatingperiod(18.03bth/min ±1.07bth/min,
19.84bth/min ± 1.18bth/minand 19.37bth/min ± 1.10bth/min;p<0.05respectivelyforeachtime
point).Additionally,statisticallysignificantincreaseswere observedformeanVO2 values30minand
40min intoheatingperiod(0.31L/min ± 0.02L/min and0.32L/min ± 0.02L/min; p<0.05 respectively
for eachtime period).All significantdatapointsrecordedduringthe heatingtestperiodwere
measuredincomparisontothe lastmeanvalue takenduringthe control (16.23bth/min ±
13. 14.00
15.00
16.00
17.00
18.00
19.00
20.00
21.00
22.00
-40 -30 -20 -10 0 10 20 30 40
RespiratoryRate(breaths/min)
Time (mins)
*
* *
Figure 15: Changes in RespiratoryRate (RR)during control period(-40min to -10min) thenintothe heating period
(10min to 40min). Subjects were seatedandresteredduringbothcontrol and heatingperiods, while connected to
PowerLabpneumotachometer for 5minineach10min rotationfor bothtests. Values are means± SE (n=28).
Significant differences were observedat 20min, 30min and 40minintoheating period(p<0.05 respectively). All
significant readings inthe heatingtest were measured incomparisonto last recording of the control (-10min).
* Represents significant value (p<0.05)against t=-10
9.00
9.50
10.00
10.50
11.00
11.50
12.00
-40 -30 -20 -10 0 10 20 30 40
MinuteVenitlation(VE;L/min)
Time (min.)
Figure 16: Changes in Minute Ventilationrate (VE) during control period(-40minto -10min) thenintothe
heating period(10minto 40min). Subjects were seatedandresteredduringbothcontrol andheatingperiods,
while connectedto PowerLab pneumotachometer for 5min ineach10min rotationfor both tests. Values are
means ± SE (n=28).
0.92bth/min,10.08L/min ± 0.53L/min,0.61L ± 0.03L, 0.29L/min ± 0.02L/min; for RR, VE, VT and VO2
at -10min respectively).
Baseline calculationsforMRremainedrelativelyconstantthroughoutcontrol before
commencementof heatingperiod(204.65KJ/m2
/hr±7.48KJ/m2
/hrat -10min).Figure 19 represents
meancalculationsof subjectMR,withdata averagesmeasuredacrosstime forbothcontrol (-40 to -
10min) and heating(10-40min) periods.Statisticallysignificantincreaseswere calculatedformean
MR valuesat30min and 40min intoheating(221.43KJ/m2
/hr± 7.46KJ/m2
/hr and220.78KJ/m2
/hr ±
8.09KJ/m2
/hr;p<0.05 foreach time pointrespectively).All significantdatacalculatedduringthe
heatingtestperiodwere measuredincomparisontothe lastmeancalculationtakenduringthe
control (201.65KJ/m2
/hr ± 7.46KJ/m2
/hr forMR at -10min).
14. 0.56
0.58
0.60
0.62
0.64
0.66
0.68
0.70
0.72
-40 -30 -20 -10 0 10 20 30 40
Tidalvolume(L)
Time (mins)
Figure 17: Changes in Tidal Volume (VT) during control period(-40minto -10min) theninto the heating period
(10min to 40min). Subjects were seated and resteredduring both control and heating periods, while connected
to PowerLabpneumotachometer for 5minineach10min rotationfor both tests. Values are means ± SE (n=28).
0.26
0.27
0.28
0.29
0.30
0.31
0.32
0.33
0.34
-40 -30 -20 -10 0 10 20 30 40
Oxygenconsumption(VO2;L/min)
Time (mins)
* *
Figure 18: Changes in OxygenConsumption(VO2) during control period(-40minto -10min) thenintothe heating
period(10minto 40min). Subjects were seatedandresteredduring bothcontrol andheating periods, while connected
to PowerLabpneumotachometerfor5minineach10min rotationforboth tests. Values are means ± SE (n=28).
Significant differences observedfrom 30minand40minintoheating period(p<0.05 for both time points respectively).
All significant readings inthe heatingtest were measured in comparison to last recording of the control (-10min).
* Represents significant value (p<0.05) against t=-10
180.00
185.00
190.00
195.00
200.00
205.00
210.00
215.00
220.00
225.00
230.00
-40 -30 -20 -10 0 10 20 30 40
Meabolicrate(KJ/m2
/hr)
Time (mins)
Figure 19: Metabolic Rate (MR) changes duringcontrol period (-40min to -10min)then intothe heatingperiod(10min
to 40min). MR was calculatedfromsubjects bodysurface area(BSA), oxygen consumption(VO2) andKJ equivelence
and averagedacross distributionof data. Valuesare means ± SE (n=28). Significant differences observedfrom 30min
and 40minintoheatingperiod(p<0.05 for bothtime points respectively).All significant readings inthe heating test
were measuredincomparisonto last recordingof the control (-10min).
* *
* Represents significant value (p<0.05) against t=-10
15. Discussion
Previousstudieshave beenunable tofindthe primarytriggerforthe physical thermoregulatory
responsesseeninhumans.Additionally,little significantevidence hasbeenproducedinregardsto
whattype of thermorecpetorshave primarycontrol whenconflictingsensoryinputsare deliveredto
central control centres. Usingserial control methodology,significantimplicationsof
thermoregulatoryprocessesdue toheatingstresswasinvestigated,byraisingsubject’sbody
temperature undercontrolledconditions.Anoutcome of whichresultedinamultitude of significant
increases, whichmirroredasignificantdecreaseinTPRandSR. Furthermore,throughoutthe extra
testperiodmajorityof readingsinthe datashowednosignificantchange,allowingpossible
deductionstobe made on the primarycontrol centre forphysical thermoregulatorymechanisms.
Therefore,thesefindingspromoteastrongfoundationthatsupportsourhypothesisthatby
increasingCTcausesa decrease inTPR of cutaneousbloodvesselsaswell asdecreasingSR.
First, temperature rises recordedduringheattestingshowedsignificantincreasesinCTandlocal
skintemperatures.Theseincreasesagainstacontrol,correlatedwithsignificantchanges observedin
the majorityof meanvaluesmeasured.Thus, the heatingof subject’sbodytemperatures,while
preventingheatexchange intothe ambienttemperature resultedinheatgainbeinglargerthanheat
loss.Furthermore,significantdecreasesinMAPcan be measuredagainstvaluesinTPRandCO as
well asinSBP and DBP.In ad hoc, the trendseeninMAP correspondswith the significantdifference
of TPR. However,COincrease indicated apossible compensatorymechanismwhichmaybe taking
place as resultof the decrease inMAP.Congruently,respectivemovementsof DBPandSBP also
showconflictingchangesaddingtothe assumptionof compensatoryresponsesbeingincreaseddue
to rise inbodytemperature.Moreover,all meanvaluesforrespiratorymeasurementsshowed
notable increasesthroughoutthe heatingperiod.Additionally,calculatedMRvaluesshoweda
markedincrease forthe durationof the heatingperiod,promptingacausal linkbetweenenergy
producedandbodytemperature thathas beenincreasing.Furthermore,aweightydropinSRwas
recordedfromthe onsetof sweatingduringthe heatingperiod.
Second,inclinations of the extratestresultsdisplayednoreal significantchangesusingthe last
measurementsof the heatingperiodasacontrol.The onlydeviationinthe fluctuationsobserved
was fromtemperature measurementsof the forehead.However,majorityof positionsof each
recordingfurthervalidate ourhypothesisandforwardsouraiminfindingapossible primaryinitiator
for physical thermoregulatoryresponses.
SignificantelevationsinMeanbodytemperature (orCT) have beenrecordedinpaststudies
(Cabanacet al.1977; Havenith.2001; Kellogg.2006) due to passive heatstress,withsweat
production,vasomotorcontrol andheatproductionbeingdirectlyproportional toanincrease inCT
(Cabanacet al.1977; Havenith.2001; Kurz etal. 1995). Nevertheless,despite the large consensus,
furtherstudieshave pointedoutthe significance of behaviouralthermoregulatoryresponses(Frank
et al.1999) as well asdifferencesincore temperature changesbetweengenders(Lopezetal.1994).
For thisstudy,sample sizesbetweenbothgendersdonotpromote enoughvariabilitytobe sure
there issuch a difference.Nordidwe take inaccountany behavioural thermoregulatoryresponses.
In hindsight,furtherstudieswillneedtoincorporate bothof these possible implicationsinfuture
studyprotocols.
16. Particularemphasisof ourstudydesign involved cardiovascularandrespiratorychangesdue toheat
stress.Consistentwiththe resultsof ourstudy,priorstudieshave alsoreportedinstancesof highCO,
HR and Stroke Volume (Neilsenetal.1993; Sprangerset al.1991), howeverstudieslike Nielsenand
Michael et.al (1993) were conductedwithsubjectsundergoingstrenuousexercisetoincrease body
heatrather thana passive heattest.The implicationsbetweenasubjectatrestwithan elevatedCT
and a subjectincreasingCTdue to exercise remainunknownandneedsfurtherinvestigation.
SimilarlyincreasesinMR,VO2 and RR are consistentinpreviousresearch(Nielsenetal.1993;
Stephensonetal.1981), although,like withthe studyconductedbyNielsenandMichael et.al,the
studyran by Stephenson,MargaretandJames(1981) alsousedexercisingparticipantswhile raising
CT.
Of notable interestinmanypaststudiesisthe relevance of motorcontrol oncutaneousblood
vesselsandsweatglandsduringpassiveheating(Charkoudian.2003; Havenith.2001; Kellogg.2006;
Kurz etal. 1995). Of note,studyconductedbyN Charkoudin(2003) proposedahighbloodflow
observedduringpassiveheatingincreasedvasomotorresponsesin conjunctionwithonsetof
sweatingwasa primarypathwayfordissipationof bodyheat.These remarksare consistentwithour
findingswithasignificantdecrease overservedInTPRrecordings.Although,N.Charkoudin’s
researchprogramfocusedonpostmenopausal womenwithnotable hormoneimbalances,future
researchshould,asstatedbeforehand,differentiate betweenMale andFemale subjectswhile
keepingsubject’sage andhealthina consistentcategory.
CT risessuggestsbeingassociated withthe preventionof appropriate heatdissipation,byallowing
bodyheatgain to become greaterthanheatloss.Previousstudieshave made the connections
betweenthe increasesinambienttemperaturesandhumanactivelytotryandcool body
temperature throughhomeostaticmechanisms(Cabanacetal.1977; Fialaetal. 2001; Kurzet al.
1995). These homeostaticchangescanbe dividedintofourprimarydeductions.
Firstly,suchMechanismsmayinclude the notable decrease observedinTPR.Throughoutthe onset
of the passive heatperioditcouldbe suggestedthatinorderforheatto adequatelyescape the
body,vasomotorcontrol of the bloodvesselsof the peripherywere alteredsothatheatfromthe
bloodcoulddissipate intothe external environment. Vasodilatormechanisms have beenreported
as a consequence inan increase inskintemperature (Tanseyetal.2014) and onsetof sweating
(Cabanacet al.1977). Thus, witha substantial decreaseinTPRthenperhapsbeingacausal resultof
a release insympatheticvasoconstrictortonesinthe periphery(Tanseyetal.2014).
Secondly,the increase insympatheticactivityinthe peripherycanalsobe associatedwithcutaneous
sweatglandsandtheirsecretion. SRshowedanotable decrease duringpassive heatstress,of which
may be explainedbythe increase insweatsecretion. Ithas beenrecordedinpreviousstudiesthat
as sweatsecretionbuildsupa notable resistanceinskinresistancecanbe observed(Juniperetal.
1967), withsweatplayingavital role inthe coolingof the body (Tanseyetal.2014).
Thirdly, TPRdecrease couldbe consideredasaninitiatorforhomeostaticresponsesbythe meansof
a rise in CO,HR andSV. Assuch, increasesinCOandSV have beenrecordedinthe pastto be a
resultof a fall inTPR (Sprangersetal.1991) withbaroreflex stimulationtriggeringresponsesto
increase electrical stimulationof SA node,the force of cardiac muscle contractionsandvenous
return(Ichinose andNishiyasu.2012).Although,arecordeddecrease inMAPwas noted;as there is
botha markedfall inTPR andincrease inCO,it wouldseemoutof the two influences,TPRhadthe
more dramatic effectonoverall Arterial pressure,providingstrongervalidationthatTPRispossibly
the determininglinkbetweenthe thermovascularalterations recorded.Additionally,detectionsof
17. an increase inSBPand a decrease inDBP can be explainedinconjunctionwiththe above remarks.
SBP rise can be consideredasa resultinincreasedPressureinthe aortadue to an the increased
workloadof cardiac activity(Ichinose andNishiyasu.2012) while the decrease inTPRhasresultedin
decreasesobservedinmeanvaluesof DBPrecordingsaspressure invesselsof the peripheryhave
decreaseddue tovasodilation(Cabanacetal.1977; Sprangers etal.1991; Tanseyet al.2014).
Lastly,if the above deductionsare correct,increasesinvasomotorandcardiacactivityare goingto
needanincrease inenergyinorderto produce more work.Thiscan be supportedwiththe
significantincreaseinMRrecodedduringthe heatingperiod. IncreasesinMRhave beenshownto
contribute tosupplyingthe extraenergythe bodyneeds whenextraworkisrequired(Stephensonet
al.1981). Additionally,anincrease inMRhas alsobeenshowntocorrelate withan increase inheat
production(KennyandJay.2013), indicatingatthe possibilitythatspikesobservedMRmayalso
have contributedtothe increase inCT.With the Correlationwithanthe increase inVO2,Itmay be
possible tospeculate thatthe requiredenergy thatisneededtobe producedbyincreasingMR
wouldneedagreaterdemandinOxygen,hence the rise inbothOxygenconsumptionandRRthat
was seen.
Thus,the basisthata rise inCT has a profoundeffectoninitiationof physical thermoregulatory
mechanismsseemstohave merit.SupportingourHypothesisthatincreasesinCTcorrelatesdirectly
withstimulationof peripheral bloodvesselsandproductionof sweat.
However,the questionstill remainsonthe identificationof the appropriate thermorecpetorsthat
initiatesthermoregulatoryresponseswhenconflictinginformationisactingonbothcentral and
peripheral thermoreceptors. The positions inthe datawouldindicate asthe bodyisbeingheated
fromthe continuationof the heatingtestandperipheral thermoreceptorsare beingstimulatedby
conflicting“cold”signals;the bodyseemstocontinue toactivelydissipateheatratherthanto
immediatelyconserve heatdue toactivationof receptorsinthe periphery of the handthatwas
placedinice bath. Conversely,researchconductedinlaboratoryratsby Bratincsák,A (2005) has
shownthat peripheral ratherthancentral intracranial thermoreceptorsare responsible forprimary
thermoregulatoryresponses.Thoughourresults containedHumansubjects,the standinginourdata
woulddisagree,withthe exceptionof Foreheadtemperature.Thus,findingsatthisstage are
inconclusivewithfuture studiesperhapsinneedtoinvestigatefurther,possiblyusingalonger
periodforthe extratestingphase thanwasusedin thisstudy.
In conclusion,the studyhasprovidedastrongerconceptual foundationonhow thermoregulatory
responsesdue topassive heatingof CTcan leadtochangesthat bringthe body back tohomeostatic
normality.Inhindsight,more studiesshouldinvestigateinfuture the distinguishingproperties
betweenthe differentthermoreceptors,the differencesinthermoregulatoryprocessesbetween
femalesandmalesandpossiblebehavioural thermoregulatoryresponsesduringpassive heatstress.
SignificantrisesinCTappearedtohave a possible causal effectonthe Peripheral resistance of
cutaneousbloodvesselsaswell asthe onsetof sweatproductionduringstressheating.Inturn,
homeostaticcompensatoryelevationsinMR,VO2,RR and CO are suggestedtobe due to these
changesthat are initiatedtoforciblyreduce heatgain.Valueswouldsuggestcentral
thermorecpetorstobe the primarytriggersforthermoregulatoryresponseswhenconflictingsignals
are relayedtohypothalamiccontrol centres.
18. References:
1. Bratincsák, A., & Palkovits, M. Evidence that peripheral rather than intracranial thermal signals
induce thermoregulation. Neurosci. 13.5: 525-532. 2005.
2. Cabanac, Michel, and B. Massonnet. Thermoregulatory responses as a function of core
temperature in humans. J physiol 265.3: 587-596. 1977.
3. Charkoudian, Nisha. Skin blood flow in adult human thermoregulation: how it works, when it does
not, and why. Mayo Clin Proc.78.5: 603-612. 2003.
4. Fiala, Dusan, Kevin J. Lomas, and Martin Stohrer. Computer prediction of human
thermoregulatory and temperature responses to a wide range of environmental conditions
(Abstract). Internat J Biomet 45.3: 143-159. 2001.
5. Frank, Steven M., et al. Relative contribution of core and cutaneous temperatures to thermal
comfort and autonomic responses in humans. J Appl physiol 86.5: 1588-1593.1999.
6. Havenith, George. Individualized model of human thermoregulation for the simulation of heat
stress response. J Appl Physiol 90.5: 1943-1954. 2001.
7. Ichinose M, Nishiyasu T. Arterial baroreflex control of muscle sympathetic nerve activity under
orthostatic stress in humans. Front Physiol. 3:1-10. 2012.
8. Juniper K, Blanton D, Dykman R. PALMAR SKIN RESISTANCE AND SWEAT-GLAND COUNTS
IN DRUG AND NON-DRUG STATES. Psychophysiol. 4.2: 231-243. 1967.
9. Kellogg, D. L. In vivo mechanisms of cutaneous vasodilation and vasoconstriction in humans
during thermoregulatory challenges. J Appl Physiol 100.5: 1709-1718. 2006.
10. Kenny, G. P. & Jay, O. Thermometry, calorimetry, and mean body temperature during heat
stress. Comp Physiol. 3.4: 1689-1719. 2013.
11. Kurz, Andrea, et al. Thermoregulatory vasoconstriction impairs active core cooling.
(Abstract). Anesthesiology 82.4: 870-876.1995.
12. Lopez, Michael, et al. Rate and gender dependence of the sweating, vasoconstriction, and
shivering thresholds in humans. Anesthesiology 80.4: 780-788. 1994.
13. Nielsen, Bodil, et al. Human circulatory and thermoregulatory adaptations with heat acclimation
and exercise in a hot, dry environment. J physiol 460.1: 467-485. 1993.
14. Sprangers, R. L., et al. Initial blood pressure fall on stand up and exercise explained by changes
in total peripheral resistance. J Appl Physiol 70.2: 523-530. 1991.
15. Stephenson, L. A., MARGARET A. Kolka, and JAMES E. Wilkerson. Metabolic and
thermoregulatory responses to exercise during the human menstrual cycle (abstract). MSSE 14.4:
270-275. 1981.
16. Tansey, E. A., S. M. Roe, and C. D. Johnson. The sympathetic release test: a test used to
assess thermoregulation and autonomic control of blood flow. Adv physiol edu 38.1: 87-92. 2014.